Omodero Cordelia Onyinyechi* | Alege Philip Olasupo
OPEN ACCESS
The delegation of government fiscal expenditure is a significant avenue via which the required environmental quality is intended to be accomplished. Climate change is a big worry across the world. Every government is putting forth enormous effort to handle the problem in order to keep human occupancy across the globe. It is not out of place for the government to prudently allocate the necessary resources to Nigeria's three levels of government in order to maintain the environment. The government budget is the primary tool for capturing this expenditure obligation and enabling governments at all levels to bear it successfully. As a result, this study investigates the effectiveness of the three levels of government's fiscal obligations in reducing CO2 emissions in Nigeria. The study spans the years 2005 through 2020, with data analyzed utilizing numerous regression techniques and correlation. According to the data, state fiscal expenditure has a minor destructive impression on haze secretion management, however local government has a large deleterious bearing with smoke decline. On the other hand, federal government budgetary expenditure has a considerable and favorable influence on CO2 emission control. As a result, increased government resources are required to address the environmental pollution challenge. According to the report, all levels of government should invest heavily in green technologies in order to attain pollution-free living conditions. Fiscal spending delegation should apply pollution control adoption costs necessary for biodiversity conservation.
fiscal expenditure delegation, CO2 pollution, green technology investment, government levels, budget, JEL Classification Codes: E62, Q52, Q54, Q55, Q57
When it comes to managing greenhouse gas emissions, fiscal delegation of expenditure is required. The entire globe is decrying the rate at which environmental challenges are proliferating and endangering human habitations and lives. A society's capacity to feed itself, generate jobs, alleviate health concerns, and build the economy is inextricably related to the quality of its environment [1]. Environmental degradation and carbon dioxide (CO2) emissions have been a rising source of worry among researchers and politicians [2, 3]. Many emerging and advanced countries are sacrificing air quality and a cleaner ecosystem in order to achieve rapid production development. According to Li et al. [4], the greenhouse effect generated by CO2 emissions and other greenhouse gases will also cause some climate changes, which will have a severe influence on human health. The environment serves as the backdrop and setting for all human and developmental activities. It has an influence on almost all other industries and divisions of economic and social life. In contrast, what happens in other areas has a large impact on the quality of the environment in terms of its capacity to sustain human life. Because of worsening air quality and the environment, the demand for healthcare spending rises in order to maintain a healthy lifestyle [5]. Every year, air pollution kills 7 million people prematurely over the world [6]. The growth in environmental pollution caused by human emissions such as CO2 has an impact on the cost of healthcare expenses [7].
Carbon intensity are responsible for global warming created by the emission of greenhouse gases and industries during the processing of fuel usage of solid, fluids, cryogenic hydrocarbons, and gasoline vapors [8]. Gas bubbles production, according to Hadi et al. [8], are exceedingly damaging to the internal organs; the larger the incidence of Carbon dioxide emission in polluted air, the worse the impact on quality of life. Carbon pollution are a key cause of global warming [9]. A worldwide research of twelve nations found that estimations of Pollutant emissions since 1800, which deconstruct carbon output into greenhouse gases, have an influence on inhabitants and natural ecosystems, wealth, innovation, and free energy in ecology [10]. To avoid the worst warming of the planet, the world must move quickly or take immediate action to reduce the carbon footprint. Environmental pollution and protection have become increasingly severe in many emerging nations as a result of economic expansion, notably in Nigeria, where substantial quantities of oil and gas being explored. The primary reason for researching CO2 emissions is that they play an important role in environmental protection and sustainable development. Government regional spending has an influence on the environment in both direct and indirect ways [11].
Nigeria is one of Africa's most vulnerable countries in terms of biodiversity loss. Desertification has an impact on approximately 580,841 km of the country's land area, accounting for 63.83 percent of total land [1]. Consider the impact of the world's greatest deforestation rate paired with desertification on agricultural production, rural livelihoods, and economic growth. Current Nigerian climate metrics, on the other hand, are concerning. They show that only 7.7 percent of Nigeria's total land area is covered by forest cover, despite the fact that we have the world's highest deforestation rate [1]. Between 2000 and now, we have lost half of our forest cover. This cannot be likened to the following West African countries, which have forest covering of their land area: Benin (44.9%), Ghana (392%), Gabon (85.4%), Burkina Faso (22.8%), and Guinea Bissau (75.4%) are among the countries represented [1]. More than half of Nigeria's land mass is affected by habitat destruction.
Desertification affects 15 states in Northern Nigeria, with seven states experiencing severe habitat loss and the remaining eight experiencing centrist biodiversity loss [1]. These and many others, are serious ecological challenges requiring ecological money from time to time. The Ecological Fund is a mechanism for intervention intended to address the numerous ecological concerns afflicting communities across the country. The fund was designed specifically to solve the nation's ecological challenges, such as floods, coastal or soil erosion, desertification, drought, oil spillage, general environmental pollution, storms, tornadoes, bush fires, crop pests, landslides, earthquakes, and so on [12, 13].
The Ecological Fund was formed in 1981 by the Federation Account Act, 1981, based on the advice of the Okigbo Committee of 1980, in order to have a pool of funds dedicated only to supporting ecological concerns. The ecological fund was initially 1%, but following an upward review in 1992, it is presently 2%.
In Nigeria, the strata of government consists of the Federal Government, State Government, and Local Government, commonly known as the three levels/tiers of government. Each tier of government has the constitutional right to incur votes/expenditure that will help ameliorate environmental hazards in their region. In other words, each level of government has the constitutional authority to spend money to assist mitigate environmental concerns under their jurisdiction.
Thus, the government has a basic obligation to maintain the environment, as stated in Section 20 of the Federal Republic of Nigeria 1999 Constitution, "The State should preserve and develop the environment and protect the water, air, and land, forest, and wildlife of Nigeria" [14]. Because fiscal decentralization has a favorable role in boosting CO2 reduction, transferring fiscal expenditure power from the federal government to these provinces may be a practical way to attain low-carbon growth [15]. On that basis, the purpose of this research is to determine how successfully each tier of government in Nigeria has controlled greenhouse gases in their respective areas using their constitutionally authorized spending powers.
Ogunjiuba et al. [16] studied the impact of public funding on disaster risk reduction in Nigeria. It examined the pollutants (Carbon dioxide) gradient in Nigeria in relation to South Africa and Sub-Saharan Africa, as well as the mathematical linkage between social funding and extreme weather condition in Nigeria. It was determined that public funds on public goods might be used to strengthen Nigeria's climate warming avoidance and adaptation initiatives. Regardless of the fact that economic expansion and the standard of living were found to be strongly correlated with pollution, the results indicated that economic prosperity in Nigeria was not undertaken in a responsible fashion that took children's future into view. Halkos and Paizanos [17] examined the impact of state spending on the ecosystem from 1980 to 2000 using a panel of 77 countries. The paper estimated the consequences of rigorous environmental spending. According to the statistics, government expenditure was considered to have a negative direct impact on per capita emissions, but the direct impact on Pollutant emissions was modest. The moderating impact was unfavorable at low marginal cost but became beneficial as income increased, whereas the Greenhouse gas influence was unfavorable throughout the board.
He [18] revealed that budgetary autonomy had no big effect on radioactive pollution as measured by per capita emissions of sewage, biogas, or organic waste in a scheme assessment utilizing provincial panel data from 1995 to 2010. The study also revealed that financial liberalization had a significant and positive impact on pollution prevention investments and contaminant disposal costs, highlighting possible routes for fiscally devolution to help in ecological sustainability. Halkos and Paizanos [19] used Vector Autoregressions on quarterly data from 1973 to 2013 to analyze the influence of tax stimulus on Emissions of carbon dioxide. The research provided spontaneous responses to linear mixtures of budgetary disruptions, which corresponded to situations of deficit-financed expenditure and tax reduction. The study segregated Carbon dioxide emission from demand and supply in order to evaluate potential differences in the influence of financial measures based on effluents. According to the findings, implementing aggressive monetary expenditure reduced impurities from both contamination sources, but austerity tax cuts increased usage of carbon outputs.
According to the prediction of [20], the overall impacts of federal spending on three contaminants were quite distinct: declining, upsidedown, and Cylinder for hydrogen sulfide, charcoal, and total nitrogen, correspondingly. Furthermore, secondary impacts outnumbered immediate effects. Saida and Kais [21] estimated the link between medical costs, industrial contamination and economic development in Sub-Saharan African countries using annual data from 1990 to 2015. In the investigation, the ARDL estimation technique was employed to model the shorter and longer periods. The VECM Granger causality test was also used to assess the causal direction. To begin, the outcomes of the ARDL test revealed that economic progress had a favorable effects on the health expense, while Carbon intensity and Nitrogen oxide releases had a detrimental effect on health costs in the long run. Hadi et al. [8] looked at the influence of environmental degradation, demography, and economic factors on government healthcare costs. For the inquiry, multiple regression was used as an analytical tool. The findings revealed that increased government expenditure on health care was caused by demographic variables, such as an increase in the number of old individuals, as well as environmental issues, such as gas emissions.
From 1995 to 2014, Alimi et al. [5] investigated the association between environmental quality and healthcare cost in 15 ECOWAS countries. Three estimators were used to generate the empirical evidence: pooled OLS, fixed effects, and system GMM. According to empirical evidence, carbon emissions have a statistically significant positive impact on both public and national healthcare expenditures, however there appears to be no relationship between environmental pollution and private healthcare prices. Samah et al. [22] evaluated Malaysian government spending, business expansion, and Carbon intensity. According to the data, the causation direction flowed from industry and CO2 emissions to government spending. According to the study, CO2 emissions and manufacturing, both of which contribute to pollution, have a significant influence on government expenditure. Omodero [23] used a multiple regression model to investigate the impact of revenue fiscal structure on CO2 emission reduction in Nigeria from 2007 to 2020. Only the central government, according to the research, has a significant beneficial impact on pollution control. State and local governments have little impact on reducing carbon footprints. Onyimadu and Uche [24] study revealed, among other things, that government investment in climate change mitigation is focused on prevention rather than adaptation. Furthermore, among the NASPA – CCN strategy's targeted sectors, adaption initiatives focused at industry, commerce, telecommunications, and transportation were the most overlooked. The analysis revealed no substantial evidence to support the premise of boosting budgetary resources allocated to adaptation efforts.
From 1991 to 2017, Bilgili et al. [25] investigated the link between national and individuals’ healthcare expenses, sustainable growth, and smog in 36 Asian countries. The quantile regression results demonstrated that personal and corporate health costs had a significant impact on decreasing CO2 at the 50th and 75th quantiles, but not at the 25th. Ultimately, the analysis found that both public and private health-care investment lowered Greenhouse gasses in Asia, with the entrepreneurial health-care sector having a greater detrimental impact on Air quality than the public health-care sector. Zeraibi et al. [26] used regional datasets from 31 Chinese provinces from 2007 to 2017 to assess the impact of public expenditure on three specific contributors to environmental deterioration. The broad sweeping optimization approach and completely adjusted sum of squares were utilized in this research to analyze the co-integration link among the essential characteristics. The data demonstrated a high direct effect of government expenditure on promoting greater ecological integrity in Chinese areas, which increased as productivity recovery increased. The data, on the other hand, confirmed the inverted N-shaped relationship between haze and infrastructure prosperity per capita.
Ganda [27] studied the influence of medical costs on carbon footprint in BRICS countries from 2000 to 2017. In relation to economic healthcare costs, the quantity of existing health expenditures was highly and negatively associated to carbon emissions. Private medical cost was also revealed to be negatively and highly associated to emissions in terms of disaggregated components. Household broad national medical outlay and international health care costs, on the other hand, were found to be strongly and substantially connected to carbon pollution. There are additional country-specific results currently offered. The causation analyses found causal link between current healthcare costs, privatized medical expenses, and internal basic health cost and carbon output. Khan et al. [28] analyzed the role of devolution on fog using an equitable panel dataset from seven OECD countries between 1990 and 2018. The report also focused on the impact of establishments and social resources smoke production as a result of devolution. As a consequence, the study suggested that, in addition to the abovementioned effects, financial liberalization may have an indirect effect on Output through a range of sources, including structures and social capital. Devolution, as per empirical data, boosted ecosystem functions.
Boqiang and Ruiyang [29] examined the influence of the city modernization surroundings on the outcome of green technology advances on CO2 emissions in 264 prefecture-level cities in China from 2006 to 2017. The empirical findings revealed that green technology advances had a diverse influence in various sorts of localities. The study also found that green technology breakthroughs might cut CO2 emissions indirectly by upgrading industrial structures. When the urban innovation environment was taken into account, government fiscal investment had a considerable impact on the marginal weight of green technologies. Li et al. [4] investigated the link across BRICS medical costs, Carbon intensity, and GDP increases from 2000 to 2019. According to the study, Brazil and China exhibited long-term co-integration links in healthcare cost, Nox, and job creation. With Pollutant emanations as the criterion factor and wellbeing overheads and pecuniary progression as explanatory elements, there was a negative proven link in the near run between India's Pollutant radiations and expenditure on health; other nations only evidenced a unit link between CO2 discharges, health outlay, or industrial evolution.
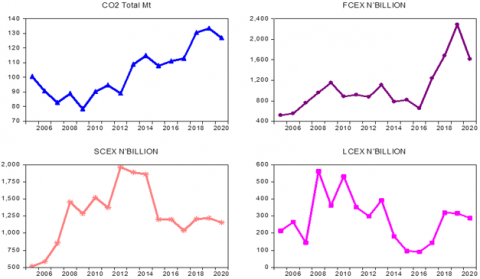
The paper examines the budgetary role of the three levels of government in protecting the environment from pollution and other environmental challenges. This analysis spans the years 2005 to 2020, utilizing secondary data from World Development Indicators and the Central Bank of Nigeria Statistical Bulletin. The statistics for government expenditure at the three levels of government are obtained in billions of Naira from Central Bank of Nigeria statistical records, whilst the data for CO2 emissions are acquired in metric tons from the World Development Indicators. Figures 1 and 2 depict the data visually.
Data sources: CBN and World Bank
Figure 1. Trend of data from 2005-2020
The key dependent variable is carbon dioxide emissions, and the data is acquired from the World Development Indicators, whereas the independent variables are the fiscal expenditures of Nigeria's three tiers of government, which are gathered from the Central Bank of Nigeria Statistical Bulletin.
Sources of data: World Bank and CBN
Figure 2. Data in charts
We utilized the logarithm form for all data in this investigation. There was a requirement for analytical testing to establish the integrity, homogeneity, and error freedom of the datasets and model chosen for this inquiry, therefore the diagnostic test results are presented in Table 3 and the unit root test results are shown in Table 2. Table 4 shows the results of a test for inter-correlation of the explanatory variables in the computation. The results of the multiple regression approach used to determine the influence of fiscal spending on climate change management in Nigeria are shown in Table 6. Table 5 illustrates the correlation matrix, which aids in assessing the relationship between the variables used for this study.
Thus, the model for this study is specified as follows:
CO2=f(FCEX, SCEX, LCEX) (1)
The econometric form of Eq. (1) is stated as:
LOGCO2t=β0 + β1LOGFCEXt+ β2LOGSCEXt + β3LOGLCEXt + εt (2)
where:
LOG =indicates the logarithm form of the datasets,
CO2=denotes Carbon dioxide emission as calculated by CO2 emissions in metric tons,
FCEX=Federal government fiscal expenditure,
SCEX=State government fiscal costs,
LCEX=Local government fiscal disbursements;
β0=Constant;
β1-β3=Regression coefficients;
εt= Error term.
On the a priori, we anticipate; β1 > 0, β2 > 0, β3 > 0.
The phrase "summary statistics" refers to the evaluation, summarization, and dissemination of conclusions from a data set generated from a sample or the full population. The rate of recurrence of various reactions is referred to as frequency distribution while central tendency provides information of where the majority of the research data points are located, variability highlights how far away the points are from one another. Table 1 demonstrated that the mean and the median of all the variables have approximately the same values, while the skewness and the Kurtosis have values that depict normal distribution. The Jarque Bera also has p-values that is above 5% which indicates that the datasets employed for this study are typically scattered.
Unit root tests are used to determine the stationarity of a time series. Stationarity exists in a time series when a change in time does not cause a change in the shape of the distribution; unit roots are one cause of non-stationarity [30-33]. For the unit root test, the Phillips-Perron test was applied in this research. The Phillips–Perron (PP) Test is a variant of the Dickey Fuller test that controls for autocorrelation and heteroscedasticity in mistakes [31]. Using PP test, the variables are stationary at order one (1), that is first difference and this result appears in Table 2.
Table 1. Summary statistics
|
|
LOG_CO2 |
LOG_FCEX |
LOG_SCEX |
LOG_LCEX |
|
Mean |
2.01 |
2.98 |
3.07 |
2.39 |
|
Median |
2.01 |
2.95 |
3.08 |
2.46 |
|
Maximum |
2.12 |
3.35 |
3.29 |
2.75 |
|
Minimum |
1.89 |
2.71 |
2.71 |
1.95 |
|
Std. Dev. |
0.07 |
0.17 |
0.16 |
0.23 |
|
Skewness |
0.09 |
0.46 |
-0.87 |
-0.47 |
|
Kurtosis |
1.88 |
2.68 |
3.28 |
2.28 |
|
Jarque-Bera |
0.85 |
0.64 |
2.11 |
0.93 |
|
Probability |
0.65 |
0.72 |
0.34 |
0.62 |
|
Sum |
32.17 |
47.78 |
49.25 |
38.38 |
|
Sum Sq. Dev. |
0.07 |
0.45 |
0.40 |
0.85 |
|
Observations |
16 |
16 |
16 |
16 |
Figure 3. Normality check
Table 2. Unit root test
|
VARI-ABLES |
PP |
PP 5% CRITI-CAL VALUE |
PP P-VALUE |
PP ORDER OF INTG. |
|
LOGCO2 |
-5.1 |
-3.10 |
0.00 |
I(1) |
|
LOGFCEX |
-3.6 |
-3.10 |
0.02 |
I(1) |
|
LOGSCEX |
-3.3 |
-3.10 |
0.03 |
I(1) |
|
LOGLCEX |
-4.5 |
-3.10 |
0.00 |
I(1) |
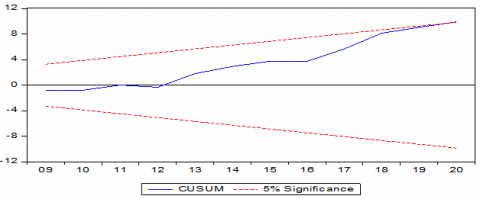
Figure 3 confirms the normal distribution of the datasets and when combined the Jarque Bera shows a p-value of 0.23 > 0.05, which indicates that all the datasets are normally distributed. Table 3 also includes additional diagnostic tests that check the integrity of the datasets and model utilized in this investigation. The Durbin-Watson and Breusch-Godfrey Serial Correlation LM tests show that there is no auto-correlation in the model. The Standard Error of Regression value of 0.06 indicates that the model prediction is devoid of bias. Figure 4 and 5 confirm the validity of the regression model through the appearance of the blue line in the middle of the two dotted red lines. This result is supported by the Ramsey RESET Test for stability which has the p-value of 0.14 being greater than 0.05 substantial level.
Table 3. Analytical checks
|
TYPE DIAGNOSTIC TESTS |
P-VALUE |
|
Ramsey RESET Test for Stability |
0.14 |
|
Breusch-Godfrey Serial Correlation LM Test |
0.56 |
|
Heteroskedasticity Test: Breusch-Pagan-Godfrey |
0.99 |
|
Histogram Normality Test: Jarque-Bera |
0.23 |
|
Standard Error of regression |
0.06 |
|
Durbin-Watson |
1.81 |
Table 4. Variance inflation factors
|
Sample: 2005 2020 |
|
||
|
Included observations: 16 |
|
||
|
|
Coefficient |
Uncentered |
Centered |
|
Variable |
Variance |
VIF |
VIF |
|
LOG_FCEX |
0.008693 |
391.9468 |
1.253851 |
|
LOG_SCEX |
0.009615 |
460.1722 |
1.217768 |
|
LOG_LCEX |
0.004334 |
126.8390 |
1.170176 |
|
C |
0.100075 |
504.1725 |
NA |
Table 5. Correlation analysis
|
Sample: 2005 2020 |
|
|
||
|
Included observations: 16 |
|
|
||
|
Correlation |
|
|
|
|
|
t-Statistic |
|
|
|
|
|
Probability |
LOG_ CO2 |
LOG_ FCEX |
LOG_ SCEX |
LOG_ LCEX |
|
LOG_CO2 |
1.000000 |
|
|
|
|
|
----- |
|
|
|
|
LOG_FCEX |
0.560386 |
1.000000 |
|
|
|
|
2.531626 |
----- |
|
|
|
|
0.0240 |
----- |
|
|
|
LOG_SCEX |
0.088617 |
0.384618 |
1.000000 |
|
|
|
0.332885 |
1.559037 |
----- |
|
|
|
0.7442 |
0.1413 |
----- |
|
|
LOG_LCEX |
-0.215003 |
0.336567 |
0.294963 |
1.000000 |
|
|
-0.823732 |
1.337338 |
1.155039 |
----- |
|
|
0.4239 |
0.2024 |
0.2674 |
----- |
In a regression model, multicollinearity arises when two or more independent variables are significantly associated with one another. In a regression model, this indicates that one independent variable may be predicted from another independent variable. The variance inflation factor (VIF) detects and quantifies the intensity of association between independent factors. According to Garson [34], the occurrence of multicollinearity among independent variables is unavoidable when the variance inflation factor (VIF) surpasses 4. Garson [34] believes multicollinearity exists where VIF is greater than 4. Gujarati and Porter [35], on the other hand, set the VIF benchmark at 10, meaning that a VIF of an independent variable greater than 10 indicates the existence of multicollinearity, which is unacceptable. As a result, using a multiple regression model is built on the hypothesis that the predictor variables are unconnected [36]. The VIF of all independent variables in this study is less than 4 and less than 10. By all definitions, there is no inter-connectivity among the predictor variables used in this study.
The data in Table 5 show the association that exists between the variables used in this study. Table 5 shows that FCEX has a moderate positive association with carbon emission, whereas SCEX has a very weak positive link with CO2 discharge and LCEX has a weak negative relationship with carbon dioxide pollution. Furthermore, the connection between the remaining independent variables is positive but modest. The consequence is that successful environmental pollution management will necessitate the pooling of resources from all levels of government. Thus, a poor relationship shows a lack of collaboration from the top down, which also represents a lack of effective governance in the country.
Figure 4. Validity test
Figure 5. Stability test
Table 6. Regression analysis
|
Dependent Variable: LOG_CO2 |
|
|||
|
Method: Least Squares |
|
|
||
|
Sample: 2005 2020 |
|
|
||
|
Included observations: 16 |
|
|
||
|
Variable |
Co-efficient |
Std. Error |
t-Statistic |
Prob. |
|
LOG_FCEX |
0.299621 |
0.093237 |
3.213548 |
0.0074*** |
|
LOG_SCEX |
-0.027370 |
0.098055 |
-0.279127 |
0.7849 |
|
LOG_LCEX |
-0.132336 |
0.065831 |
-2.010244 |
0.0674** |
|
C |
1.517715 |
0.316347 |
4.797629 |
0.0004 |
|
R2 |
0.500984 |
Mean dependent var |
2.010877 |
|
|
Adj. R2 |
0.376230 |
S.D. dependent var |
0.071355 |
|
|
S.E. of reg. |
0.056355 |
Akaike info criterion |
-2.701966 |
|
|
Sum2 resid |
0.038111 |
Schwarz criterion |
-2.508819 |
|
|
Log LH |
25.61573 |
H-Q. criter. |
-2.692075 |
|
|
F-statistic |
4.015775 |
Durbin-Watson stat |
1.805921 |
|
|
Prob(F-stat.) |
0.034209 |
|
|
|
*** Significant @ 1%; ** Significant @ 10%
The study considered that Nigerian spending fiscal obligations are best used in the country's CO2 emission reduction. However, the regression results show that SCEX has a negligible negative influence on CO2 pollution discharge while LCEX has a considerable and negative impact on CO2 emission. In other words, neither the state nor local governments have had any impact on CO2 emission reduction through their budgetary expenditure duties. On the other side, the findings demonstrate that FCEX has had a large and favorable influence on CO2 emission control. Although this is a major responsibility of the Federal Government of Nigeria to manage, the level of environmental pollution in the country's local communities and suburbs necessitates a collaborative effort by all three tiers of government to manage the situation for the maximum benefit of fiscal decentralization at the spending levels. Where these obligations fall only on the shoulders of the central government, the country's environmental degradation will worsen.
This study investigates the impact of fiscal delegation on environmental conservation in a developing economy. The time span is from 2005 to 2020. The data reveal that spending delegation at the federal government level has a major positive influence on emission control, but that delegation at the local government appears to be damaging, while delegation at the state government appears to be adversely insignificant. These consequences are the results of structural policy challenges that require that governments at the state and municipal levels ought to be sufficiently empowered to undertake both big and small obligations without relying heavily on the federal government.
The study concludes that green economy being championed by the United Nations Environment Programme should be supported by all levels of government in Nigeria through adequate investment in carbon minimizing technologies. As emphasized by Omodero and Uwalomwa [37], switching from primary energy springs to renewable power sources is considered healthier for the environment and the inhabitants. UNEP [38] equally stresses that green investments must be enabled and supported by targeted public spending, policy reforms, and taxes and regulatory improvements. As a result, government spending at all levels should be prioritized in order to eliminate environmental and air pollution. According to UNEP's [38] recommendations, the policymakers should consider green fiscal measures in order to protect the environment. Green technology advancements are viewed as beneficial means of balancing economic growth with environmental stewardship [29]. A green economy is one that is low in carbon, efficient in resources, and collaborative. Growth in employment and income in a green economy is driven by public and private investment in economic activities, infrastructure, and assets that allow for low greenhouse gas emissions and pollutants, increased energy and resource efficiencies, and the preservation of native vegetation [38].
The unrestricted access to this research output is financed by Covenant University Ota, Ogun State Nigeria.
[1] Onyekpere, E. (2016). The environment and the budget. https://punchng.com/the-environment-and-the-budget/, accessed on Mar. 12, 2022.
[2] Cheikh, N.B., Zaied, Y.B., Chevallier, J. (2021). On the nonlinear relationship between energy Use and CO2 emissions within an EKC framework: Evidence from panel smooth transition regression in the MENA region. Research in International Business and Finance, 55: 101331. https://doi.org/10.1016/j.ribaf.2020.101331
[3] Saida, Z., Kais, S. (2018). Environmental pollution, health expenditure and economic growth And in the Sub-Saharan Africa countries: Panel ARDL approach. Sustainable Cities and Society, 41: 833-840. https://doi.org/10.1016/j.scs.2018.04.034
[4] Li, F., Chang, T., Wang, MC., Zhou, J. (2022). The relationship between health expenditure, CO2 emissions, and economic growth in the BRICS countries—based on the Fourier ARDL model. Environmental Science and Pollution Research, 29: 10908-10927. https://doi.org/10.1007/s11356-021-17900-w
[5] Alimi, O.Y., Ajide, K.B., Isola, W.A. (2020). Environmental quality and health expenditure in ECOWAS. Environment, Development and Sustainability, 22(6): 5105-5127. https://doi.org/10.1007/s10668-019-00416-2
[6] UNEP. (2020). Letter from the Executive Director UNEP in 2020. https://wedocs.unep.org/bitstream/handle/20.500.11822/34917/AN2020.pdf, accessed on Mar. 22, 2022.
[7] Ahmad, M., Rehman, A., Shah, S.A.A., Solangi, Y.A., Chandio, A.A., Jabeen, G. (2021). Stylized heterogeneous dynamic links among healthcare expenditures, land urbanization, and CO2 emissions across economic development levels. Science of the Total Environment, 753: 142228. https://doi.org/10.1016/j.scitotenv.2020.142228
[8] Hadi, S., Panji, K., Yuliani, S. (2019). The impact of CO2 gas emissions on government Expenditure of health sector in Indonesia. E3S Web of Conferences, 125: 04004. https://doi.org/10.1051/e3sconf/201912504004
[9] Prasetyani, D., Putro, T.R., Rosalia, A.C.T. (2021). Impact of CO2 emissions on GDP per capita, FDI, forest area and government spending on education in Indonesia 1991-2020: The GMM methods. IOP Conference Series: Earth and Environmental Science, 905: 012131. https://doi.org/10.1088/1755-1315/905/1/012131
[10] Henriques, S.T., Borowiecki, K.J. (2017). The drivers of long-run CO2 emissions in Europe, North America and Japan since 1800. Energy Policy, 101: 537-549. https://doi.org/10.1016/j.enpol.2016.11.005
[11] Hua, Y., Xie, R., Su, Y. (2018). Fiscal spending and air pollution in Chinese cities: Identifying Composition and technique effects. China Economic Review, 47: 156-169. https://doi.org/10.1016/j.chieco.2017.09.007
[12] FAA. (1992). Federation Account Act. www.lawNigeria.com, accessed on Mar. 12, 2022.
[13] FAA. (2002). Federation Account Act. www.lawNigeria.com, accessed on Mar. 12, 2022.
[14] Federal Republic of Nigeria. (1999). Constitution of the Federal Republic of Nigeria 1999. Lagos: Federal Government Printer. https://publicofficialsfinancialdisclosure.worldbank.org/sites/fdl/files/assets/law-library-files/Nigeria_Constitution_1999_en.pdf on Mar. 10, 2022.
[15] Cheng, S., Fan, W., Meng, F., Chen, J., Liang, S., Song, M., Liu, G., Casazza, M. (2021). Potential role of fiscal decentralization on interprovincial differences in CO2 emissions in China. Environmental Science & Technology, 55(2): 813-822. https://dx.doi.org/10.1021/acs.est.0c04026
[16] Ogujiuba, K., Stiegler, N., Terfa, W.A. (2012). Impact of public expenditure on climate change In Nigeria: Lessons from South Africa. Journal of Economics and Behavioural Studies, 4(9): 515-522.
[17] Halkos, G.E., Paizanos, E.A. (2013). The effect of government expenditure on the environment: An empirical investigation. Ecological Economics, 91: 48-56. https://doi.org/10.1016/j.ecolecon.2013.04.002
[18] He, Q. (2015). Fiscal decentralization and environmental pollution: Evidence from Chinese panel Data. China Economic Review, 36: 86-100. https://doi.org/10.1016/j.chieco.2015.08.010
[19] Halkos, G.E., Paizanos, E.A. (2016). The effects of fiscal policy on CO2 emissions: Evidence from the U.S.A. Energy Policy, 88: 317-328. https://doi.org/10.1016/j.enpol.2015.10.035
[20] Zhang, Q., Zhang, S., Ding, Z., Hao, Y. (2017). Does government expenditure affect Environmental quality? Empirical evidence using Chinese city-level data. Journal of Cleaner Production, 161: 143-152. https://doi.org/10.1016/j.jclepro.2017.05.096
[21] Saida, Z., Kais, S. (2018). Environmental pollution, health expenditure and economic growth and in the Sub-Saharan Africa countries: Panel ARDL approach. Sustainable Cities and Society, 41: 833-840. https://doi.org/10.1016/j.scs.2018.04.034
[22] Samah, I.H.A., Abd Rashid, I.M., Husain, W.A.F.W., lskandar, S., Abdullah, M.F.S., Amlus, M.H. (2020). Government expenditure, manufacturing growth, CO2 emission: A causality analysis in Malaysia. International Journal of Energy Economics and Policy, 11(1): 373-377. https://doi.org/10.32479/ijeep.9766
[23] Omodero, C.O. (2021). Fiscal decentralization and environmental pollution control. International Journal of Sustainable Development and Planning, 16(7): 1379-1384. https://doi.org/10.18280/ijsdp.160718
[24] Onyimadu, C.O., Uche, D.S. (2021). Evaluating the Nigerian government’s financial obligations to climate change adaptation strategies. Climate Services, 24: 100261. https://doi.org/10.1016/j.cliser.2021.100261
[25] Bilgili, F., Kuşkaya, S., Khan, M., Awan, A., Turker, O. (2021). The roles of economic growth and health expenditure on CO2 emissions in selected Asian countries: a quantile regression model approach. Environmental Science and Pollution Research, 28: 44949-44972. https://doi.org/10.1007/s11356-021-13639-6
[26] Zeraibi, A., Balsalobre-Lorente, D., Shehzard, K. (2021). Testing the environmental kuznets curve hypotheses in Chinese provinces: A nexus between regional government expenditures and environmental quality. Environmental Research and Public Health, 18(18): 1-15. https://doi.org/10.3390/ijerph18189667
[27] Ganda, F. (2021). The impact of health expenditure on environmental quality: The case of BRICS. Development Studies Research, 8(1): 199-217. https://doi.org/10.1080/21665095.2021.1955720
[28] Khan, Z., Ali, S., Dong, K., Li, R.Y.M. (2021). How does fiscal decentralization affect CO2 Emissions? The roles of institutions and human capital. Energy Economics, 94: 105060. https://doi.org/10.1016/j.eneco.2020.105060
[29] Boqiang, L., Ruiyang, M. (2022). Green technology innovations, urban innovation environment and CO2 emission reduction in China: Fresh evidence from a partially linear functional-coefficient panel model. Technological Forecasting and Social Change, 176: 121434. https://doi.org/10.1016/j.techfore.2021.121434
[30] Everitt, B.S., Skrondal, A. (2010). The Cambridge Dictionary of Statistics. Cambridge University Press.
[31] Glen, S. (2022). Unit Root: Simple Definition, Unit Root Tests. StatisticsHowTo.com: Elementary Statistics for the rest of us! https://www.statisticshowto.com/unit-root/, accessed on Mar. 20, 2022.
[32] Kotz, S., Read, C.B., Balakrishnan, N., Vidakovic, B. (eds). (2006). Encyclopedia of Statistical Sciences. Wiley. https://www.wiley.com/en-us/Encyclopedia+of+Statistical+Sciences%2C+16+Volume+Set%2C+2nd+Edition-p-9780471150442, accessed on Mar. 1, 2022.
[33] Vogt, W.P. (2005). Dictionary of Statistics & Methodology: A Nontechnical Guide for the Social Sciences. SAGE. https://methods.sagepub.com/reference/dictionary-of-statistics-methodology, accessed on Mar. 2, 2022.
[34] Garson, G. (2012). Testing Statistical Assumptions. Asheboro, NC: Statistical Associates Publishing.
[35] Gujarati, D.N., Porter, D.C. (2009). Basic Econometrics (5th Ed.). Boston: McGraw-Hill Irwin.
[36] Australian Property Institute (2015). The Valuation of Real Estate. 2nd edition. Canberra, Australia: Appraisal Institute.
[37] Omodero, C.O., Uwalomwa, U. (2021). Energy absorption, CO2 emissions and economic growth sustainability in Nigeria. International Journal of Energy Economics and Policy, 11(4): 69-74. https://doi.org/10.32479/ijeep.11055
[38] UNEP. (2022). Green Economy. https://www.unep.org/regions/asia-and-pacific/regional-initiatives/supporting-resource-efficiency/green-economy, accessed on Mar. 12, 2022.