Nannaphat Phetkongtong
© 2022 IIETA. This article is published by IIETA and is licensed under the CC BY 4.0 license (http://creativecommons.org/licenses/by/4.0/).
OPEN ACCESS
This article aims to prioritize and assess each architecture element to ensure its compliance with the users’ needs, leading to interaction, and holistic interrelation as well as systematic solutions. As a result, fundamental data, and needs for the landscape architecture elements, were collected using a structured questionnaire with residents living in Muang District, the main service district. A structured interview was conducted with current visitors to the park and collected data concerning physical components for collaborative analysis. Article findings suggested that the elements are ranked and put into three groups: Group 1, the element of providing access, Group 2, the element of leading to activities, and Group 3, the element of creating a good environment. Consistent and more frequent visits represent the success of a designer. The designer could prioritize and assess each component to ensure compliance with the users’ needs, leading to interaction, holistic interrelation, and systematic solutions.
city park, landscape architecture elements, public space
Enlarged cities, entailing a growing population, necessitate a wide range of facilities, both personal and communal. Such facilities come at the expense of smaller green areas, which are replaced with buildings, traffic infrastructure, and other uses, whose necessity are regarded as overwhelming by the local government. Varying forms of green areas exist, ranging from acres of forest to small planted plots. Nevertheless, parks remain a communal space where the public can genuinely engage in their use, thus enabling increases in human effectiveness and potential. Despite such benefits, parks seem to generally receive relatively little attention, in terms of improvement and development, and it has come to our attention that our lives may be deprived of a critical factor in this way.
Public spaces are city spaces which allow access to people of different ages and genders, who may utilize the space for multiple purposes. For each specific purpose, there are differences in the context and particular area; however, what truly distinguishes the level of a park is its size. A city park not only serves those residing nearby but can also accommodate city festivals and active recreation areas [1]. Additionally, unlike buildings or architecture, the usage of parks underlines the utility of exterior areas. There are three types of outdoor activities, including necessary, optional, and social activities. The occurrence of more or fewer activities depends on the quality of the physical environment; in particular, optional activities increase when the exterior conditions are optimal [2]. Therefore, spatial planning, landscape planning, and the arrangement of components in each area determine whether a park will be used or not. Without physical components which are favorable to the arrangement of activities in the area in which a park is located, negligible interest is drawn to the park, directly resulting in a lack of usage. Such elements include the landscape architecture elements associated with access to the area and other nearby areas, as well as those comprehensively constituting activities in different places.
Parks consist of activity spaces, paths, and other landscape architecture components. Studies have revealed that the structures of a park dictate the dominant forms of activities performed therein, and that the improvement of a park requires strong co-operation from the community, in order to replace a visitor’s habit of “visiting” with that of “doing activities” [3]. Therefore, instead of being rigid in concept, parks should be open to constant modifications, development, and growth, as required by evolving contexts, eras, and people.
The need for park elements is related to comfortability, forming a link with the location of each park, depending on the geographical features and microclimate of the particular area. Thailand is in the tropical area between latitudes 5o 37” N to 20o 27” N and longitudes 97o 22” E to 105o 37” E, and features three seasons: summer, the rainy season, and winter [4]. However, given that Nakhon Si Thammarat is in the southern region of Thailand, its climatic condition is limited to the rainy season and summer. As a result, to achieve optimal design, the deliberate selection of components to facilitate the utilization of each area is remarkably necessary. There have been studies investigating parks in Thailand, in terms of how the softscape and hardscape influence temperatures. This means that effective area planning must make use of shades [5], such that trees, as landscape architecture components, are indispensable. Furthermore, the modification of urban temperature through a landscape approach can be achieved by incorporating sustainable landscape design practices, through the interplay of natural vegetation in the hot-humid tropics [6].
In Thailand, research on urban parks for sustainability, "Design Guidelines for Sustainable Urban Parks in Brownfield Sites of the Bangkok Metropolitan Area," found that there are three design approaches: Preserving the original environment in the garden, improving the treatment of the old environment to respond to the new application, and creating new physical elements to encourage design ideas to communicate better with users [7]. However, there is no question: why aren't those areas used? What is the real problem with the area being unused? If we want to develop, what should we start with?
Somdej Phra Srinagarindra 84 Park (Thung Thalad) was founded in 1984. This implies a lengthy period of existence, explaining the deteriorating conditions in every area of the park. Despite regular maintenance, it only accounted for a tiny proportion of what needed improvement, while the improvements made were also devoid of overall association or relation.
The satisfaction of use in the physical environment was studied in service facilities in 3 tourist areas, including Wat Phra Mahathat Woramahawihan, Sanamna Meang, and Somdet Phra Srinakarindra Park 84 (Thung Tha Lad). It was found that overall satisfaction was at a moderate level. However, it was the least in 3 areas, and there were suggestions to improve the cleanliness measures of the area. Landscapes in tourist areas should be more aesthetic [8].
It is noticeable that, despite the gradual deterioration of the physical components installed at the park, as well as an environment lacking proper maintenance, the park is still normally crowded with visitors in some areas while others area was unused. Consequently, this study aims at investigating the decision-making of the people using the public space, concerning the Hierarchy of Needs concept [9] and the concept of decision-making [10], in order to gain an understanding of the details of the area’s landscape architecture components in alignment with the climatic conditions and the behaviors of residents. With the collected data, we conducted an analysis, leading to the categorization, identification of the relation, and prioritization of the landscape architecture components, based on the needs of the park. That will affect the design or improvement of the area according to the priority.
People's prioritizing is related to choices and decisions. Therefore, Maslow's Hierarchy of Needs and Barnard's decision-making concepts are put forward to prioritize landscape architecture elements.
2.1 Maslow's hierarchy of needs
Based on the theory of the hierarchy of needs, established by Abraham Maslow, a notion concerning the motivation of humans was proposed. This theory states that humans are creatures of constant and endless needs, which continually increase. What a human need depends on what they have received or possess. When one need has been satisfied, yet another calls for fulfillment. As a result, the needs which have been fulfilled no longer motivate their behavior. On the other hand, those left unfulfilled are the next driving human motivation. Thus, human needs are hierarchical and exist in various aspects. Their levels of importance and urgency for living also vary; thus, humans first respond to the needs perceived as the most essential. Human needs can be theoretically divided into five aspects [9, 11]: 1. physiological needs, including air, water, food, and sexual needs; 2. safety needs, comprising needs for security and being free from fears or threats in various forms; 3. belongingness and love needs, comprising needs for love, a sense of belonging, and human contact; 4. esteem needs, comprising the need for self-respect, respect from others, praise, fame, and recognition; and 5. self-actualization, comprising the need for self-growth and the desire to exercise one’s capability to its fullest extent.
This concept, originally comprising five steps, has been further evolved into eight steps of needs [12]. While steps one to four remain the same, steps five to step eight have been reordered. Step five denotes memorizing, understanding, and being capable of making predictions or estimates of future needs. Step six underlines the need for beauty, aesthetic appreciation, balance, and form. Step seven is still concerned with self-actualization needs, involving the realization of an individual’s ability and potential to create self-growth and self-fulfillment. Step eight is transcendence needs, characteristically accompanied by complexity. This type of need is a supernatural need, whose scopes involve abstract beings such as beliefs, faith, or supernatural phenomena.
Based on the hierarchy of needs theory, the importance of designing landscape architecture elements, concerning existing human needs, has been well-acknowledged—not only responding to deficiency needs (steps 1–4), but also posing a consideration for growth needs (steps 5–8).
2.2 Decision making and repetition
Barnard described decision making as “a technique to consider options and narrow them down to one” [10]. Simon defined it as the process of finding opportunities to decide, seeking possible options, and choosing from the existing options [13]. Based on these definitions, it can be said that the perspectives of scholars may vary, in terms of details, but there still exist similar topics, as follows:
1. Decision making is a process, meaning that to make a decision requires a thinking process in which one elaborately engages in scrutinizing, analyzing, and finally making a decision, leading to the best option. Many have assumed that decision making is less of an act entailing intricate steps, instead relying on spontaneous impulses. In fact, decision making functions by searching for information, designing, and choosing, to ensure that the best options are chosen.
2. Decision making pertains to the solution: it is an attempt to create as many options as possible, as limited options are likely to deter creativity or superior alternatives. Administrators with advanced mindsets must exercise their ability to generate more and diverse options with the assistance of initiative and creative thinking.
3. Decision making involves an organizational structure. The administrators at each level have a distinct obligation to decide. Executive directors shall make a strategic decision, with intent to decide on the right approach to optimize resources and achieve organizational goals. Decision-making factors consist of: 1. A decision maker—a person with the ability to evaluate the value, benefits, or importance of each of the options; 2. options—the decision maker will be faced with certain options. If no options are available, nothing will be chosen; and 3. the results of previous options—this depends on the selection. Selection, in each account, is different and inequivalent, depending on the different circumstances.
Decision-making approaches can be categorized into three types, including normative, descriptive, and prescriptive approaches. A normative approach presents the highest possibility to generate the outcomes that a person desires [14]. A descriptive approach is an approach pointing out the ability to decide deviating from norms, by identifying biases and mistakes in choosing. Finally, a prescriptive approach enables a decision maker to choose the best options, based on both biases and mistakes [15].
2.3 Use of public space
Studies on public space are generally highly contextualized, as each society adheres to diverse definitions of the utilization of public spaces. At present, myriad forms of public space can be seen, such as a commercial area, community parks, gardens, playgrounds, natural conservation areas, and so on. These places coexist with our living; however, the motivation to create a public space is not enough to reflect human needs, in terms of both design and management [16]. A good public space must be responsive, democratic, and meaningful [17]. It has to function as a mechanism, driving interactions among people in a community, promoting a sense of belonging [18], and enhancing the life quality of local residents, which is crucial in the city context. Therefore, designing or planning requires the community to participate in the design of the space to know the needs and what exactly makes these spaces attractive for them [19]. Furthermore, it is the principal element constituting the activities of a community, constructing their identity and daily life through the use of space. Space must be characterized by its flexibility, connectedness, and multiple functionalities, allowing adaptability influenced by specific physical and social conditions. A city with identity is key to success in using public space [20].
The use of public space can be divided into two prime dimensions: namely, physical space and social space. These two dimensions are firmly intertwined. As a result, spatial dimensions always overlap each other in each community. Social meaning and functions are integrated with the physical dimension, leading to the unique identity of and relationships with the space [21]. Hence, each public space is simply defined by its distinct dimensions, in terms of its size, proportion of usage, proximity, and social roles, comprising levels, hierarchies, symbols, and meanings possessing uniqueness [22]. Designing public space in such a way that allows users to take their time and move slowly when using it adds more liveliness to the space [23].
2.4 Sustainability and Park Development Concept
A study by Cranz and Boland summarizes the concept of sustainable parks. Which arises from an interest in environmental issues. Whether it is global warming, temperature changes, the loss of ecosystems, and the diversity of life. Therefore, sustainable parks consider the ecological relationship of the city where the park is located, which consists of the natural environment (the conditions of soil, water, and air) and the biological environment (animals, people living in cities, and city systems). By emphasizing community participation in urban park management, whether in design, construction, or maintenance. The principle of sustainable parks is concerned with the cost-effective and sufficient use of natural and human resources within the park, integrating parks as part of the city system, and new aesthetic expressions in park design [24].
The analysis focuses on the new urban dimensions of the transport node. In the traditional days, urban planners and designers were accustomed to manipulating zones rather than connecting interactions or access. This phenomenon is perhaps the most obvious result of this evolution. The main idea is that in an increasingly mobile urban society, the quality of a place is essential to physical access and the quality of transportation, not only at airports and train stations but also in service areas along motorways, squares, urban parks, sidewalks, and bike lanes. The "mobility environments" concept can enable more precise planning and design strategies to cope with the increase of a borderless city system [25].
Eco-spatial sustainability study of urban parks A Case Study of Lampang Municipality, Thailand It was found that Lampang Municipality has 5 neighborhood parks and 3 community parks. Environmentally friendly spatial sustainability from the service relationship and public use of public park areas, namely parks with high access potential, between 0.975690 - 0.8824835, is consistent with the context of using commercial and residential buildings. The elements within the park meet the benchmark. Relate with a massive variety of users and activities [26].
The success of the park's development in the municipality of Krathum Baen, Thailand, resulted from its accessibility and the activities that occurred. Furthermore, some factors result in significant urban land-use change—guidelines for developing park areas that respond to government policies and follow public opinion. For example, it promotes and campaigns for the elderly to use more park services, promotes public participation in park management, sets criteria for service quality, and develops physical park areas [27].
2.5 City parks and landscape architecture elements
Previous studies on the definition of a sustainable city park in the United States of America have identified four types of city parks: The Pleasure Ground, the Reform Park, the Recreation Facility, and the Open Space System. Each type responds to social issues, not ecological ones [24]. At present, architectural design is divided into urban planning, architectural design, interior design, and landscape design, each of which is unique. Originally, the components of different areas were not separated. It can be said that every part forms a link and relation to another which, as a result, generates a collective impact. Landscape architectural design is, therefore, an integration between originality, the ecosystem, and culture, which blend together into the big picture. In other words, it is a combination between usage and a sense of place [28]. Therefore, the elements of landscape architecture are not rigidly confined to any fixed patterns but, instead, are situated beyond the used area, making their way to the used area either through the exteriors or interiors of buildings and other areas. We would like to explain two parts—namely, the landscape architecture design, comprising an activity space design, and elements of the landscape architecture, including elements of art, the environment, architecture, engineering, and sociology. Therefore, this term simply integrates landscape architecture design with landscape element components. Landscape architecture design is the art of designing exterior space (i.e., outside buildings) by emphasizing perspectives and perceptions which reach beyond the territory of usefulness. The general elements of the landscape can be categorized into hardscape and softscape.
Consequently, taking elements of landscape architecture into account not only creates space but also contributes to beneficial experiences in harmony with the needs of users and their sense of place. Furthermore, modifying spatial patterns under different contexts can also make space itself more appealing. Changes in social and environmental conditions can also lead to a change in the perceived sense of place [29].
3.1 Sampling strategy
For research on the Somdej Phra Sri Nagarindra 84 park in Mueang Nakhon SI Thammarat, Thailand, 400 samples were randomly chosen from the population, both inside and outside the park, from Mueang district, Nakhon Si Thammarat, using Yamane’s random sampling calculation [30]. In the process, of the total of 266,613 people residing in Mueang district, the calculation results based on Yamane’s formula yielded 400 samples. In order to have an even distribution, stratified randomness is used. Mueang district consists of 16 sub-districts, breaking down the number average into 20 in each district, making up 309 samples. The sample group in the area visiting Somdej Phra Srinagarindra 84 Park (Thung Thalad) were selected people who are doing various activities (144 individuals). The total number of sample groups was 453, using questionnaires and structured interviews.
3.2 Operating conditions
Direct observation—Qualitative data on elements of the landscape architecture in the area were collected, targeting data indicating the space in use and traffic routes. The data were obtained from a government office, including a map and distances measured using a distance calculating application, compared to an architectural layout plan. Data on planning and space arrangement were collected through photographs and notes, in order to gain insight into the elements of the physical characteristics and current problems, and to evaluate the results of the landscape architecture elements, concerning their functional conditions.
Data analysis—The indicators for recreation and parks determined in this research were as follows: Data were analyzed using a statistical program, yielding the need scores and score ranges of the access for usage related to different zones. The landscape architecture elements in each zone were surveyed on varying days at different times. Each of the elements were analyzed. The results of the analysis are presented in the form of percentages of effectiveness, elaborating on the decision to use or not use each area. The elements of landscape architecture were categorized according to factors listed in the questionnaire, in order to group and identify the relationships between the behavior concerning the decision to use the area and priority of the landscape architecture elements, as informed by the theory of the hierarchy of needs.
4.1 Land use observation
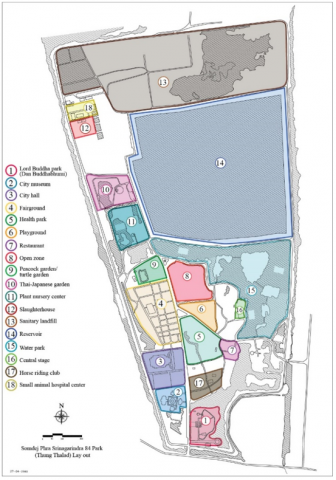
A survey on the current operating conditions revealed that the park’s area (494.07 acres) was divided into 18 zones, including a health park, playground, restaurant, open zone, Lord Buddha park (Dan Buddhabhumi), city museum, central stage, fairground, town hall, peacock garden/turtle garden, Thai–Japanese garden, plant nursery center, horse riding club, water park, reservoir, slaughterhouse, small animal hospital center, and sanitary landfill (Figure 1). Three aspects were specifically focused on in each survey, as follows:
1. Activity: The survey aimed to collect data regarding the current physical characteristics; which, in other words, indicated how the place was being used, as observed and reflected by the officials in charge.
2. Facilities: Eight physical elements were evaluated, including restrooms, streets, ramps, footpaths, sitting areas, drinking water, first-aid services, and trash cans.
3. Environment: Five elements were used as environmental criteria, including landscape, air quality, noise, light/shade, and odor pollution.
Figure 1. Map of area utilization within the park (Thung Thalad)
4.2 Space category
The proportions of areas, categorized based on how they are used, are detailed in the following table. As shown in Table 1, the area serves tourism, exercise, social, and eating purposes, as well as facilitating other activities and hobbies.
A survey of the use of the 18 areas revealed that the three most frequently used areas included the playground (48.57%), the health park (45.03%), and the open zoo (26.05%). On the contrary, the least frequently used areas were the plant nursery center (1.32%), the small animal care center (1.32%), and the slaughterhouse (1.99%); see Table 2.
Table 1. The percentage of purposes for using the park
|
|
Total (%) |
Inside the park (%) |
Outside the park (%) |
|
For tourism |
39.51 |
9.93 |
29.58 |
|
For exercise |
28.26 |
8.17 |
20.09 |
|
For friend meeting |
24.72 |
11.48 |
13.24 |
|
For eating |
9.71 |
2.65 |
7.06 |
|
Others |
8.17 |
4.86 |
3.31 |
|
For hobbies |
3.09 |
1.55 |
1.54 |
Table 2. The percentage of frequency of ranking of area utilization
|
|
Total (%) |
Inside the park (%) |
Outside the park (%) |
|
Playground |
48.57 |
18.1 |
30.47 |
|
Health park |
45.03 |
15.23 |
29.8 |
|
Open zoo |
43.49 |
12.14 |
31.35 |
|
Restaurant |
26.05 |
5.96 |
20.09 |
|
Fair ground |
16.34 |
1.99 |
14.35 |
|
Water park |
15.67 |
8.83 |
6.84 |
|
Peacock/Turtle garden |
14.57 |
5.96 |
8.61 |
|
City museum |
12.8 |
5.52 |
7.28 |
|
Thai-Japanese park |
10.38 |
3.53 |
6.85 |
|
City hall |
7.51 |
1.99 |
5.52 |
|
Lord Buddha park |
5.74 |
1.99 |
3.75 |
|
Central stage |
3.31 |
0.88 |
2.43 |
|
Reservoir |
3.31 |
1.55 |
1.76 |
|
Sanitary landfill |
2.43 |
0.88 |
1.55 |
|
Slaughterhouse |
1.99 |
0.88 |
1.11 |
|
Horse riding club |
1.99 |
0.88 |
1.11 |
|
Plant nursery center |
1.32 |
0.44 |
0.88 |
|
Small animal care center |
1.32 |
0.66 |
0.66 |
Table 3. The percentage of relationship between frequency and purposes
|
|
Every-day |
More than once a week |
Once a week |
Once a month |
Once a year |
|
For exercise |
2.87 |
10.6 |
5.74 |
5.96 |
3.09 |
|
Others |
2.21 |
1.1 |
0.88 |
1.55 |
1.99 |
|
For friend meeting |
1.55 |
4.42 |
5.52 |
10.15 |
2.87 |
|
For hobbies |
1.55 |
0.44 |
0.44 |
0.44 |
0.22 |
|
For tourism |
1.55 |
4.19 |
3.97 |
15.23 |
14.35 |
|
For eating |
0.44 |
1.32 |
1.99 |
4.19 |
1.55 |
According to the relationship between frequency and purpose (see Table 3), the areas could be divided into four groups:
1. Occasionally visited areas—These areas are defined by monthly or weekly visits, and appeared to match the purpose of both visitors residing in the area and those from outside the area the most (i.e., for tourism). In particular, visitors from outside the area were likely to visit the open zoo, the fairground, the water park, the peacock/turtle garden, and the city museum, for the purpose of pleasure.
2. Daily visited areas—These areas are defined by their everyday access, at a frequency of more than once per week. The areas serve the purposes of daily life and health, including the playground, the health park, and the restaurants. These areas corresponded with the purposes of the locals visiting the park daily higher than those from outside the area. The locals leaned toward the friend meeting as their most common purpose in these areas.
3. Areas visited by specific groups—These areas are defined by other purposes and hobbies. These areas corresponded to the smallest group of users, compared to other purposes, ranking fifth and sixth, overall. The areas in this category included the town hall, the Lord Buddha park (Dan Buddhabhumi), sanitary landfill, the horse riding club, the slaughterhouse, the small animal care center, and the plant nursery center.
4. Areas whose utilization did not match their intended function—The survey indicated that some areas periodically had zero access; however, these areas were accessed for unintended purposes. They included the Thai–Japanese park, the central stage, and the reservoir.
Table 4. The percentage of relationship between visit patterns and frequently visited places
|
|
Visit alone (%) |
Visit with friends/partners (%) |
Visit with families/ caretakers (%) |
|
Playground |
3.53 |
20.53 |
23.4 |
|
Open zoo |
2.43 |
17.44 |
22.96 |
|
Health park |
4.64 |
20.31 |
19.21 |
|
Restaurants |
1.55 |
13.69 |
10.6 |
|
Water park |
1.32 |
5.74 |
8.39 |
|
Fairground |
1.1 |
6.84 |
8.17 |
|
Peacock/Turtle park |
1.77 |
5.96 |
6.62 |
|
City museum |
0.88 |
7.06 |
4.64 |
|
Thai-Japanese park |
0.88 |
6.4 |
2.87 |
|
City hall |
0.88 |
3.75 |
2.65 |
|
Horse riding club |
0.22 |
0.22 |
1.55 |
|
Small animal care center |
0 |
0 |
1.32 |
|
Slaughterhouse |
0.22 |
0.66 |
1.1 |
|
Sanitary landfill |
0.22 |
0.88 |
1.1 |
|
Reservoir |
0.88 |
1.32 |
0.88 |
|
Lord Buddha park |
0.44 |
2.65 |
0.88 |
|
Plant nursery center |
0.44 |
0.22 |
0.66 |
|
Central stage |
0.88 |
1.77 |
0.66 |
1. Areas accommodating group activities—This type of area accommodates the needs of people of all ages and sexes. This characteristic contributed to the highest aggregated visits to these areas, as they support a wide range of activities and allow for collaborative actions.According to Table 4, showing the relationships (in percentage) between visiting patterns and frequently visited places, the top three places constantly visited by those accompanied by families or caretakers were the playground (23.4%), the open zoo (22.96%), and the restaurants (10.6%). The top three places visited by those accompanied by friends or partners were the health park (4.63%), the playground (3.53%), and the open zoo (3.53%). The results demonstrated that decisions to choose between the groups accompanied by families and friends were related, in that the aggregated visits of these two groups were similarly high in the areas accommodating group activities, including the playground and the peacock and turtle garden. However, it was noticeable that the aggregated visits of those with friends or partners were more dominant than those with families in some areas, namely the health park and the restaurants. Hence, the areas were categorized into three groups, as follows:
2. Areas accommodating individual activities—Most of the people in this group were middle-aged and capable of taking care of themselves. The aggregated visits of this group were second to those of the family group; however, these areas are still the main areas where people visit to absorb the relaxing environment of a city park, such as the health park, the restaurants, and the museum.
3. Areas accommodating specific activities—These areas are devoted to those with specific interests which involve either individual or group activities, such as the town hall, the horse riding club, the Lord Buddha park (Dan Buddhabhumi), and the park’s complimentary facilities (e.g., the plant nursery center, the reservoir, and the small animal care center).
The results suggested that the most problematic issues, as perceived by the respondents, were environmental problems (24.72%), safety problems (18.98%), user-caused problems (16.11%), mismatching activities (15.67%), lack of facilities (14.35%), access problems (10.6%), and thoroughfare problems (7.28%).
4.3 User needs
The results regarding the landscape architecture elements originated from the collection of data divided into six aspects, including access, traffic, activities, facilities, environment, and social interaction. The evaluation was based on user need scores in each of the aspects. The results ranged between most needed, highly needed, moderately needed, slightly needed, and least needed, corresponding to scores of 5, 4, 3, 2, and 1, respectively.
The elements of access that were most needed by people were appropriate sizes and routes (receiving a score of 3.91), convenient parking space locations in connection with other areas (3.80), convenient public transportation to the park (3.68), and safety in entering the park (3.67). In terms of important traffic elements, routes and clear/convenient directions (receiving a score of 3.75), paths being equipped with ramps (3.66), proper pavement and path sizes (3.62), utilization in varying weather (e.g., rain, sunlight) (3.62), and rest areas provided throughout the circulation (3.61) were ranked highly by respondents.
For elements in the activity aspect, activities meeting the needs of users were most needed (with a score of 3.64), variety of activities (3.60), appropriate access to the activity areas (3.58), and appropriate locations of activity areas (3.55) were considered important. In terms of facilities, users needed the adequate provision of restrooms, proper outdoor seats, proper trash cans, first-aid care spots, and drinking water spots (with scores of 3.47, 3.35, 3.21, 3.13, and 3.09, respectively).
The necessary elements in the environmental aspect were an aesthetic and appropriate landscape, sufficient light and shade, fresh air, appropriate noise conditions, and no odors (with scores of 3.71, 3.68, 3.57, 3.55, and 3.30, respectively). For the social interaction elements, importance was given to equal access to the area, higher self-esteem, chances to meet and interact with others, and the ability to help themselves with confidence (with scores of 3.77, 3.75, 3.73, and 3.69, respectively).
The average score of needs for elements of access was 3.76, while that for elements of social feelings was 3.73, that for elements of traffic was 3.65, that for elements of activities was 3.64, that for environmental elements was 3.56, and that for elements of facilities was 3.25.
4.4 Landscape architecture elements characteristics
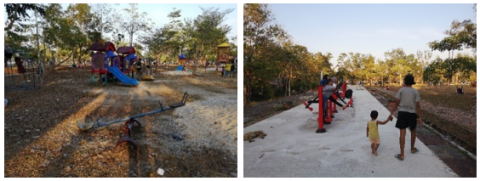
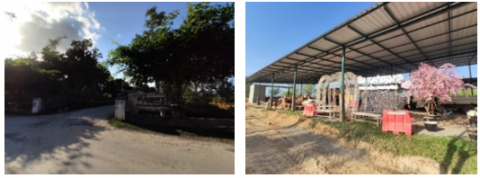
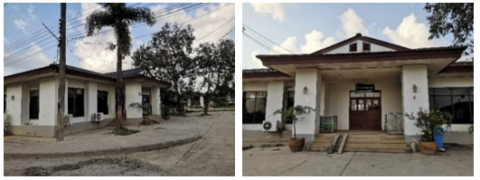
By comparing the three most frequently used areas Tables 5-6 showed that most of the physical components were at a good level. Including the environment in Figures 2-4 will be shady and people use regularly. This is different from the quality of the three least frequently used areas that have poor quality physical elements (Tables 7-8) and poor environment in Figures 5-7.
Table 5. Evaluation results of the physical elements in the zones ranking as the three most frequently used areas
|
No. |
Physical elements |
Playground |
||
|
Yes |
No |
Quality |
||
|
1 |
Street |
$\sqrt{ }$ |
Good |
|
|
2 |
Ramp |
$\sqrt{ }$ |
- |
|
|
3 |
Path |
$\sqrt{ }$ |
Good |
|
|
4 |
Restroom |
$\sqrt{ }$ |
Poor |
|
|
5 |
Seat |
$\sqrt{ }$ |
Poor |
|
|
6 |
Drinking water |
$\sqrt{ }$ |
- |
|
|
7 |
First-aid service |
$\sqrt{ }$ |
- |
|
|
8 |
Trash can |
$\sqrt{ }$ |
Fair |
|
|
No. |
Physical elements |
Health park |
||
|
Yes |
No |
Quality |
||
|
1 |
Street |
$\sqrt{ }$ |
|
Good |
|
2 |
Ramp |
|
$\sqrt{ }$ |
- |
|
3 |
Path |
$\sqrt{ }$ |
|
Good |
|
4 |
Restroom |
|
$\sqrt{ }$ |
- |
|
5 |
Seat |
$\sqrt{ }$ |
|
Fair |
|
6 |
Drinking water |
|
$\sqrt{ }$ |
- |
|
7 |
First-aid service |
|
$\sqrt{ }$ |
- |
|
8 |
Trash can |
|
$\sqrt{ }$ |
- |
|
No. |
Physical elements |
Open zoo |
||
|
Yes |
No |
Quality |
||
|
1 |
Street |
$\sqrt{ }$ |
|
Good |
|
2 |
Ramp |
|
$\sqrt{ }$ |
- |
|
3 |
Path |
$\sqrt{ }$ |
|
Good |
|
4 |
Restroom |
$\sqrt{ }$ |
|
Fair |
|
5 |
Seat |
$\sqrt{ }$ |
|
Good |
|
6 |
Drinking water |
|
$\sqrt{ }$ |
- |
|
7 |
First-aid service |
|
$\sqrt{ }$ |
- |
|
8 |
Trash can |
$\sqrt{ }$ |
|
Fair |
Figure 2. Landscape of playground
Table 6. Evaluation results of the activity and environment aspects in the zones ranking as the three most frequently used areas
|
Playground |
||
|
No |
Aspect |
Quality |
|
1 |
Landscape |
Fair |
|
2 |
Air quality |
Good |
|
3 |
Noise |
Good |
|
4 |
light and shades |
Good |
|
5 |
Odor |
Good |
|
Health park |
||
|
No |
Aspect |
Quality |
|
1 |
Landscape |
Fair |
|
2 |
Air quality |
Good |
|
3 |
Noise |
Fair |
|
4 |
Light and shade |
Good |
|
5 |
Odor |
Good |
|
Open zoo |
||
|
No |
Aspect |
Quality |
|
1 |
Landscape |
Fair |
|
2 |
Air quality |
Good |
|
3 |
Noise |
Good |
|
4 |
Light and shade |
Good |
|
5 |
Odor |
Good |
Figure 3. Landscape of health park
Figure 4. Landscape of open zoo
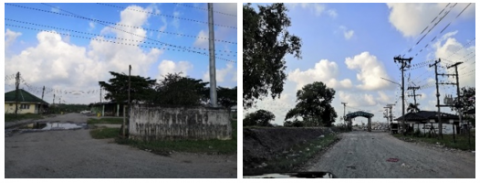
Figure 5. Landscape of plant nursery center
Figure 6. Landscape of small animal care center
Table 7. Evaluation results of the physical elements in the zones ranking as the three most unused areas
|
No. |
Physical elements |
Plant nursery center |
||
|
Yes |
No |
Quality |
||
|
1 |
Street |
$\sqrt{ }$ |
Poor |
|
|
2 |
Ramp |
$\sqrt{ }$ |
- |
|
|
3 |
Path |
$\sqrt{ }$ |
Poor |
|
|
4 |
Restroom |
$\sqrt{ }$ |
Fair |
|
|
5 |
Seat |
$\sqrt{ }$ |
Poor |
|
|
6 |
Drinking water |
$\sqrt{ }$ |
- |
|
|
7 |
First-aid service |
$\sqrt{ }$ |
- |
|
|
8 |
Trash can |
$\sqrt{ }$ |
Poor |
|
|
No. |
Physical elements |
Small animal care center |
||
|
Yes |
No |
Quality |
||
|
1 |
Street |
$\sqrt{ }$ |
|
Poor |
|
2 |
Ramp |
|
$\sqrt{ }$ |
- |
|
3 |
Path |
$\sqrt{ }$ |
|
Poor |
|
4 |
Restroom |
$\sqrt{ }$ |
|
Poor |
|
5 |
Seat |
$\sqrt{ }$ |
|
Poor |
|
6 |
Drinking water |
|
$\sqrt{ }$ |
- |
|
7 |
First-aid service |
|
$\sqrt{ }$ |
- |
|
8 |
Trash can |
$\sqrt{ }$ |
|
Poor |
|
No. |
Physical elements |
Slaughterhouse |
||
|
Yes |
No |
Quality |
||
|
1 |
Street |
$\sqrt{ }$ |
|
Poor |
|
2 |
Ramp |
|
$\sqrt{ }$ |
- |
|
3 |
Path |
$\sqrt{ }$ |
|
Poor |
|
4 |
Restroom |
$\sqrt{ }$ |
|
Poor |
|
5 |
Seat |
$\sqrt{ }$ |
|
Poor |
|
6 |
Drinking water |
|
$\sqrt{ }$ |
- |
|
7 |
First-aid service |
|
$\sqrt{ }$ |
- |
|
8 |
Trash can |
|
$\sqrt{ }$ |
- |
Table 8. Evaluation results of the physical elements in the zones ranking as the three most frequently used areas
|
Plant nursery center |
||
|
No |
Aspect |
Quality |
|
1 |
Landscape |
Poor |
|
2 |
Air quality |
Good |
|
3 |
Noise |
Good |
|
4 |
Light and shade |
Fair |
|
5 |
Odor |
Poor |
|
Small animal care center |
||
|
No |
Aspect |
Quality |
|
1 |
Landscape |
Poor |
|
2 |
Air quality |
Poor |
|
3 |
Noise |
Fair |
|
4 |
Light and shade |
Poor |
|
5 |
Odor |
Poor |
|
Slaughterhouse |
||
|
No |
Aspect |
Quality |
|
1 |
Landscape |
Very poor |
|
2 |
Air quality |
Very poor |
|
3 |
Noise |
Fair |
|
4 |
light and shades |
Poor |
|
5 |
Odor |
Very poor |
Figure 7. Landscape of slaughterhouse
5.1 Decision to use the area
The usage of an area mainly depends on the associated types of activities, as well as whether they are carried out with others, between two individuals, or on one’s own. According to Maslow’s hierarchy of needs, it is evident that the types of activities chosen were generally associated with an individual’s basic needs, ranging from physiological needs (including physical activities and dietary needs) to safety needs. The aggregated visits to the three most visited areas—namely, the playground (a recreational place for families), the health park (maintaining physical fitness), and the restaurants (survival)—reflected this association. Close proximity not only allows for interaction but also a sense of safety. Additionally, evaluation of the problems reported by respondents indicated that problems concerning safety were second to those relating to the environment of the park. Therefore, social needs scored the highest, in this aspect. Based on Maslow’s concept that needs that remain unfulfilled will continue to be motivators, this translates into an insight: the park’s areas have not been capable of responding well to the social needs of users.
According to Barnard’s concept of decision making, we carried out an analysis assessing the associations between the crucial characteristics of landscape architecture elements which serve to prompt visits. The three most frequently used areas, initially established with well-equipped conditions and superior physical elements, were well reflected in Group 1. This encourages overwhelming access to the area. Additionally, good evaluation results for the activity and environmental aspects further complement this decision. On the contrary, the evaluation results for the physical elements in the three least-used areas revealed the poor quality of physical elements in Group 1. Such conditions subsequently lead to little access, as associated with the poor evaluation results in the activity and environmental aspects.
Table 9. Ranking of the relationship between the current physical elements and users’ needs for landscape architectural elements
|
Element |
score |
No |
Items with highest scores |
score |
No |
|
Aspect of access |
3.76 |
1
|
Appropriate sizes and paths |
3.91 |
1 |
|
Aspect of social feelings |
3.73 |
2 |
Equal access to the area |
3.77 |
2 |
|
Aspect of thoroughfare |
3.65 |
3 |
Clear thoroughfare, directions and convenience |
3.75 |
3 |
|
Aspect of activities |
3.64 |
4 |
Activities meeting the needs |
3.64 |
5 |
|
Aspect of environment |
3.56 |
5 |
Aesthetic and appropriate landscape |
3.71 |
4 |
|
Aspect of facilities |
3.25 |
6 |
Restroom adequately responding to users’ demands |
3.47 |
6 |
In addition, options are components playing a significant role in decision making. Decisions are related to those making them, the options, and the results of the decisions. Based on an analysis of the area chart and the location of areas for different activities, it can be seen that the three most frequently used areas exhibited associations, in terms of their proximity and characteristics of related activities, as well as their daily capacity to accommodate users. This proves that this decision has achieved its results, as stated in the concept.
The areas in this park characterize public areas in terms of their physical, cultural, and societal dimensions. This can be observed through how the areas are used, leading to four groups of areas: namely, areas used daily, areas used on an occasional basis, areas used exclusively by certain groups, and areas whose intended functions do not match their actual use. Schemes to improve public areas in modern times emphasize quality of life and a sense of belonging among community members. This insight was reflected in the proportion of frequently used areas, compared to those that were left unused and underdeveloped. Above all, one vital—but absent—component was a sense of belonging or ownership of the area. Due to ineffective proportions of use, the considered park may not yet have achieved its optimal outcome as a public park.
5.2 Physical elements priority
Data pertaining to elements of the six aspects were analyzed, yielding average scores that were then compared with the sub-topics of each of the aspects obtaining the highest scores. It was found that the relationships shown in Table 9 held true. That is, virtually every topic presented a range of needs, except for the activity and environmental aspects, which exhibited switched patterns. As a result, it can be concluded that landscape architecture elements—considering their importance, together with the results of evaluation of the physical elements—can be divided into three groups, as follows:
Group 1: This involves the elements establishing a thoroughfare in the area, including streets, paths, ramps, and other factors related to access (receiving a score of 3.91), as well as navigation within the area (receiving a score of 3.75) and the social feeling aspect (receiving a score of 3.77). Thus, it is consistent with the concept of a sustainable park and the integration of parks as part of the urban system [24]. Physical access or the quality of transport, the 'mobility environments' concept can enable more evident planning and design strategies [25]. This results in a great diversity of users and activities [26]. It is linked to Group 2 architectural elements. Park development success results from taking into account access and activities [27].
Group 2: This group involves the functions and activities in each zone, contributing to associations. It includes seats, public restrooms, drinking water, trash cans, and first-aid kits, which are associated with the elements of activities and facilities, consistent with the concept of public space, which is the main focus. This physical element leads to spending time in space. They affect both the physical and social dimensions, which reflect the quality of life of people in the community.
Group 3: This group creates an environment leading to satisfaction and repeated use. It includes the landscape, air quality, noise, light, and odor associated with environmental elements. This is consistent with the concept of sustainable parks on the topic of New Aesthetic Expressions [24]. Improving landscapes in tourist areas may be aesthetic [8] but landscapes may not be the first point of action in terms of their importance.
Basic human needs essentially dictate the importance of landscape architecture elements. Humans will perceive and make continuous decisions to use an area only if such a decision is evaluated as being successful when creating a link with their options and the outcomes of their previous usage. Therefore, the arrangement and locations of functions should allow for continuity, such that the activities can be carried out together.
However, landscape architecture elements are always factors determining the degree of access to activity areas, as well as creating the impression which leads to the return (or not) of users to the park. As a result, ranking the importance of landscape architecture elements is absolutely crucial for the design and planning of a city-level park whose area is not only large but also allows for a variety of activities.
In conclusion, the park at the city level should be improved or developed. Development should begin with elements relating to the provision of access to the area, in terms of different forms of paths and routes connecting the park with the outside (other communities or cities) and the facilitation of navigation inside the park itself (e.g., streets, paths, and ramps) with a focus on event space design, creating connections and interactions among people, as well as allowing them to live comfortably in the area (e.g., seats, restrooms, drinking water, trash cans, and first-aid kits). Finally, satisfaction leads people to return to the area continuously (e.g., landscape, air quality, noise, light, and odor).
I would like to express my gratitude to Walailak University for providing Research Grant for Individuals 2019 (contract no. WU62250). I would also like to sincerely thank the research participants and research assistants. This study would not have been successful without their support and active cooperation.
[1] APA. (1965). Standards for Outdoor Recreational Areas. https://www.planning.org/pas/reports/report194.htm, accessed on Sep. 8, 2020.
[2] Gehl, J. (1987). Life Between Buildings: Using Public Space. New York: Van Nostrand Reinhold.
[3] McCormack, G., Rock, M., Swanson, K., Burton, L., Massolo, A. (2014). Physical activity patterns in urban neighbourhood parks: Insights from a multiple case study. BMC Public Health, 14(1): 962. https://doi.org/10.1186/1471-2458-14-962
[4] TMD. (2019). Thailand’s country profile. https://www.wmo.int/pages/prog/amp/pwsp//documents/ThailandPWSfont.pdf, accessed on Sep. 10, 2020.
[5] Hopatchanajinda, M. (2015). The effect of landscape elements on microclimate. Journal of Energy and Environment Technology of Graduate School Siam Technology College, 2(1): 23-36. https://doi.org/10.1155/2018/2809649
[6] Thani, S.K.S.O., Mohamad, N.H.N., Idilfitri, S. (2012). Modification of urban temperature in hot-humid climate through landscape design approach: A review. Procedia - Social and Behavioral Sciences, 68: 439-450. https://doi.org/10.1016/j.sbspro.2012.12.240
[7] Devakula, J. (2007). Design guidelines for sustainable urban park in brownfield sites of Bangkok metropolitan area. Journal of Architectural/Planning Research and Studies, 5(3): 125-138.
[8] Jomkarn, Y., Suthasupa, S. (2015). The evaluation on touristic area in Nakhon Si Thammarat Municipality: A case study of Phramahathat Woramahawihan temple, Na Mueang Park and Thalad Park. Journal of Environmental Design, 2(2): 29-47.
[9] Maslow, A.H. (1943). A theory of human motivation. Psychological Review, 50(4): 370-396. https://doi.org/10.1037/h0054346
[10] Barnard, C.I. (1938). The Functions of the Executive. Cambridge: Harvard University Press. https://doi.org/10.5465/amle.2017.0420
[11] Maslow, A.H. (1954). Motivation and Personality. New York: Harper and Row.
[12] Maslow, A.H. (1970). Motivation and Personality (2nd ed.). New York: Harper & Row.
[13] Simon, H.A. (1974). Administrative Behavior. 1st. ed. New York: Macmillan. 133.
[14] Edwards, W. (1954). The theory of decision making. Psychological Bulletin, 51(4): 380-417. https://doi.org/10.1037/h0053870
[15] Strough, J., Parker, A., Bruin, W. (2015). Chapter 12 - Understanding life-span developmental changes in decision-making competence. Aging and Decision Making, 235-257. https://doi.org/10.1016/B978-0-12-417148-0.00012-1
[16] Carr, S., Stephen, C., Francis, M., Rivlin, L.G., Stone, A.M. (1992). Public Space. Cambridge: Cambridge University Press.
[17] Mehta, V., (2013). Evaluating public space. Journal of Urban Design, 19(1): 53-88. https://doi.org/10.1080/13574809.2013.854698
[18] Sukolratanametee, S. (2015). Enhancing sense of community through environmental design elements. NAJUA: Architecture, Design and Built Environment, 29: 475-488. https://so04.tci-thaijo.org/index.php/NAJUA-Arch/article/view/44316.
[19] Jamhawi, M., Al-Shawabkeh, R., Alobaidat, E. (2020). Spatial modeling of transformation of public open spaces in Zarqa, Jordan, International Journal of Sustainable Development and Planning, 15(5): 685-703. https://doi.org/10.18280/ijsdp.150511
[20] Erdoğan, B.D., Ayataç, H. (2015). Assessment of urban identity characteristics in public places: A case study of Ortaköy Square. A|Z ITU Journal of the Faculty of Architecture, 12(1): 115-125.
[21] Chaowana, K., Jiraprasertkun, C. (2017). Observations from the study of the phenomenon of public space in Kiriwong Village, Nakhon Si Thammarat. Veridian E-Journal, Silpakorn University, 10(3): 1701-1719. https://he02.tci-thaijo.org/index.php/Veridian-E-Journal/article/view/110187/86460.
[22] Carr, S., Stephen, C., Francis, M., Rivlin, L.G., Stone, A.M. (1992). Public Space. Cambridge University Press.
[23] Gehl, J. (2010). Cities for People, London: Island Press.
[24] Cranz, G., Boland, M. (2004). Defining the sustainable park: A fifth model for urban parks. Landscape Journal, 23(2): 102-120. https://doi.org/10.3368/lj.23.2.102
[25] Bertolini, L., Dijst, M. (2003). Mobility environments and network cities. Journal of Urban Design, 8(1): 27-43. https://doi.org/10.1080/1357480032000064755
[26] Summaniti, L. (2020). Spatial sustainability of eco-friendly urban park: A case study of Lampang municipality. Academic Journal of Architecture, 7: 1-18.
[27] Khongouan, W., Khamwachirapithak, P. (2020). Park area development plan in response to the government policies and standards: Case study of Krathumbaen Municipality, Samut Sakhon. Journal of Architectural/Planning Research and Studies, 17(2): 111-128. https://doi.org/10.14456/jars.2020.19
[28] Whitfield, M. (2019). Toward holistic landscape conservation in the 21st century. https://www.lincolninst.edu/sites/default/files/pubfiles/whitfield_wp19mw1.pdf, accessed on Nov. 25, 2020.
[29] Quinn, T., Bousquet, F., Guerbois, C., Sougrati, E., Tabutaud, M. (2018). The dynamic relationship between sense of place and risk perception in landscapes of mobility. Ecology and Society, 23(2): 39. https://doi.org/10.5751/ES-10004-230239
[30] Yamane, T. (1973). Statistics: An Introductory Analysis. 3rd Ed. New York. Harper and Row Publications.