Siska Amelia* | Ernan Rustiadi | Baba Barus | Bambang Juanda
© 2022 IIETA. This article is published by IIETA and is licensed under the CC BY 4.0 license (http://creativecommons.org/licenses/by/4.0/).
OPEN ACCESS
There are different characteristics distinguishing a region from the others, thereby, leading to the diversities in the regional potentials and problems as well as the strategic regional development policies to be implemented. The East-West Corridor is one of the eleven provincial strategic economic areas in West Sumatra. It covers nine regencies or cities and 65 sub-districts with different characteristics and typologies and this leads to diversity in the strategies to develop this area. This study aims to determine the diversity associated with the characteristics and typologies of the strategic area of the East-West Corridor. This involved using Principal Component Analysis (PCA) analysis technique, spatial clustering analysis, and overlay analysis. Moreover, the regional characteristics and typologies were grouped based on 17 observational variables used in producing four main components including trade and tourism services, agriculture, livestock/fishery, and tourism. The results of spatial clustering analysis produced 3 clusters which are the urban, desa-kota, and rural areas while the overlay analysis produced ten regional characteristics and typologies used as the basis to make strategies and policies for each region’s development and to increase investment opportunities in the strategic area of West-East Corridor and the Province of West Sumatra in general.
regional development, development strategy, sustainability development, urban-rural development, spatial analysis
Strategic areas are regions prioritized in order to accelerate regional development through the utilization of local resources [1] and the improvement of community welfare [2]. They are considered very important for regional development [3] due to their significant multiplier effect on the region [4]. They also have specific characteristics distinguishing them from other regions [5]. Distinguishing characteristics based on economic potential, topography, geography, and regional typology. The terminologies used for strategic areas vary with different countries and these include the Artic Zone [6], specific economic zone [7], airport economic zone [8], potential border zone [9], river economic zone [10-12], special zone [13], special economic zone [14-16], special border economic zone [17], and heritage corridor [18].
The conceptual role of strategic areas is to encourage the regional economy [3, 14, 19]. This means they are expected to act as the growth centers or corridors which can be used to drive economic growth [20]. They are normally designed to be the prime mover of development in a particular area. Moreover, there is usually a concentration of population conducting several economic and social activities with a strong influence on the development of the surrounding area.
These strategic areas also have characteristics distinguishing them from other regions [5] and this means they have different potentials and problems, thereby, leading to the need for specific strategies for development in each region [21, 22]. Some of the areas studied in previous studies include industrial [16, 23], trade [15], service [7], forest [24], as well as mining and energy areas [10]. It was discovered that the differences in the characteristics of these areas led to a variation in the factors influencing their development [25].
West Sumatra Province has eleven strategic economic areas [26] and one of them is the west-east corridor [27] which has specific characteristics observed to be different from those of others. This, therefore, makes the area has specific problems [28] which require a particular approach to handle. The corridor covers several administrative areas such as the Padang City, Padang Panjang City, Pariaman City, Bukitinggi City, Payakumbuh City, Padang Pariaman Regency, Tanah Datar Regency, Agam Regency, and Limapuluh Kota Regency. It is located on the west-east axis and has the highest frequency of economic movement of goods and services as well as a higher growth rate than other provinces in the western part of Sumatra. Moreover, the west and east axes also have tourism potential in addition to the existence of a trade and service corridor. It is important to note that each of the nine regencies and cities in this area has different potentials and characteristics, and this means the development of the East-West Corridor strategic area requires considering the diversity in these potentials [29].
The strategic economic area in West Sumatra is characterized by trade and services, ocean fisheries, industry, and tourism in line with the potentials and problems of each region. This means the response and development strategy to be employed needs to be based on each region. Determination of regional characteristics and typology will help local governments to make regional development policies and strategies. Therefore, this present study was conducted to determine and analyze the characteristics and typologies of the strategic economic areas in a specific corridor in order to ensure the sustainable development of the region.
This study uses factor analysis in the form of Principal Component Analysis (PCA) to reduce many variables into new variables that are independent of each other and do not have multicollinearity problems. PCA analysis in research related to regional development is often associated with Geographic Information Systems (GIS) to study spatial dynamics. Regional typology classification is done using spatial clustering analysis.
2.1 Study area
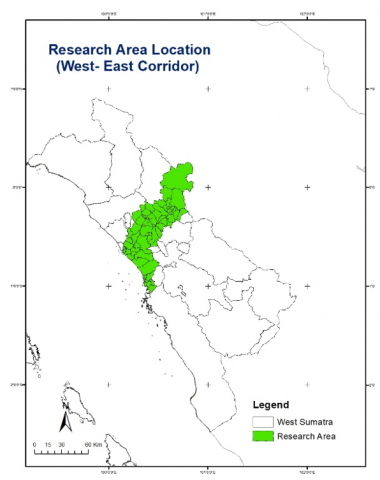
This research was conducted in the West-East Corridor which consists of nine (9) regencies/cities and sixty-five (65) sub-districts with a sub-district analysis unit as indicated in Figure 1. The nine regencies/cities include Agam Regency, Limapuluh Kota Regency, Tanah Datar Regency, Padang Pariaman Regency, Padang City, Pariaman City, Padang Panjang City, Bukittinggi City and Payakumbuh City.
Figure 1. Research area location
The strategic economic areas of the West-East Corridor were delineated based on the definition of arterial roads as stated in Government Regulation number 34 of 2006 concerning Roads. Also, PD 5-01-2004-B concerning Construction and Building Guidelines: Criteria for space utilization and control of space utilization along with primary arterial network between cities. It was discovered from the document that the arterial roads continuously connect national, regional, and local activity centers to environmental activity centers.
2.2 Data collection and processing
The secondary data from the Central Bureau of Statistics in Kecamatan Dalam Angka 2020 [30] were used in this study. They are multidimensional because they combine both spatial and non-spatial data as indicated in Table 1. This data provides objective results to make it easier to formulate strategies and policies to increase investment and develop the East-West Corridor. The variables used are variables that represent the region's economic potential and a characteristic of regional typology [7, 9, 15].
The analysis of the diversity associated with the characteristics of the West-East Corridor was conducted in two stages. The first focused on determining the region's characteristics based on its potential using the method of Principal Component Analysis (PCA) while the second involved grouping the typologies through the Spatial Clustering method based on the weighting results on each of the observation locations. This spatial clustering is a simple concept observed to have been implemented in different areas such as landscape management [31], irrigation management [32], national food policy [33], the efficiency of the infrastructure of the region [34], and to determine the geographical pattern and characterize individual and environmental sociology [35].
Table 1. Observation variables and operational definitions
|
Variable |
Operational definition |
|
Production of agriculture (ton) |
Total production of agricultural products |
|
Fishery production (ton) |
Total production of fishery products |
|
Livestock and Poultry Population (head) |
Total population of farm animals |
|
Tourist sites (unit) |
Number of tourist attraction locations |
|
Restaurant (unit) |
Number of restaurants |
|
Hotel (unit) |
Number of hotels |
|
Inn/motel/guesthouse (unit) |
Number of Inns/motels/guesthouses |
|
Hospital (unit) |
Number of hospitals |
|
Shops/trades (unit) |
Number of Shops/Trades |
|
Bank(unit) |
Number of state, private, and rural banks |
|
Cooperative (unit) |
Number of Active Cooperatives |
|
Agricultural harvest area (ha) |
Total harvested area of agricultural products |
|
Tourist visit (person) |
The number of both national and foreign tourist visits |
|
Rice Field Area (ha) |
The total area of rice fields |
|
Population density (people/ha) |
Total population versus regional area |
|
Forest area (ha) |
The total area of forest land |
|
Clean water user households (KK) |
Number of households using Local Water Supply Utility (PDAM) for clean/drinking water |
Principal Component Analysis (PCA) was used to determine the characteristics of the observations grouped based on the region's potential. This is due to its ability to transform a data structure with a variable free (x) which is mutually correlated into a new data structure with one or more new variables containing a combination of independent variable (x) liveliness [36]. PCA can also simplify the origin of a polynomial variable into a new small variable with relatively unchanged diversity [37]. This method has been applied in the process of planning and developing a region to assess the spatial dynamics [38], socio-economic [39], and ecology [40] of the region as well as to serve as an evaluation tool [41].
PCA is a multivariate analysis that transforms the correlated origin variables formed into uncorrelated new variables. It reduces the number of these variables to ensure they have smaller dimensions which can explain most of the diversity of the original variables. This dimension simplification can be achieved through the percentage of the data diversity criteria described by the first few significant components. For example, when the first few significant components have more than 70% of the original data diversity or have a root (λ) greater than 1, then, it is sufficient to analyze up to the significant component. Moreover, the first significant component represented by PC1 contains a large amount of total data variation, and this means it can be linearly combined with variable Xi; i=1, 2, ..., p.
$P C_{1}=a_{11} X_{1}+a_{12} X_{2}+\cdots+a_{1 p} X_{p}$
$P C_{2}=a_{21} X_{1}+a_{22} X_{2}+\cdots+a_{2 p} X_{p}$
$P C_{p}=a_{p 1} X_{1}+a_{12} X_{2}+\cdots+a_{1 p} X_{p}$ (1)
where, PC1 is the first factor, PC2 is the second factor, and the same applies to the others. This sequence reflects the magnitude of the variance of each variable noted as var (PC1) ≥ var (PC2) ≥ ... ≥ var (PCp). In PCA, the variants of most variables are expected to be as small as possible to ensure the PC variables obtained have a small number but large variants.
The external results from the main component variables of PCA analysis were grouped into three clusters according to the typology of the region using spatial clustering analysis. This method involves grouping several objects in a class or cluster such that the objects in one cluster have a remarkable resemblance with each other but have none with those in other clusters [42, 43]. The clustering was reported to have previously been conducted using distance sizes such as Euclidean Distance, Mahalanobis, or Diagonal Distance [44]. The application of this technique is in two categories with the first being the determination of the existence of clusters in a study area while the second involves identifying the location of the cluster [45].
Clustering techniques are divided into hierarchical and partitional aspects [43]. The hierarchical aspect usually focused on dividing the entire data set into clusters such as single linkage, complete linkage, average linkage, and average group linkage. Meanwhile, the partitional aspect does not have a hierarchical structure but involves each cluster having a central point (centroid) to minimize the distance (dissimilarity) of the entire data to the center of the respective cluster. Some examples of the partitional clustering techniques include K-Means, Fuzzy k-Means, and Mixture Modeling.
The Fuzzy k-Means method is a data grouping technique which involves determining the existence of each data in a cluster based on the degree of membership. Moreover, the Fuzzy k-means algorithm uses fuzzy models which allow all the data in a group to be formed with Boolean membership degrees between 0 and 1 [44]. The distance in this method can be calculated using Cosine Dissimilarity, Jaccard Dissimilarity, and Euclidean Distance. This present study used the Cosine Dissimilarity as indicated in Eq. (2). Cosine dissimilarity is a distance that characterizes fuzzy k-means and is based on the cosine of the angle between two observations. The wider the angle, the greater the cosine dissimilarity, which approaches 1, where 1 is a 90° angle which means that no variables are shared between observations.
$\operatorname{Distance}(p, q)=1-\cos (p, q)=$ $1-\frac{p q^{T}}{\lceil\lceil\lceil A\rceil\rceil\lceil[B\rceil\rceil\rceil}$ (2)
Spatial clustering analysis is often used in designing the composition and structure of cities [46], grouping flood areas [47], and determining land use zones [48]. It was, therefore, applied in this study because of the similarity in the adjacent objects [42].
3.1 Factors determining the characteristics and typologies of the region
The strategic area of the west-east corridor was developed based on the diversity of the region’s potentials [25, 29]. For example, the unique characteristics of West Sumatra [27] led the handlers to apply different strategies and policies in each region [22, 49]. Moreover, the diversity observed in the characteristics of the West-East Corridor is expected to be the prime mover for regional development and increased investment in this strategic economic area and West Sumatra in general.
The PCA analysis used 17 variables presented in Table 1 with a minimum factor filter of 70% as indicated in Figure 2 to determine the diversity of the characteristics and typologies of the study area. Moreover, the test conducted using eigenvalues was able to produce four factors as shown in Table 2. It is important to note that the eigenvalues show the reduction of all data matrices on each variable:
Table 2. Eigen value, variability, and cumulative values
|
|
F1 |
F2 |
F3 |
F4 |
|
Eigenvalue |
7.560 |
1.990 |
1.732 |
1.070 |
|
Variability (%) |
44.469 |
11.703 |
10.188 |
6.294 |
|
Cumulative % |
44.469 |
56.172 |
66.360 |
72.654 |
The diversity of the factors was described using the eigenvalues > 1. It was discovered that the eigenvalue of the first factor (F1), 7,560, was able to explain the diversity of data by 44,469%, the second factor (F2) with 1,990 was able to explain 11.703%, the third factor (F3) with 1,732 explained 10.188%, and the fourth factor (F4) with 1,070 only explained 6.294%. Moreover, the analysis of the main components reduced the 17 variables to 4 as indicated in the Scree plot graph presented in Figure 2. The reduction process led to the loss of information by 27.346% and this means a diversity of variation of 72.654% or >70% was produced by the main components [50]. This further shows that the minimization process of the principal component analysis method was able to maintain 72.654% of the variable attribute information for further analysis.
Figure 2. Scree plot uses a minimum filter factor of 70%
PCA analysis was also conducted using Bartlett's test and Kaiser-Meyer-Olkin values [51]. The aim of Bartlett's test was to determine the correlation between the variables, and the results obtained based on the following hypothesis are presented in Table 3.
H0: There is no significantly different correlation with 0 between variables
H1: At least one of the correlations between variables differs markedly by 0
The p-value result showed a value smaller than α = 0.05 and this means H0 was rejected while H1 was accepted.
Table 3. Bartlett's test
|
Component |
Value |
|
Chi-square (Observed Value) |
771.119 |
|
Chi-square (Critical value) |
164.216 |
|
DF |
136 |
|
p-value (Two-tailed) |
<0.0001 |
|
alpha |
0.050 |
The Kaiser-Meyer-Olkin value (KMO) was used to assess the overall adequacy of sampling and variables for each indicator using correlation values between the variables as indicated in Table 4. It is important to note that variables are usually scaled worthy of analysis when they have a KMO value ≥ 0.5 [51]. The average value recorded in this study was 0.839 and this indicates the variables can be analyzed.
Table 4. Kaiser-Meyer-Olkin test of each variable
|
Variable |
KMO |
|
Production of agricultural (ton) |
0.854 |
|
Fishery production (ton) |
0.512 |
|
Livestock and Poultry Population (head) |
0.589 |
|
Tourist sites (unit) |
0.692 |
|
Restaurants (unit) |
0.913 |
|
Hotels (unit) |
0.850 |
|
Inns/motels/guesthouses (unit) |
0.914 |
|
Hospitals (unit) |
0.933 |
|
Shops/traders (unit) |
0.840 |
|
Banks(unit) |
0.879 |
|
Cooperative (unit) |
0.842 |
|
Agricultural harvest area (ha) |
0.887 |
|
Tourist visit (person) |
0.873 |
|
Population density (people/ha) |
0.866 |
|
Clean water user households (KK) |
0.790 |
|
Paddy Field Area (ha) |
0.783 |
|
Forest area (ha) |
0.746 |
|
KMO |
0.839 |
The main components were grouped into four factors based on the weight of each variable as indicated in Table 5. The first factor (F1) consists of variables such as the numbers of restaurants, hotels, hostels/inns/guesthouses, hospitals, shops, banks, cooperatives, the population density, households using clean water, and the number of tourist visits. This F1 was grouped as trades and tourist services. The second factor (F2) includes the variables such as agricultural production, land harvest, rice field, and forest area, and was grouped as agriculture. The third factor (F3) consists of variables such as fishery, livestock, and poultry production, and was grouped as fisheries/livestock. Meanwhile, the fourth factor (F4) includes the number of tourist sites variable and was grouped as tourism.
Table 5. Eigenvalue score on each factor
|
Factors |
Variables |
Eigenvalue |
|
Factor 1 (Trade and Tourism Services) |
-Restaurants -Hotels -Inns/Motels/Guesthouses -Hospitals -Trades -Banks -Cooperatives -Tourist visits -Clean water user households |
7,560 |
|
Factor 2 (Agriculture) |
-Production of agricultural -Agricultural harvest area -Rice Field Area -Forest area |
1,990 |
|
Factor 3 (Fisheries- livestock) |
-Fishery production -Livestock and Poultry Population |
1,732 |
|
Factor 4 (Tourism) |
-Tourist sites |
1,070 |
The spatial pattern indicates the independence of each factor [50]. It was also discovered from the grouping that the main components of each location have a different coefficient indicated by the spatial pattern of each factor as presented in Figure 3.
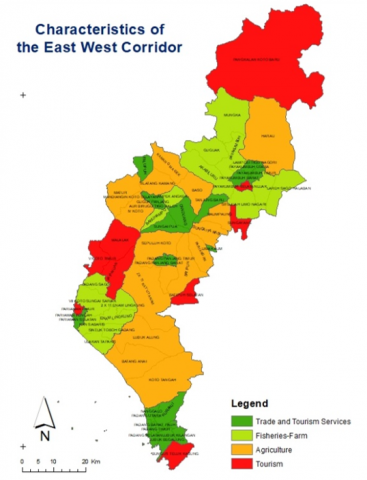
Figure 3. Characteristics of west-east corridor (PCA result)
The districts with trade and tourism services concentrated in the city area include Padang City, Pariaman, Padang Panjang, Bukittinggi, Payakumbuh, and Lima Kaum Sub-district of Limapuluh Kota Regency. Those with agriculture include Koto Tangah District, Batang Anai, Lubuk Alung, 2 x 11 Kayu Tanam, Sepuluh Koto, Batipuh, Pariangan Sungai Tarab, Salimpaung, IV Koto, Matur, Tilatang Kamang, Baso, Kamang Magek and Harau. Those related to livestock and fishery are Ulakan Tapakis District, Sintuak Toboh Gadang, Nan Sabaris, Enam Lingkung, 2 x 11 Six Lingkung, VII Koto Sungai Sariak, Padang Sago, Banuhampu, Ampek Angkek, Situjuah Limo Nagari, Aka-biluru, Payakumbuah, Luak, Lareh Sago Halaban, Guguak, and Mungka. Meanwhile, those observed to have tourism potential in the form of both natural and cultural tourist attraction sites include Bungus Teluk Kabung District, Pariaman Timur, Batipuh Selatan, Pattamuan, V Koto Timur, Malalak, Sungayang, South Payakumbuh, and Pangkalan Koto Baru.
3.2 Characteristics and typologies of the regions
The typologies were grouped through spatial clustering analysis using the results obtained from analyzing the main components. This spatial clustering method involves grouping objects into clusters based on their similarity [45]. For the purpose of this present study, the Fuzzy k-Mean (Fk-M) method which involves grouping data using the value of a certain degree of membership was applied [44].
The partition matrix in the form of n x m was also used where n is 65 which is the number of sub-districts and m is 4 which represents the main component of the PCA analysis. This means a 65×4 matrix was used with cosine dissimilarity which is the distance that characterizes the fuzzy k-means and is usually determined based on the cosine angle between the two observations. A wider angle usually has greater cosine dissimilarity approaching 1 which represents 90° and this signifies no variable is divided between the observations. It is important to note that the initial parameter values set in this study include 3 clusters which are considered the base for the hierarchy of the regions. Meanwhile, the maximum iteration was 100, the smallest expected error was 10-5, and the initial iteration was 1. The elements of the initial partition matrix U65×4 (initial partition) were determined using random numbers (μik, i=1, 2, ..., c; k=1, 2, ..., n).
Table 6 shows that the fuzzy grouping of k-means using 3 clusters and 9 iterations produced Wilks' Lamda value of 0.064. It is important to note that a smaller Wilk's Lamda value indicates a better cluster accuracy rate. Moreover, the grouping in each cluster based on the profile or mean plot presented in Figure 4 showed that the highest value of cluster 1 (red) was in F1, cluster 2 (blue) in F3, and cluster 3 (green) in F2.
Figure 5 shows the silhouette coefficient value. This silhouette coefficient is a method normally used to determine the quality and strength of clusters [52]. The value is between -1 to 1 and the closeness to 1 indicates better grouping of data in a cluster and vice versa. The values for the three established clusters in this present study were found to be close to 1 such that cluster 1 has 0.703, cluster 2 has 0.528, and cluster 3 has 0.435, thereby, leading to an average of 0.564. This means the data selected for the grouping were quite precise considering the fact that the average value is close to 1.
Figure 4. Profile or Mean Plot of each cluster, cluster 1 (red) has a maximum value at F1, cluster 2 (blue) has a maximum value at F3, and cluster 3 (green) has a maximum value at F2
Figure 5. Silhouette coefficient per cluster with cluster 1 having 0.703, cluster 2 has 0.528, cluster 3 has 0.435, and the average is 0.564
The typologies were set to three clusters of urban, desa-kota, and rural areas based on regional characterizer variables [53]. The variables in Factor 1 (F1) include the number of restaurants, hotels, motels/guesthouses, hospitals, banks, cooperatives, tourist visits, as well as population density, and household water users. This means (F1) is an urban characterizer and this led to the grouping of cluster 1 (red) in urban areas. Moreover, the variables in Factor 2 (F2) include agricultural produce, agricultural harvest area, rice field area, and forest area, and this means F2 is a village characterizer, thereby leading to the grouping of cluster 3 (green) in the rural area while cluster 2 (blue) which mixes feeds between urban and rural is grouped in the desa-kota area [54]. The silhouette coefficient value in Figure 5 showed that cluster 1 which was grouped into urban areas is the best followed by cluster 2 in desa-kota, and cluster 3 in rural areas.
Table 6. Summary of Fk-M
|
Number of clusters |
Iterations |
Criterion (log) |
Between-classes |
Within-class variance |
Wilks' Lambda test |
Mean width |
|
3 |
9 |
2.635 |
79.978 |
5.511 |
0.064 |
0.564 |
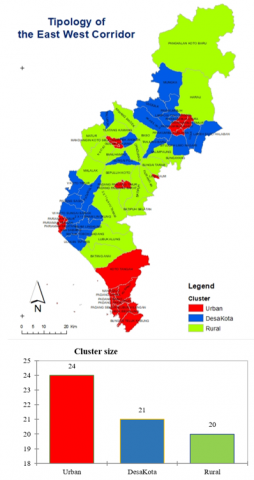
Figure 6. Typologies of west-east corridor (Fk-M analysis result)
Figure 6 shows the typological grouping of each cluster. It was discovered that cluster 1 typology which is an urban area consisting of 24 sub-districts is located in districts such as Padang City, Pariaman, Padang Panjang, Bukittinggi, and Payakumbuh with only one subdistrict in Tanah Datar Regency Lima Kaum District. Moreover, cluster 2 typology which is a desa-kota consisting of 21 sub-districts is generally located in the regency area while cluster 3 typology which is in rural areas has 20 sub-districts and is also generally located in the regency area.
The characteristics of each region were determined using PCA analysis in Figure 3 while the typologies were obtained from the Fk-M analysis as indicated in Figure 6. They were both further analyzed using overlay analysis methods to show the diversity in each region of the West-East Corridor.
The overlay analysis produced ten characteristics and typologies as indicated in Figure 7. It was discovered that trades and tourism services cluster 1 (urban) consists of 20 districts, cluster 2 (desa-kota) consists of 3 districts, and cluster 3 (rural) consists of 1 district. Moreover, agriculture cluster 1 (urban) consists of 1 district, and cluster 3 (rural) consists of 14 districts while fisheries/livestock cluster 2 (desa-kota) consists of 16 districts and cluster 3 (rural) consists of 1 district. The findings further showed that tourisms cluster 1 (urban) consists of 3 districts, cluster 2 (desa-kota) consists of 2 districts, and cluster 3 (rural) consists of 4 districts. The characteristics and typologies pattern showed that they are both spread evenly throughout the west-east corridor.
Figure 7. Overlay analysis between characteristic (PCA result) and typology (Fk-M analysis result) each region
The terms used for strategic areas differ with countries as previously stated [14] such as industrial free zone, economic zone, special economic zone, specific economic zone [16], airport economic zone [8], potential border zone [9], river economic zone [10, 11, 12], special zone [13], special border economic zone [17], and heritage corridor [18]. It is also important to reiterate that the differences in the development potentials of each region lead to the need to implement specific strategies for the development process.
The West-East Corridor is one of the strategic areas in West Sumatra. It consists of 9 regencies/cities and 65 sub-districts with different characteristics [49, 27]. The diversity of characteristics of the west-east corridor distinguishes the region from other areas in West Sumatra [22]. It was discovered that the characteristics and typologies of the corridor include trade zone and tourism services cluster 1 (urban), cluster 2 (desa-kota), and cluster 3 (rural) as well as agricultural zone cluster 1 (urban) and cluster 3 (rural). Moreover, it also has fisheries/livestock zone cluster 2 (desa-kota), cluster 3 (rural), and cluster 1 (urban) as well as tourist zone cluster 2 (desa-kota) and cluster 3 (rural). The problems associated with each of them vary and this leads to the differences in the strategies and policies to be applied in each region.
This means the development strategy to be implemented in a region needs to be in line with the characteristics of the region. For example, the special economic zone in India is characterized as an industrial area [19] and the regional development strategy in the zone was focused on infrastructure to support industrial development, netting private involvement in investment activities, technological development, and tax reduction. The potential border zone in Thailand is designated an industrial and trade zone [9], and the strategy for regional development was focused on promotion and investment policies, open economic activities in border areas, integration programs between centers and regions, the conduct of mutually inclusive growth, and development of economic cooperation between countries.
The strategic economic area in West-East Corridor is one of the regions expected to become a prime mover of the West Sumatra economy. The realization of this objective requires tailoring policies and strategies [55, 56] in line with the characteristics and typologies of each sub-district in the corridor. Therefore, the grouping conducted in this study is designed to assist local governments in making policies [57] to realize sustainable development [58] in the West-East Corridor and also makes it easier for investors [59] to make an informed investment decision.
This research becomes the basis for local governments to make policies and strategies to increase investment and develop the East-West Corridor. The policies and strategies implemented are adjusted to the characteristics and typology of each region. This study has limitations; the author does not consider some observed variables.
[1] Saragih, J.R. (2015). Agricultural-Based Local Economic Planning and Development, Theory and Application. Yogyakarta: Pustaka Pelajar.
[2] Bozhko, L. (2018). Development scenarios for the interregional economic interaction in the context of economy clustering in the Republic of Kazakhstan. Energy Procedia, 147: 397-401. https://doi.org/10.1016/j.egypro.2018.07.109
[3] Sosnovskikh, S. (2017). Industrial clusters in Russia: The development of special economic zones and industrial parks. Russian Journal of Economics, 3(2): 174-199. https://doi.org/10.1016/j.ruje.2017.06.004
[4] Ministry of National Development Planning/, National Development Planning Agency, Kementerian PPN/Bappenas. (2016). A critical study on the determination of strategic areas in the RPJMN and RTRWN. Buku, p. 52. https://www.bappenas.go.id/files/kajian-trp/Kajian_Telaah_Kritis_Penetapan_Kawasan_Strategis_dalam_RPJMN_dan_RTRWN.pdf.
[5] Komarovskiy, V., Bondaruk, V. (2013). The role of the concept of “Growth Poles” for regional development. Journal of Public Administration, Finance and Law, 4(2013): 31-42.
[6] Glinskiy, V., Serga, L., Zaykov, K. (2017). Identification method of the Russian Federation Arctic Zone regions statistical aggregate as the object of strategy development and a source of sustainable growth. Procedia Manufacturing, 8: 308-314. https://doi.org/10.1016/j.promfg.2017.02.039
[7] Krishnasamy, K., Shepherd, C.R., Or, O.C. (2018). Observations of illegal wildlife trade in Boten, a Chinese border town within a Specific Economic Zone in northern Lao PDR. Global Ecology and Conservation, 14: e00390. https://doi.org/10.1016/j.gecco.2018.e00390
[8] Li, Y.J., Zhang, Z.Y. (2013). Technical methods of comprehensive transportation plans in the airport economic zone-taking Xiaogan airport economic zone as a case. Procedia-Social and Behavioral Sciences, 96: 182-187. https://doi.org/10.1016/j.sbspro.2013.08.024
[9] Uttama, N.P. (2014). Investment promotion policy in potential border zone. Procedia Econ Finance, 14: 615-623. https://doi.org/10.1016/s2212-5671(14)00750-3
[10] Jiang, Y.H., Lin, L.J., Ni, H.Y., et al. (2018). An overview of the resources and environment conditions and major geological problems in the Yangtze River economic zone, China. China Geology, 1(3): 435-449. https://doi.org/10.31035/cg2018040
[11] Guo, Y., Fu, B., Xu, P., Wang, Y., Liu, X. (2021). Mapping regional differences in payment for ecosystem service policies to inform integrated management: Case study of the Yangtze River Economic Belt. Journal of Environmental Management, 278: 111396. https://doi.org/10.1016/j.jenvman.2020.111396
[12] Chen, Y. (2020). Financialising urban redevelopment: Transforming Shanghai’s waterfront. Land Use Policy, 112: 105126. https://doi.org/10.1016/j.landusepol.2020.105126
[13] Mohamed, A., Worku, H. (2019). Quantification of the land use/land cover dynamics and the degree of urban growth goodness for sustainable urban land use planning in Addis Ababa and the surrounding Oromia special zone. Journal of Urban Management, 8(1): 145-158. https://doi.org/10.1016/j.jum.2018.11.002
[14] Ezmale, S., Rimsane, I. (2014). Promoting the plurilingual awareness in business environment: Case of Rezekne Special Economic Zone. Procedia-Social and Behavioral Sciences, 110: 231-240. https://doi.org/10.1016/j.sbspro.2013.12.866
[15] Beliakov, S., Kapustkina, A. (2016). Analysis of performance indicators of functioning of territories with special economic status in the Russian Federation. Procedia Engineering, 165: 1424-1429. https://doi.org/10.1016/j.proeng.2016.11.874
[16] Noori, S., Korevaar, G., Ramirez, A.R. (2021). Assessing industrial symbiosis potential in Emerging Industrial Clusters: The case of Persian Gulf Mining and metal industries special economic zone. Journal of Cleaner Production, 280: 124765. https://doi.org/10.1016/j.jclepro.2020.124765
[17] Teangsompong, T., Sirisunhirun, S. (2018). Multi-level structural equation modeling for city development based on the expectations of the local population in a special border economic zone in Western Thailand. Kasetsart Journal of Social Sciences, 39(3): 534-541. https://doi.org/10.1016/j.kjss.2017.08.002
[18] Ji, X., Shao, L. (2017). The application of landscape infrastructure approaches in the planning of heritage corridor supporting system. Procedia Engineering, 198: 1123-1127. https://doi.org/10.1016/j.proeng.2017.07.154
[19] Anwar, M.A. (2014). New modes of industrial manufacturing: India’s experience with special economic zones. Bull Geogr, 24(24): 7-25. https://doi.org/10.2478/bog-2014-0011
[20] Nurzaman, S.S. (2012). Regional Planning in the INDONESIAN CONTExt. 1st ed. Bandung: Penerbit ITB, pp. 1-464.
[21] Babkin, A., Vertakova, Y., Plotnikov, V. (2017). Study and assessment of clusters activity effect on regional economy. In SHS Web of Conferences, 35: 01063. https://doi.org/10.1051/shsconf/20173501063
[22] Rustiadi, E., Saefulhakim, S., Panuju, D.R. (2018). Regional Planning and Development. 4th ed. Jakarta: Yayasan Pustaka Obor.
[23] Lipták, F., Klasová, S., Kováč, V. (2015). Special economic zone constitution according to cluster analysis. Procedia Economics and Finance, 27: 186-193. https://doi.org/10.1016/s2212-5671(15)00988-0
[24] Lee, G.G., Kim, M.S., Lee, J.H., Kim, J.J. (2014). Zoning management by quantitative landscape assessment for forest pathway–the case of forest paths of the Mt. Jiri national park, South Korea. Forest Science and Technology, 10(4): 179-189. https://doi.org/10.1080/21580103.2014.891538
[25] Chulaphan, W., Barahona, J.F. (2018). Contribution of disaggregated tourism on Thailand's economic growth. Kasetsart Journal of Social Sciences, 39(3): 401-406. https://doi.org/10.1016/j.kjss.2017.07.012
[26] Regional Development Planning Agency of West Sumatra Province. (2009). Rencana Tata Ruang Wilayah (RTRW) Provinsi Suatera Barat 2012-2032. Padang: Regional Secretary of West Sumatra Province, pp. 1-217.
[27] Asrina, M., Gunawan, A., Aris, M. (2017). Identification of Minangkabau landscape characters. In IOP Conference Series: Earth and Environmental Science, 91(1): 012018. https://doi.org/10.1088/1755-1315/91/1/012018
[28] Sawicki, David, S. (1988). Policy Analysis. In: Urban Planning. 2nd ed. Jakarta: Penerbit Erlangga, pp. 63-90.
[29] Zasada, I., Weltin, M., Reutter, M., Verburg, P.H., Piorr, A. (2018). EU’s rural development policy at the regional level—Are expenditures for natural capital linked with territorial needs? Land Use Policy, 77(3): 344-353. https://doi.org/10.1016/j.landusepol.2018.05.053
[30] West Sumatra Statistical Agency. (2020). Kecamatan Dalam Angka 2020. Padang: West Sumatra Statistical Agency Press.
[31] Hu, Z., Wang, Y., Liu, Y., Long, H., Peng, J. (2016). Spatio-temporal patterns of urban-rural development and transformation in east of the “Hu Huanyong Line”, China. ISPRS International Journal of Geo-Information, 5(3): 24. https://doi.org/10.3390/ijgi5030024
[32] Ohana-Levi, N., Bahat, I., Peeters, A., Shtein, A., Netzer, Y., Cohen, Y., Ben-Gal, A. (2019). A weighted multivariate spatial clustering model to determine irrigation management zones. Computers and Electronics in Agriculture, 162: 719-731. https://doi.org/10.1016/j.compag.2019.05.012
[33] Wang, D., Zhou, Q.B., Yang, P., Chen, Z.X. (2018). Design of a spatial sampling scheme considering the spatial autocorrelation of crop acreage included in the sampling units. Journal of Integrative Agriculture, 17(9): 2096-2106. https://doi.org/10.1016/S2095-3119(17)61882-3
[34] Duarte, J., Vieira, L.W., Marques, A.D., Schneider, P.S., Pumi, G., Prass, T.S. (2021). Increasing power plant efficiency with clustering methods and Variable Importance Index assessment. Energy AI, 5: 100084. https://doi.org/10.1016/j.egyai.2021.100084
[35] Kjærulff, T.M., Ersbøll, A.K., Gislason, G., Schipperijn, J. (2016). Geographical clustering of incident acute myocardial infarction in Denmark: A spatial analysis approach. Spat Spatio-Temporal Epidemiol, 19: 46-59. https://doi.org/10.1016/j.sste.2016.05.001
[36] Syms, C. (2019). Principal components analysis. Encyclopedia of Ecology (Second Edition), 3: 566-573. https://doi.org/10.1016/B978-0-12-409548-9.11152-2
[37] Juaeni, I. (2014). Dampak penerapan principal component analysis (PCA) Dalam clustering Curah Hujan di Pulau Jawa, Bali, Dan Lombok. J Sains Dirgant, 11: 97-108.
[38] Yang, W., Zhao, Y., Wang, D., Wu, H., Lin, A., He, L. (2020). Using principal components analysis and idw interpolation to determine spatial and temporal changes of Surfacewater quality of Xin’anjiang river in Huangshan, China. International journal of environmental research and public health, 17(8): 2942. https://doi.org/10.3390/ijerph17082942
[39] Vyas, S., Kumaranayake, L. (2006). Constructing socio-economic status indices: How to use principal components analysis. Health Policy and Planning, 21(6): 459-468. https://doi.org/10.1093/heapol/czl029
[40] Soedibjo, B.S. (2008). Analisis Komponen Utama Dalam Kajian Ekologi. Oseana, 33(2): 45-53.
[41] Kellow, J.T. (2006). Using principal components analysis in program evaluation: Some practical considerations. Journal of MultiDisciplinary Evaluation, 3(5): 89-107.
[42] Han, J., Pei, J., Kamber, M. (2012). Data Mininng Concept and Techniques. Third. New York: Morgan Kaufmann Publishers-Elsevier, pp. 1-740.
[43] Tan, P.N., Steinbach, M., Kumar, V. (2006). Introduction to Data Mining. Inggris: Pearson Addison-Wesley, pp. 1-169.
[44] Gorsevski, P.V., Gessler, P.E., Jankowski, P. (2003). Integrating a fuzzy k-means classification and a Bayesian approach for spatial prediction of landslide hazard. Journal of Geographical Systems, 5(3): 223-251. https://doi.org/10.1007/978-3-642-03647-7
[45] Aldstadt, J. (2010). Spatial Clustering. In: Fisher MM, Getis A, editors. Handbook of Applied Spatial Analisis Software Tools, Methods and Applications. New York: Springer, pp. 279-300.
[46] Ducret, R., Lemarié, B., Roset, A. (2016). Cluster analysis and spatial modeling for urban freight. Identifying homogeneous urban zones based on urban form and logistics characteristics. Transportation Research Procedia, 12: 301-313. https://doi.org/10.1016/j.trpro.2016.02.067
[47] Wang, Z., Cui, T., Wang, Y., Yu, Z. (2012). Flood season division with an improved fuzzy C-mean clustering method in the Taihu lake basin in China. Procedia Engineering, 28: 66-74. https://doi.org/10.1016/j.proeng.2012.01.684
[48] Zhu, J., Sun, Y. (2017). Building an urban spatial structure from urban land use data: An example using automated recognition of the city centre. ISPRS International Journal of Geo-Information, 6(4): 122. https://doi.org/10.3390/ijgi6040122
[49] Murao, S. (2013). A cultural anthropological study of body techniques for protection: The case study of Indonesian Minangkabau. Ars Vivendi Journal, 3: 51-68.
[50] Pribadi, D.O., Rustiadi, E., Panuju, D.R., Pravitasari, A.E. (2018). Regional Development Planning Modeling. Bogor: Crestpent Press. http://repository.unib.ac.id/id/eprint/1234.
[51] Hair, J.F., Black, W.C., Babin, B.J., Anderson, R.E. (2014). Multivariate Data Analysi. Seventh. England: Pearson Education Limited, pp. 1-739. www.pearsoned.co.uk.
[52] Anitha, P., Patil, M.M. (2019). RFM model for customer purchase behavior using K-means algorithm. Journal of King Saud University-Computer and Information Sciences. https://doi.org/10.1016/j.jksuci.2019.12.011
[53] Jamaludin, A.N. (2015). Urban Sociology Understanding Urban Society and Its Problems. Vol. 2. Bandung: CV. Pustaka Setia, pp. 1-454.
[54] Rustiadi, E., Panuju, D.R. (2002). Spatial pattern of suburbanization and land-use change process: Case study of Jakarta Suburb. Land-use changes in comparative perspective, 33-52.
[55] Fang, C., Luo, K., Kong, Y., Lin, H., Ren, Y. (2018). Evaluating performance and elucidating the mechanisms of collaborative development within the Beijing–Tianjin–Hebei region, China. Sustainability, 10(2): 471. https://doi.org/10.3390/su10020471
[56] Park, S.H. (2016). A strategic approach to policy tasks for the development of Korea’s island areas. Journal of Marine and Island Cultures, 5(1): 14-21. https://doi.org/10.1016/j.imic.2016.04.003
[57] Yamane, T., Kaneko, S. (2022). The Sustainable Development Goals as new business norms: A survey experiment on stakeholder preferences. Ecological Economics, 191: 107236. https://doi.org/10.1016/j.ecolecon.2021.107236
[58] Benites, A.J., Simoes, A.F. (2021). Assessing the urban sustainable development strategy: An application of a smart city services sustainability taxonomy. Ecological Indicators, 127: 107734. https://doi.org/10.1016/j.ecolind.2021.107734
[59] Adair, A., Berry, J., McGreal, S., Deddis, B., Hirst, S. (2000). The financing of urban regeneration. Land Use Policy, 17(2): 147-156. https://doi.org/10.1016/S0264-8377(00)00004-1