Mohamed Jed | Nabila Ihaddadene | Mohamed El Hacen Jed* | Razika Ihaddadene | Menny El Bah
© 2022 IIETA. This article is published by IIETA and is licensed under the CC BY 4.0 license (http://creativecommons.org/licenses/by/4.0/).
OPEN ACCESS
Unfortunately, most developing countries lack meteorological data from weather stations due to a lack of measurement instruments or the absence of these stations. Currently, a variety of spatial databases, such as NASA/Power, Meteonorm, Solargis, and others, provide solar irradiation data for various places and time intervals. The goal of this study is to verify the accuracy of solar irradiation data from the National Aeronautics and Space Administration (NASA) database (free estimated data) by comparing them with ground-based measurements taken at four distinct locations in Algeria and Mauritania. Using six statistical parameters, data downloaded from the NASA site for 34 years, from 1984 to 2017, were averaged and compared to ground-based data recorded at M'Sila, Saida, Tamanrasset, and Nouakchott for one year (365 days) on daily (n = 365), monthly (n = 30 or 31), and annual (n = 12) time scales. It has been found that in the absence of daily measured global horizontal irradiation data for one year, the estimated multi-year average NASA data can be used instead. The use of estimated data over a long period is recommended. In the absence of actual solar irradiation data, solar energy projects in Algeria and Mauritania can rely on NASA's estimates.
accuracy validation, global horizontal irradiation, measured solar irradiation data, NASA data, statistical analysis
Solar energy emitted by the sun is one of the most important renewable energy sources as long as the sun shines. Wind, tidal, and fossil energies all come from it [1]. Moreover, solar energy has the characteristic of being free, abundant, clean, and inexhaustible. Indeed, the amount of solar energy reaching the earth in the form of light and heat is estimated to be 1.5×10¹⁸ kWh per year [2]. This latter is sufficient to meet and exceed the needs of the world's population [3]. Solar energy also reduces greenhouse gas emissions, preventing pollution and global warming [4, 5]. Solar energy is not limited to a single country; it is available to all countries on the planet. However, the amount of solar energy reaching these countries depends on their geographic location. As a result of the above, all countries throughout the world are looking for this sort of energy because it ensures sustainable development for future generations.
Man has been able to harness energy from the sun to support his needs by converting it into heat [6, 7] or electricity [8, 9] using devices he invented, such as solar water heaters [2], solar distillers [10], solar dryers for agricultural and animal products [11], solar furnaces [12], solar cookers [12], PV panels [13], solar concentrators [14], solar greenhouses [15], etc.
Solar irradiation data gives information about the amount of solar energy that falls on the surface at a specified location on Earth over a period of time. The Global Horizontal Irradiance (GHI), Direct Normal Irradiance (DNI), and Diffuse Horizontal Irradiance (DHI), which are measurable quantities, are useful solar irradiation data. These latter are of great importance when designing, sizing, and evaluating the performance of solar energy systems. To give an idea, a threshold value of direct normal irradiance (DNI) > 1800 kWh/m2/year should be satisfied before launching any projects using solar concentrators [16]. Solar irradiation has a significant impact on the performance of solar PV modules (conversion process) [17]. When it comes to designing energy-efficient buildings, solar irradiation data is also crucial.
In most developing countries, meteorological data, especially solar irradiation, is lacking, making it difficult to establish a solar energy research program. This situation is due to a deficiency of measuring instruments, the absence of meteorological stations and data for long time intervals, etc. Let us cite the example of M'Sila, a province of Algeria where only solar irradiance data incident on a horizontal surface, dating back to October 2015, is available at the M'Sila weather station [18]. Another problem that may occur in the presence of weather stations with measuring instruments is the accuracy of the measured values that fall outside of the awaited range owing to equipment failures or others [19]. For solar irradiation measurement, the use of electronic devices such as pyranometers and pyrheliometers (radiometers) that are sensitive to ambient temperature is needed. Both necessitate costly calibration and maintenance [20, 21].
Due to the absence of measured solar irradiation data, several empirical models have been developed to estimate solar irradiation using meteorological and geographical parameters [22]. The most popular meteorological models are based on sunshine duration, temperature, and cloud cover. In other words, it is found that global solar horizontal irradiation is related to sunshine hours [23], air temperature [24], cloud cover [25], relative humidity, and water vapor pressure [22].
Since they have the spatial, temporal, and spectral resolution needed for accurate and continuous coverage of the Earth, satellite images are a possible and effective solution to the problem of solar irradiation data continuity [26, 27]. Currently, there are a number of free or paid satellite information-based spatial databases that provide solar irradiation data for different locations and time intervals, such as NASA-POWER [28], Meteonorm [29], Solargis [30], etc.
The POWER (Prediction of Worldwide Energy Resources) Project [28], initiated in 2003, offers free solar and meteorological data sets from NASA research to promote agricultural needs, renewable energy, and building energy efficiency. It arose from the SSE project (Surface meteorology and Solar Energy). The prediction of worldwide energy resources is based upon satellite observations from which surface insolation values are inferred by NASA’s Global Energy and Water Exchange Project (GEWEX)/Surface Radiation Budget (SRB) Release 3 and NASA’s Clouds and Earth Radiant Energy System (CERES) Fast Longwave and Shortwave Radiative Project (FLASH Flux). The POWER solar data is given on a 1° x 1° latitude and longitude grid. The weighted sum of clear and cloudy fluxes constitutes the total solar irradiance. If it is integrated over the day, it gives the average daily flux [21]. It's worth noting that numerous models for estimating daily solar irradiation from satellite images have been developed [31-34].
Several investigations aimed at establishing the accuracy of NASA data have been published in the literature. Indeed, Masuda [35] found a similar agreement between monthly mean surface solar radiation from the Global Energy and Water Cycle Experiment Surface Radiation Budget (GEWEX-SRB) and in situ measurements for Asia and Oceania. The Tibetan Plateau is the only exception. When compared to measured solar irradiation data, the estimates obtained from the NASA-POWER project have proven to be reliable, as is the case of the United States [21] and Spain [20, 36].
In this context, the objective of this research is to compare the free data relative to global horizontal irradiation given by the NASA-Power project with that measured on the ground in two different African countries, namely Algeria and Mauritania, in order to verify NASA’s estimated accuracy. It's worth noting that data collected on the ground is provided by a meteorological station in M'Sila (Algeria) and three photovoltaic power plants in Saida, Tamanrasset (Algeria), and Nouakchott (Mauritania). Once verified, this data can be used in the absence of measured data in programs aimed at harnessing solar energy for the sustainable development of these regions.
This article is divided into three sections. The following section will present the materials and methods used to achieve the study's objectives, followed by the results and their discussion, and finally, a conclusion that summarizes the most important findings and describes the limitations of the present work.
2.1 Sites and data
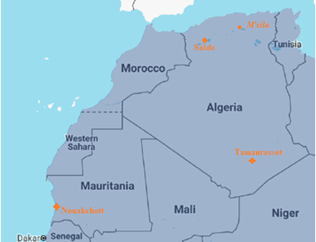
For four separate sites in two African countries, Algeria and Mauritania, the quality of free solar irradiation data available online from the NASA site [28] is to be validated. For Algeria, M'Sila, Saida, and Tamanrasset were the three sites chosen, while Nouakchott was the site selected for Mauritania. Figure 1 shows the emplacement of the sites selected for this study in Algeria and Mauritania.
Figure 1. Sites studied in Africa
M'Sila is located in northern Algeria (central highlands region) at a latitude of 35°42'07"N, a longitude of 4°32'43"E, and an altitude of 471 m above sea level. It covers an area of 233.2 km2. M’Sila was a semi-arid region, and recently, due to global warming, it is classified as an arid region [37].
Saida is located in north-western Algeria (northern fringe of the High Plateaus) at 34°49'49"N, 0°09'06"E, and has a mean altitude of 980 m above sea level. It covers an area of 75.62 km2. According to the Köppen-Geiger classification [38], Saida has a hot Mediterranean climate with dry summers.
Tamanrasset is located in the south of the Algerian Sahara, in the Hoggar mountain range, at a latitude of 22°47'06"N, a longitude of 5°31'22"E, and an altitude of 1400 m above sea level. It covers an area of 37,713 km2. Tamanrasset has a hot desert climate.
Nouakchott is located in western Mauritania (on the Atlantic coast of the Sahara Desert) at 18°4'N, 15°57'W, and 7 m above sea level (a few meters above sea level). It has a 1,000 km2 surface area. The climate in Nouakchott is hot and dry (a hot desert climate).
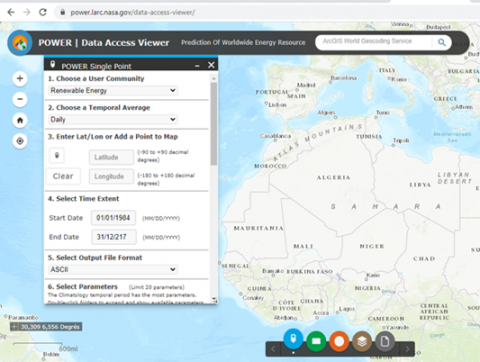
This study's data pertains to the daily Global Horizontal Irradiation received on a horizontal surface. As mentioned previously, the current investigation compares data downloaded from the archives of the National Aeronautics and Space Administration (NASA) for 34 years, i.e., from 1984 to 2017, and the data recorded on the ground at the four different sites cited above for one year (365 days). Moreover, NASA/POWER data is downloaded in ASCII format via the POWER Single Point Data Access widget (Figure 2), which allows access to near real-time 1/2 x 1/2-degree datasets by a single point (latitude/longitude). NASA/Power data covers the two countries on a 1°×1° latitude and longitude grid. The weather station in M'Sila, as well as three photovoltaic power stations in Saida, Tamanrasset, and Nouakchott, provided measured data for just one year.
Figure 2. Power data access viewer
2.2 Statistical performance evaluation approaches
There are many statistical indicators dealing with the comparison of data series. In the current paper, six different and widely used indicators in the literature were considered, namely, the determination coefficient (R²), root mean square error (RMSE), mean absolute bias error (MABE), relative root mean square error (RRMSE), relative percentage error (RPE), and mean absolute percentage error (MAPE). The following step defines each of the indicators used.
2.2.1 Determination coefficient (R²)
The coefficient of determination (R²) makes it possible to understand the strength of the link between two variables. It specifies the linear relationship between estimated and measured data. This positive statistical indicator is more representative when it is closer to 1 (the upper limit). The coefficient of determination is expressed by the following equation:
$R{}^\text{2}=1-\frac{\sum\limits_{i=1}^{n}{{{({{G}_{i,m}}-{{G}_{i,c}})}^{2}}}}{\sum\limits_{i=1}^{n}{{{({{G}_{i,m}}-\overline{{{G}_{i,m}}})}^{2}}}}$ (1)
where, Gi,m and Gi,c are the measured (real) and calculated (or estimated) values, respectively. ${{\overline{G}}_{i,m}}$ is the mean measured data, and n is the total number of observations.
2.2.2 Root mean square error (RMSE)
The root mean square error (RMSE) compares term-by-term the deviation between the estimated and measured values. It takes positive values, except in the ideal case, where its value is zero. RMSE is calculated as follows:
$RMSE={{\left[ \frac{1}{n}\sum\limits_{i=1}^{n}{{{({{G}_{i,c}}-{{G}_{i,m}})}^{2}}} \right]}^{1/2}}$ (2)
2.2.3 Mean absolute bias error (MABE)
The mean absolute bias error (MABE) is an indicator of the average absolute deviation between the estimated and measured values. In other words, it is an arithmetic average of absolute errors. This positive statistical parameter is more representative when it is low. The mean absolute bias error is expressed by the following equation:
$MABE=\frac{1}{n}\sum\limits_{i=1}^{n}{(\left| {{G}_{i,c}}-{{G}_{i,m}} \right|)}$ (3)
2.2.4 Relative root mean square error (RRMSE)
The relative root mean square error (RRMSE) is calculated by dividing the root mean square error by the mean observed (measured) values. It is given as follows:
$RRMSE=100\times {{\left[ \frac{1}{n}\sum\limits_{i=1}^{n}{{{({{G}_{i,c}}-{{G}_{i,m}})}^{2}}} \right]}^{1/2}}/\frac{1}{n}\times \sum\limits_{i=1}^{n}{{{G}_{i,m}}}$ (4)
The RRMSE values determine how estimated values describe measured ones. Indeed, Li et al. [39] reported that when:
• RRMSE<10%, the estimated values describe the measured ones in an excellent manner,
• 10% <RRMSE<20%, the estimated values describe the measured ones in an acceptable manner (good estimate),
• 20% <RRMSE<30%, the estimated values moderately describe the measured ones,
• RRMSE>30%, the estimated values weakly describe the measured ones.
2.2.5 Relative percentage error (RPE)
The relative percentage error (RPE) compares term-by-term the percentage deviation between the estimated and measured values. The value of RPE, ranging between -10% and 10%, is usually considered acceptable. The expression of the relative percentage error is given by the following equation:
$R P E(\%)=\left(\frac{G_{i, c}-G_{i, m}}{G_{i, m}}\right) \times 100$ (5)
2.2.6 Mean absolute percentage error (MAPE)
The mean absolute percentage error (MAPE) shows a measure of estimation accuracy reported as a percentage. It indicates the mean absolute percentage deviation between the estimated and measured values. The expression of this statistical indicator is given as follows:
$\operatorname{MAPE}(\%)=\frac{1}{n} \sum_{i=1}^{n}\left(\left|\frac{G_{i, c}-G_{i, m}}{G_{i, m}}\right|\right) \times 100$ (6)
2.3 Study parameters and procedure
Solar irradiation that strikes the earth's surface can be represented in different ways. In this study, we focus on global horizontal irradiation, which is defined as the total solar radiation falling on a surface horizontal to the earth's surface. This important parameter, especially for solar energy systems, is expressed in kWh/m2/duration.
Using the statistical parameters given above, daily (n = 365), monthly (n = 30 or 31), and annual (n = 12) comparisons between measured data (on the ground) and NASA/POWER's estimated data were made. Effectively, the data estimated for 5, 10, 15, 20, 25, 30, and 34 years was first averaged on the daily scale to get one year of average daily values matching the above-mentioned durations. For the daily comparison, the average daily values thus obtained were compared to those measured during one year on the ground for the four sites. For the monthly comparison, the average daily values obtained for a month during the cited periods were compared to those measured on the ground for the same month. This comparison was performed for each month of the year. For the annual comparison, the monthly average daily values during the cited periods were compared to those measured during one year on the ground. We also compared the measured values to those estimated for the same year at each of the four locations. These comparisons were made using Excel Microsoft 2016.
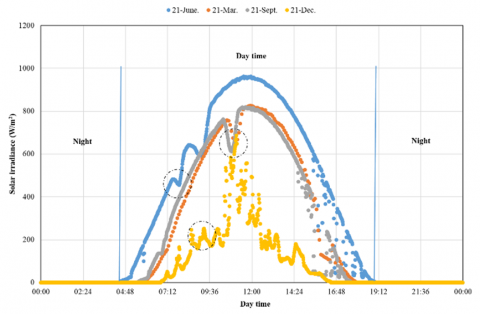
Figure 3 depicts the daily evolution of solar irradiance in the M'Sila region during the spring and autumn equinoxes, as well as the winter and summer solstices. It should be noted that solar irradiation expressed in Wh/m2 (or in kWh/m2) is only the integration of solar irradiance (W/m2 or kW/m2) over a time period (sunshine duration). Thus, the shape of the curve depicting the evolution of solar irradiation over a day, month, or year is identical to that showing the evolution of irradiance over the same periods.
As can be seen, the evolution of solar irradiance during the day has the shape of a bell. It admits two minimums recorded at sunrise and sunset (0 W/m2, corresponding to the night), as well as a maximum at solar noon (day time). This pace (night and day), due to the earth's revolution around its axis, remains unchanging for all regions on the planet. It is recorded every day with different solar irradiation intensities and different times of sunrise, sunset, and solar noon. The fluctuations in solar irradiance recorded are due to the passage of clouds, which abruptly reduce the incident solar irradiation (black dashed circles in Figure 3).
Figure 3. Solar irradiance evolution in M’Sila during spring and autumn equinoxes as well as winter and summer solstices
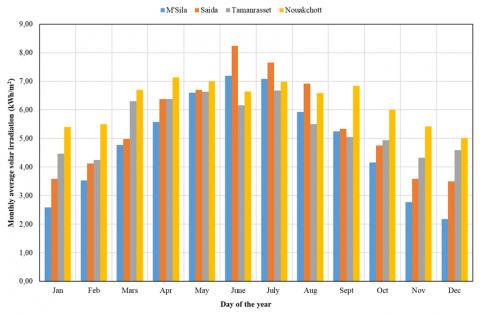
Figure 4. Evolution of the measured solar irradiation in M’Sila, Saida, Tamanrasset, and Nouakchott, over the year
Moreover, solar irradiance varies, during the day, and the month of the year (Figure 3). From September to March, the planet's northern hemisphere is tilted away from the sun. As a result, it receives less light and heat; this is in autumn and winter. When this part of the Earth is inclined toward the sun, it enjoys spring and summer (receives more light and heat). This occurs from March through September. The opposite happens in the southern hemisphere.
Figure 4 shows the evolution of monthly average daily solar irradiation in the four-examined zones, namely, M’Sila, Saida, Tamanrasset, and Nouakchott, over the year according to measured data. Again, the incident solar irradiation varies from month to month. As seen, the incident solar irradiation depends on the site's position on the earth. In our case study, Nouakchott is the sunniest region, while M’Sila is the least sunny zone. Indeed, Nouakchott receives solar energy estimated at 2,277.58 kWh/m2/year, compared to 1,754.56 kWh/m2/year for M’Sila.
Furthermore, due to global climate change, the solar energy received in M'Sila in recent years is significantly higher than that received in the 1960s [37]. Thus, solar irradiation reaching the earth’s surface is subject to annual variations (evolution of solar irradiation over the years).
3.1 Daily comparison
As previously stated, the average daily Global Horizontal Irradiation estimated for 5, 10, 15, 20, 25, 30, and 34 years were compared with those measured during one year on the ground in M’Sila, Saida, Tamanrasset, and Nouakchott using six statistical parameters as a judgment criterion. The results are presented in Table 1. As shown, the values of the statistical parameters used vary by region and are dependent on the estimated duration. These statistical indicators, in general, take their best values for the longest estimated period (i.e., 34 years). For example, in the case of M'Sila, R2, RMSE, MABE, RRMSE, and MAPE take their best values (the highest one for R2 and the lowest ones for the remaining parameters) for 34 years of estimated values.
3.1.1 Daily comparison for M’Sila region
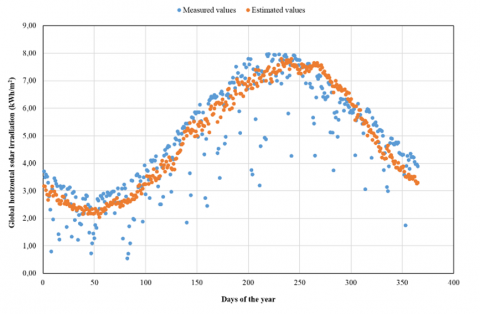
For the M'Sila region, the determination coefficient (R2) is more than 0.74 for all the periods studied of the estimated values (Table 1). Hence, there is a strong link between estimated and measured data. In other words, the estimated values given by NASA/POWER are in favorable agreement with those measured on the ground for all the periods studied, namely, 5, 10, 15, 20, 25, 30, and 34 years. Figure 5 depicts a graph comparing the estimated data over 34 years and the measured one in M’Sila, which graphically validates the finding stated above.
The root mean square error (RMSE) that measures the dispersion of the measured points around the estimated ones does not surpass 1 kWh/m2 for all the studied durations (Table 1). Indeed, it takes the highest value of 1 kWh/m2 for an estimated period of 5 years and the lowest one of 0.9 for 34 years of estimating. According to Figure 5, the low RMSE found for 34 years of estimated values confirms that the estimated values given by NASA are close to the ground measured ones. This outcome is also right for the lower duration of 5 years.
Figure 5. Comparison between measured and estimated solar irradiation in M’Sila (34 years of estimates)
The mean absolute bias error (MABE) is a measure of the average magnitude between estimated and measured values. It varies between 0.66 kWh/m2 and 0.80 kWh/m2 evaluated for 34 and 5 years of estimated values, respectively, in M'Sila. Furthermore, as the number of years of estimated values increases, MABE decreases. The values of this indicator are lower than those of the RMSE for all the analyzed periods since the root mean square of the residuals is greater than the mean of the absolute residuals (Eq. (2) and Eq. (3)). Again, the low MABE values let us say that NASA data relative to daily Global Horizontal Irradiation can be used to estimate the values measured on the ground in M’Sila.
Table 1. Daily comparison between measured and estimated global horizontal irradiation.
|
|
Estimated duration: 5 years |
|||
|
M’Sila |
Saida |
Tamanrasset |
Nouakchott |
|
|
R2 |
0.749 |
0.553 |
0.343 |
0.352 |
|
RMSE |
1.00 |
1.59 |
1.32 |
1.15 |
|
MABE |
0.80 |
1.26 |
0.96 |
0.94 |
|
RRMSE |
20.87 |
28.71 |
24.25 |
18.30 |
|
RPE |
32.88 |
22.13 |
40.82 |
36.74 |
|
MAPE |
22.60 |
28.70 |
23.39 |
16.24 |
|
|
Estimated duration: 10 years |
|||
|
M’Sila |
Saida |
Tamanrasset |
Nouakchott |
|
|
R2 |
0.758 |
0.550 |
0.370 |
0.372 |
|
RMSE |
0.95 |
1.58 |
1.19 |
1.12 |
|
MABE |
0.75 |
1.26 |
0.83 |
0.93 |
|
RRMSE |
19.77 |
28.50 |
21.76 |
17.86 |
|
RPE |
37.53 |
20.45 |
51.23 |
36.74 |
|
MAPE |
22.00 |
28.57 |
21.14 |
16.07 |
|
|
Estimated duration: 15 years |
|||
|
M’Sila |
Saida |
Tamanrasset |
Nouakchott |
|
|
R2 |
0.768 |
0.547 |
0.373 |
0.375 |
|
RMSE |
0.93 |
1.57 |
1.16 |
1.11 |
|
MABE |
0.73 |
1.25 |
0.79 |
0.92 |
|
RRMSE |
19.37 |
28.35 |
21.27 |
17.69 |
|
RPE |
38.63 |
21.01 |
55.07 |
37.85 |
|
MAPE |
21.87 |
28.53 |
20.69 |
16.02 |
|
|
Estimated duration: 20 years |
|||
|
M’Sila |
Saida |
Tamanrasset |
Nouakchott |
|
|
R2 |
0.769 |
0.545 |
0.380 |
0.377 |
|
RMSE |
0.94 |
1.57 |
1.17 |
1.11 |
|
MABE |
0.71 |
1.25 |
0.78 |
0.92 |
|
RRMSE |
19.48 |
28.37 |
21.43 |
17.61 |
|
RPE |
36.71 |
22.13 |
56.71 |
38.40 |
|
MAPE |
21.66 |
28.76 |
20.73 |
15.91 |
|
|
Estimated duration: 25 years |
|||
|
M’Sila |
Saida |
Tamanrasset |
Nouakchott |
|
|
R2 |
0.772 |
0.550 |
0.380 |
0.365 |
|
RMSE |
0.93 |
1.56 |
1.18 |
1.10 |
|
MABE |
0.70 |
1.24 |
0.79 |
0.91 |
|
RRMSE |
19.43 |
28.20 |
21.71 |
17.52 |
|
RPE |
40.00 |
22.41 |
56.71 |
38.12 |
|
MAPE |
21.50 |
28.56 |
20.92 |
15.83 |
|
|
Estimated duration: 30 years |
|||
|
M’Sila |
Saida |
Tamanrasset |
Nouakchott |
|
|
R2 |
0.774 |
0.553 |
0.386 |
0.373 |
|
RMSE |
0.93 |
1.53 |
1.21 |
1.04 |
|
MABE |
0.69 |
1.21 |
0.80 |
0.85 |
|
RRMSE |
19.35 |
27.67 |
22.20 |
16.60 |
|
RPE |
42.74 |
23.25 |
57.26 |
41.16 |
|
MAPE |
21.36 |
28.31 |
21.27 |
15.05 |
|
|
Estimated duration: 34 years |
|||
|
M’Sila |
Saida |
Tamanrasset |
Nouakchott |
|
|
R2 |
0.786 |
0.551 |
0.385 |
0.413 |
|
RMSE |
0.9 |
1.52 |
1.22 |
0.91 |
|
MABE |
0.66 |
1.19 |
0.80 |
0.73 |
|
RRMSE |
18.81 |
27.45 |
22.40 |
14.49 |
|
RPE |
45.48 |
21.85 |
58.63 |
48.90 |
|
MAPE |
20.7 |
28.23 |
21.38 |
13.16 |
Since the relative root mean square error (RRMSE) values for the analyzed periods range between 18.81% and 20.87%, NASA's data describes the measured values moderately or well. Indeed, the daily estimated values given by NASA describe the measured ones in an acceptable manner (good estimate) for all the studied periods except for the short duration of 5 years, as the values of RRMSE found are lower than 20%. Moreover, the lowest value of RRMSE is found for 34 years of estimated values.
The mean absolute percentage deviation between the estimated and measured values (MAPE) varies between 20.7% and 22.60% for all the studied periods in M’Sila. Moreover, as the number of years of estimated values grows, this indicator diminishes. According to Lewis [40], the values found in the case of M'Sila are within the range of reasonable forecasting (i.e., 20 <MAPE <50).
In the case of M’Sila, the percentage of values where the relative percentage error (RPE) falls in the range of -10% to 10% varies between 32.88% and 45.48% for all the studied periods. The longest estimating period yields the highest value, whereas the shortest estimating period yields the lowest value.
As a result of the foregoing, the daily Global Horizontal Irradiation data provided by the NASA site, for all the periods studied, can be used to estimate the measured one on M’Sila ground in an acceptable manner (reasonable).
3.1.2 Daily comparison for Saida region
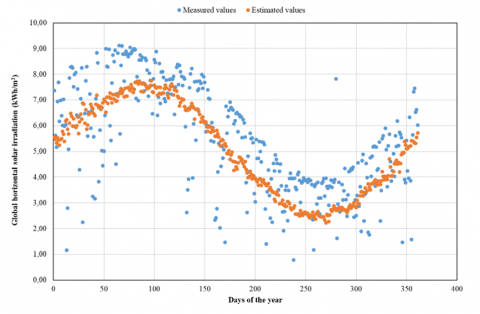
When it comes to the region of Saida, the determination coefficient (R2) is greater than 0.54 for all the periods studied of the estimated values (Table 1). However, it takes the same two-digit value after the decimal point for these periods (i.e., a constant value of 0.55). Hence, there is a moderate link between estimated and measured data, as illustrated in Figure 6. The estimated values given by the NASA/Power project have the same pace as the ground-measured ones (Figure 6). Moreover, the measured values are more dispersed than the estimated ones. This dispersion may be due to cloud passage or to measurement errors.
The root mean square error (RMSE) does not exceed 1.59 kWh/m2 for all the studied periods (Table 1). Indeed, it takes the highest value of 1.59 kWh/m2 for an estimated period of 5 years and the lowest one of 1.52 kWh/m2 for 34 years of estimating. According to Figure 6, the value of RMSE of 34 years of estimating confirms that the estimated values given by NASA/Power are moderately closer to the ground-measured ones. This result remains valid for a short duration of 5 years.
Figure 6. Comparison between measured and estimated solar irradiation in Saida (34 years of estimates)
The mean absolute bias error (MABE), in the case of Saida, varies between 1.19 kWh/m2 and 1.26 kWh/m2, evaluated for 34 and 5 years of estimated values, respectively. Again, the relatively low values of MABE let us say that NASA data relative to daily Global Horizontal Irradiation can be used to estimate moderately the values measured on the ground in Saida.
Since the values of the relative root mean square error (RRMSE) are between 27.45% and 28.71% (i.e., RRMSE < 30%) for the analyzed periods, the data given by NASA/POWER moderately describes the measured values as seen above. Moreover, the lowest value of RRMSE is found for 34 years of estimating.
For all of the analyzed periods in Saida, the mean absolute percentage deviation between estimated and measured values (MAPE) varies between 28.23% and 28.76%. According to Lewis [40], these values are within the range of reasonable estimation (i.e., 20 <MAPE <50).
In the case of Saida, the percentage of values where the relative percentage error (RPE) falls in the range of -10% and 10% varies between 20.45% and 23.25% for all the studied periods. This result is consistent with the graph shown in Figure 6.
From the above, Global Horizontal Irradiation data provided by the NASA site can be used to estimate the measured one on the ground in Saida reasonably.
3.1.3 Daily comparison for Tamanrasset region
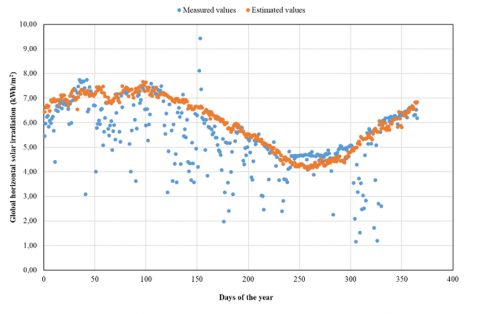
Figure 7. Comparison between measured and estimated solar irradiation in Tamanrasset (34 years of estimates)
The determination coefficient (R2) for Tamanrasset is low compared to the two preceding sites. Indeed, it varies between 0.343 and 0.386 for all the periods studied of the estimated values (Table 1). The low R2 does not imply that the estimated and measured values have no relationship. For this reason, other statistical analysis parameters, rather than only R2, were used in the present investigation.
The root mean square error (RMSE) does not exceed 1.32 kWh/m2 for all the studied periods (Table 1). Indeed, it takes the highest value of 1.32 kWh/m2 for an estimated period of 5 years and the lowest one of 1.16 kWh/m2 for 15 years of estimating. As illustrated in Figure 7, the value of the RMSE of 34 years of estimating (1.22 kWh/m2) confirms that the estimated values given by NASA are moderately closer to those measured on the ground. This result remains valid for a shorter duration of 5 years.
The estimated values given by the NASA site have the same gait as the ground-measured ones (Figure 7). Additionally, they are overestimated. As the measured data comes from a photovoltaic power plant in Tamanrasset rather than a weather station, the recorded values are more dispersed than estimated, which could be related to measurement errors.
The mean absolute bias error (MABE), in the case of Tamanrasset, ranges between 0.78 kWh/m2 and 0.96 kWh/m2 for 20 and 5 years of estimated values, respectively. Again, the low values of MABE let us say that NASA data relative to daily Global Horizontal Irradiation can be used to estimate moderately the values measured on the ground in Tamanrasset.
Since the values of the relative root mean square error (RRMSE) are between 21.27% and 24.25% (i.e., RRMSE < 30%) for the studied periods, the data given by NASA describes moderately the measured values as seen above. Moreover, the lowest value of RRMSE is found for 15 years of estimating, while the highest one is evaluated for a short duration of 5 years.
For all of the analyzed periods in Tamanrasset, the mean absolute percentage deviation between estimated and measured values (MAPE) ranges from 20.69% to 23.39%. According to Lewis [40], the values found in the case of Tamanrasset are within the range of reasonable estimation (i.e., 20 <MAPE <50).
In the case of Tamanrasset, the percentage of values, where the relative percentage error (RPE) falls in the range of -10% and 10%, varies between 40.82% and 58.63%, evaluated for 5 and 34 years of estimated values, respectively. This result is consistent with the graph shown in Figure 7.
From the above, Global Horizontal Irradiation data provided by the NASA site can be used to reasonably estimate the measured one on the ground in Tamanrasset. The best values of the statistical indicators in Tamanrasset do not correspond to the maximum period (i.e., 34 years) as seen in M’Sila because of the source of the measured data. In the case of M'Sila, the measured data is provided by the meteorological station in the same region, while it is supplied by a photovoltaic power plant in the case of Tamanrasset.
3.1.4 Daily comparison for Nouakchott region
The determination coefficient (R2) for Nouakchott is also low compared to the M’Sila and Saida sites. Indeed, it varies between 0.352 and 0.413 for all the periods studied of the estimated values. These two extreme values are evaluated for 5 and 34 years of estimated values, respectively (Table 1).
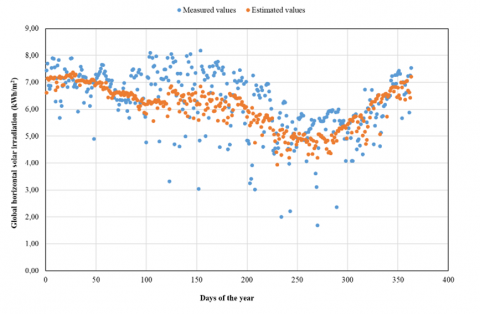
The root mean square error (RMSE) does not exceed 1.15 kWh/m2 for all the studied periods (Table 1). Indeed, it takes the highest value of 1.15kWh/m2 for an estimated period of 5 years and the lowest one of 0.91kWh/m2 for 34 years of estimating. As illustrated in Figure 8, the RMSE of 34 years of estimates confirms that NASA's estimated values are closer to the ground-measured ones. This result remains valid for a shorter duration of 5 years. The estimated values given by the NASA site have the same pace as the ground-measured ones (Figure 8). Additionally, they are underestimated. Moreover, the measured values are more dispersed than the estimated ones. It's possible that this dispersion is related to measurement errors.
The mean absolute bias error (MABE), in the case of Nouakchott, varies between 0.73 kWh/m2 and 0.94 kWh/m2, evaluated for 34 and 5 years of estimated values, respectively. Again, the low MABE values let us say that we can approximate daily Global Horizontal Irradiation measured on the ground in Nouakchott using NASA data.
Since the relative root mean square error (RRMSE) values are between 14.49% and 18.30% (i.e., RRMSE<20%) for the studied periods, the data provided by NASA adequately describes the measured values as seen above. Moreover, the lowest value of RRMSE is obtained for 34 years of estimates, while the highest one is evaluated for a short duration of 5 years.
Figure 8. Comparison between measured and estimated solar irradiation in Nouakchott (34 years of estimates)
For all of the analyzed periods in Nouakchott, the mean absolute percentage deviation between estimated and measured values (MAPE) ranges from 13.16% to 16.24%. According to Lewis [40], the values found in the case of Nouakchott are within the range of good estimation (i.e., 10 <MAPE <20).
In the case of Nouakchott, the percentage of values where the relative percentage error (RPE) falls in the range of -10% to 10% varies between 36.74% and 48.90% for all the studied periods. These two extremes are obtained for 5 and 34 years of estimated values, respectively.
From the above, Global Horizontal Irradiation data provided by the NASA site can be used to adequately estimate the measured one on the ground in Nouakchott.
The current investigation differs from previous studies in that it compares data estimated across several years with data measured in a single year. In the case of daily Global Horizontal Irradiation data, it is found that in the absence of measured data for a year, NASA's average estimated data over several years can be used instead. The use of estimated data over a long period is recommended. Indeed, the values estimated over 34 years are reasonably representative of those measured on the ground for one year, which can be included or not in the estimated period.
Table 2. Daily comparison between measured and estimated global horizontal irradiation for the same year
|
|
Estimated duration: 1 year |
|||
|
M’Sila (Nov. 2015-Oct. 2016)1 |
Saida (2019)1 |
Tamanrasset (2018)1 |
Nouakchott (Apr.2015-Mar.2016)1 |
|
|
R2 |
0.61 |
0.43 |
0.75 |
0.68 |
|
RMSE |
1.325 |
1.71 |
1.0 |
0.70 |
|
MABE |
0.96 |
1.21 |
0.84 |
0.56 |
|
RRMSE |
27.57 |
30.99 |
18.91 |
11.09 |
|
RPE |
38.90 |
34.26 |
38.23 |
63.89 |
|
MAPE |
29.73 |
30.26 |
17.70 |
9.17 |
1The period between parentheses represents the year of the available data, which varies by region.
Now, if we compare the measured values for one year (available data) with those estimated for the same year, the results obtained are shown in Table 2 for the studied regions.
As seen in Tables 1 and 2, the values estimated over 34 years in M'Sila are closer to those recorded on the ground, from November 1st, 2015 to October 31st, 2016 (i.e., one year of measured values). Indeed, the estimated values for this year seem far from the values recorded on the ground, according to the statistical parameters, which present their best values for 34 years. This result remains valid for Saida too. Unlike M’Sila and Saida, the estimated values for one year better describe those recorded on the ground in Tamanrasset and Nouakchott.
In desert regions where the sky is clear most of the time, the estimated daily Global Horizontal Irradiation values for a year are closer to the values recorded on the ground for the same period. Using the clearness index for Spain, Sayago et al. [20] came to the same conclusion. In other words, the match between recorded and NASA/Power estimated daily Global Horizontal Irradiation is very good under clear skies.
3.2 Monthly comparison
The same approach was used to compare the daily Global Horizontal Irradiation estimated over 5, 10, 15, 20, 25, 30, and 34 years with those measured for one year on the ground in M'Sila, Saida, Tamanrasset, and Nouakchott each month.
The NASA site's estimate of daily solar irradiation in M'Sila is good in February, March, May, June, July, August, September, and October, and moderate in the other months. The estimated data in the case of Saida is weak in January, May, September, November, and December and moderate or good to excellent in the remaining months. The estimated values are good to excellent for Tamanrasset in March, April, May, July, October, November, and December, but weak for February and August, and moderate for the rest of the year. In the case of Nouakchott, the estimated data is good to excellent for all the months of the year except for November, where the estimated values are moderate. Moreover, the solar irradiation of the months with overcast skies most of the time is weakly estimated (case of Saida), unlike the months with clear skies, where the estimate is good or even excellent (case of July month for all the analysed sites).
When it comes to the optimal duration to take, there is no hard-and-fast rule. In general, when the time interval of estimated data is important, the estimated data tends to approach the true one in a reasonable manner (for example, in the case of 34-years of estimated values).
When the estimated data is compared to the measured data for the same year, the result is that the estimate is good or even excellent for the bulk of the year in the desert climates (Tamanrasset and Nouakchott). NASA's estimates for internal regions like M'Sila and Saida are reasonable for all months of the year. Furthermore, NASA's estimated values can be higher or lower than the measured values. There are no criteria to meet.
Thus, the monthly daily irradiation provided by the NASA site can be used in the absence of measured ground data since the estimated data for four different areas is reasonable for the bulk of the year. Moreover, the accuracy of NASA's estimated data is affected by the sky conditions (month of the year), measuring apparatus (calibration, precision...), and data reading. It should be noted that, unlike the working case of White et al. [21], the data from the ground-based measurement stations has not undergone any processing.
3.3 Annual comparison based on monthly average daily irradiation
The monthly average daily Global Horizontal Irradiation estimated for 5, 10, 15, 20, 25, 30, and 34 years were compared with those measured during one year on the ground in M’Sila, Saida, Tamanrasset, and Nouakchott using five statistical parameters as a judgment criterion. The results obtained are shown in Table 3.
Table 3. Annual comparison based on monthly average daily irradiation between measured and estimated data
|
|
Estimated duration: 5 years |
|||
|
M’Sila |
Saida |
Tamanrasset |
Nouakchott |
|
|
R2 |
0.966 |
0.980 |
0.754 |
0.871 |
|
RMSE |
0.41 |
0.71 |
0.85 |
0.70 |
|
MABE |
0.33 |
0.64 |
0.74 |
0.59 |
|
RRMSE |
8.60 |
12.96 |
15.66 |
11.15 |
|
MAPE |
7.36 |
13.95 |
13.33 |
10.07 |
|
|
Estimated duration: 10 years |
|||
|
M’Sila |
Saida |
Tamanrasset |
Nouakchott |
|
|
R2 |
0.975 |
0.981 |
0.775 |
0.881 |
|
RMSE |
0.31 |
0.69 |
0.69 |
0.69 |
|
MABE |
0.24 |
0.65 |
0.60 |
0.57 |
|
RRMSE |
6.45 |
12.61 |
12.60 |
10.99 |
|
MAPE |
5.35 |
13.41 |
11.13 |
9.75 |
|
|
Estimated duration: 15 years |
|||
|
M’Sila |
Saida |
Tamanrasset |
Nouakchott |
|
|
R2 |
0.978 |
0.978 |
0.762 |
0.88 |
|
RMSE |
0.28 |
0.67 |
0.66 |
0.68 |
|
MABE |
0.22 |
0.62 |
0.57 |
0.57 |
|
RRMSE |
5.91 |
12.12 |
12.04 |
10.87 |
|
MAPE |
4.77 |
12.71 |
10.69 |
9.75 |
|
|
Estimated duration: 20 years |
|||
|
M’Sila |
Saida |
Tamanrasset |
Nouakchott |
|
|
R2 |
0.980 |
0.978 |
0.766 |
0.879 |
|
RMSE |
0.30 |
0.66 |
0.68 |
0.68 |
|
MABE |
0.24 |
0.61 |
0.58 |
0.58 |
|
RRMSE |
6.18 |
12.07 |
12.51 |
10.81 |
|
MAPE |
5.00 |
12.74 |
10.92 |
9.78 |
|
|
Estimated duration: 25 years |
|||
|
M’Sila |
Saida |
Tamanrasset |
Nouakchott |
|
|
R2 |
0.979 |
0.978 |
0.769 |
0.877 |
|
RMSE |
0.31 |
0.66 |
0.71 |
0.65 |
|
MABE |
0.24 |
0.60 |
0.60 |
0.55 |
|
RRMSE |
6.42 |
11.96 |
12.98 |
10.41 |
|
MAPE |
4.88 |
12.64 |
11.34 |
9.33 |
|
|
Estimated duration: 30 years |
|||
|
M’Sila |
Saida |
Tamanrasset |
Nouakchott |
|
|
R2 |
0.981 |
0.979 |
0.778 |
0.884 |
|
RMSE |
0.30 |
0.60 |
0.75 |
0.56 |
|
MABE |
0.23 |
0.53 |
0.64 |
0.46 |
|
RRMSE |
6.31 |
10.82 |
13.85 |
8.94 |
|
MAPE |
4.48 |
11.30 |
12.15 |
7.83 |
|
|
Estimated duration: 34 years |
|||
|
M’Sila |
Saida |
Tamanrasset |
Nouakchott |
|
|
R2 |
0.982 |
0.977 |
0.776 |
0.893 |
|
RMSE |
0.30 |
0.56 |
0.77 |
0.52 |
|
MABE |
0.22 |
0.49 |
0.66 |
0.43 |
|
RRMSE |
6.24 |
10.16 |
14.18 |
8.27 |
|
MAPE |
4.38 |
10.43 |
12.50 |
7.27 |
The statistical parameters perform better in an annual comparison based on monthly average daily irradiation than in a comparison based on daily irradiation (Tables 1 and 3). Indeed, for all the periods studied of the estimated values and for all the sites chosen, the determination coefficient (R2) is greater than 0.75, the root mean square error (RMSE) and the mean absolute bias error (MABE) do not exceed 0.85 kWh/m2 and 0.74 kWh/m2 respectively (Table 3). Moreover, the RRMSE and MAPE are in the good-to-excellent estimation range. Here again, when the estimated data's time interval is large, the estimated data is closer to the measured data over a year (the case of 34 years in M'Sila, Saida, and Nouakchott).
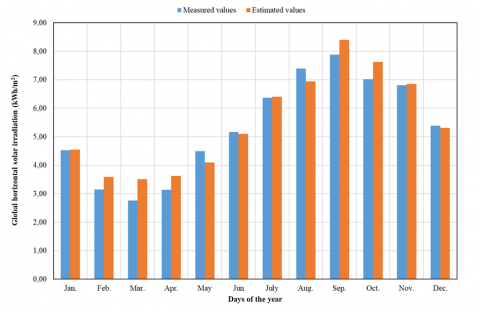
Figure 9. Comparison between measured and estimated monthly average daily irradiation in Saida during 2019
In the absence of a year's measured ground data in M'Sila, Saida, Tamanrasset, and Nouakchott, the monthly average daily Global Horizontal Irradiation estimated for 5, 10, 15, 20, 25, 30, and 34 years can be utilized with a good, even excellent, approximation.
When the estimated monthly average daily irradiation is compared to the measured one for the same year, the results are good or even excellent in all the analysed regions (i.e., R2>0.80, RMSE<0.85 kWh/m2, MABE<0.79 kWh/m2, RRMSE<15.50%, MAPE<14.60%). Figure 9 shows an example. Thus, for the same year, the NASA site's estimated monthly average daily irradiation is closer to the measured one and can be used as a good approximation in the absence of this data.
The current study aims to validate the accuracy of the free data provided by the National Aeronautics and Space Administration (NASA) database by comparing it to measurements taken on the ground in four different sites located in two African countries, namely, Algeria and Mauritania. Indeed, it compares global horizontal irradiation data downloaded from the NASA site for 34 years, i.e., from 1984 to 2017, with data recorded on the ground in M’Sila, Saida, Tamanrasset, and Nouakchott for one year (365 days). The comparison between measured and estimated data was carried out on daily (n = 365), monthly (n = 30 or 31), and annual (n = 12) time scales using six statistical parameters.
When measured daily Global Horizontal Irradiation data is not available for a year, NASA's average estimated data (daily Global Horizontal Irradiation) across multiple years might be used instead. The 34-year values are reasonably reflective of those measured on the ground for one year, which can be included or excluded from the projected period. This result applies to both the monthly daily irradiation as well as the monthly average daily global horizontal irradiation.
The accuracy of NASA's estimated data is affected by the sky conditions, measuring apparatus (calibration, precision, etc.), and data reading. It may be greater or less than the measured values. Indeed, the match between recorded and NASA/Power estimated daily Global Horizontal Irradiation is very good under clear skies.
For the same year, the solar irradiation estimates obtained from NASA-POWER project have proven to be reliable as is the case of Algeria and Mauritania.
One of the current study's shortcomings is that it was done using one year of ground-measured data. In addition, not all of the measured data included in this study came from meteorological stations.
In the absence of real data, NASA's estimated data can be used in solar energy projects (for example, estimation of solar potential) in Algeria and Mauritania.
|
DHI |
Diffuse Horizontal Irradiance, kWh.m-2 |
|
DNI |
Direct Normal Irradiance, kWh.m-2 |
|
GHI |
Global Horizontal Irradiance, kWh.m-2 |
|
R² |
Determination Coefficient |
|
RMSE |
Root Mean Square Error |
|
RRMSE |
Relative Root Mean Square Error |
|
MABE MAPE |
Mean Absolute Bias Error Mean Absolute Percentage Error, % |
|
Subscripts |
|
|
m |
measured |
|
c |
calculated |
|
n |
Number of days |
[1] Kalogirou, S.A. (2004). Solar thermal collectors and applications. Progress in Energy and Combustion Science, 30(3): 231-295. http://dx.doi.org/10.1016/j.pecs.2004.02.001
[2] Şen, Z. (2004). Solar energy in progress and future research trends. Progress in Energy and Combustion Science, 30(4): 367-416. http://dx.doi.org/10.1016/j.pecs.2004.02.004
[3] Rehman, S., Bader, M.A., Al-Moallem, S.A. (2007). Cost of solar energy generated using PV panels. Renewable and Sustainable Energy Reviews, 11(8): 1843-1857. https://doi.org/10.1016/j.rser.2006.03.005
[4] Arif, M.S. (2013). Residential solar panels and their impact on the reduction of carbon emissions. University of California, Berkeley. https://nature. berkeley. edu/classes/es196/projects/2013final/ArifM_2013. pdf. https://www.nature.berkeley.edu/classes/es196/projects/2013final/ArifM_2013.pdf.
[5] Kabir, E., Kumar, P., Kumar, S., Adelodun, A.A., Kim, K.H. (2018). Solar energy: Potential and future prospects. Renewable and Sustainable Energy Reviews, 82: 894-900. https://doi.org/10.1016/j.rser.2017.09.094
[6] Seddegh, S., Wang, X., Henderson, A.D., Xing, Z. (2015). Solar domestic hot water systems using latent heat energy storage medium: A review. Renewable and Sustainable Energy Reviews, 49: 517-533. http://doi.org/10.1016/j.rser.2015.04.147
[7] Islam, M.R., Sumathy, K., Khan, S.U. (2013). Solar water heating systems and their market trends. Renewable and Sustainable Energy Reviews, 17: 1-25. http://doi.org/10.1016/j.rser.2012.09.011
[8] International Energy Agency (IEA). (2016). Key World Energy Trends, Excerpt from: World energy balances. https://iea.blob.core.windows.net/assets/680c05c8-1d6e-42ae-b953-68e0420d46d5/WEO2016.pdf.
[9] Solar Power Technology and Economics. (2018). https://www.mpoweruk.com/solar_power.htm, accessed on Aug. 20, 2020.
[10] Yaciuk, G. (1981). Agricultural applications of solar energy. In Solar Energy Conversion II, 337-353. Pergamon. https://doi.org/10.1016/B978-0-08-025388-6.50047-7
[11] Hasan, M., Langrish, T.A.G. (2017). Solar kilns: A green technology for the Australian agricultural and forest industries. Clean Energy for Sustainable Development, 143-166. http://doi.org/10.1016/b978-0-12-805423-9.00005-3
[12] Bhatia, S.C. (2014). Solar thermal energy. Advanced Renewable Energy Systems (chapter book n°4), 94-143. https://doi.org/10.1201/b18242
[13] Parida, B., Iniyan, S., Goic, R. (2011). A review of solar photovoltaic technologies. Renewable and Sustainable Energy Reviews, 15(3): 1625-1636. http://dx.doi.org/10.1016/j.rser.2010.11.032
[14] Islam, M.T., Huda, N., Abdullah, A.B., Saidur, R. (2018). A comprehensive review of state-of-the-art concentrating solar power (CSP) technologies: Current status and research trends. Renewable and Sustainable Energy Reviews, 91: 987-1018. https://doi.org/10.1016/j.rser.2018.04.097
[15] Gorjian, S., Hashjin, T.T., Ghobadian, B. (2011). Solar Powered Greenhouses. In SET2011, 10th International Conference on Sustainable Energy Technologies, Istanbul, Turkye.
[16] https://firstgreenconsulting.wordpress.com/2012/06/04/comparison-of-csp-technologies/comparison-of-csp-technologies/, accessed on Sep. 22, 2020.
[17] Jed, M.E.H., Ihaddadene, R., Ihaddadene, N., Sidi, C.E.E., Bah, M.E. (2020). Performance analysis of 954,809 kWp PV array of Sheikh Zayed solar power plant (Nouakchott, Mauritania). Renewable Energy Focus, 32: 45-54. http://dx.doi.org/10.1016/j.ref.2019.11.002
[18] Hadji, F., Ihaddadene, N., Ihaddadene, R., Kherbiche, Y., Mostefaoui, M., Beghidja, A.H. (2018). Solar energy in M’Sila (Algerian Province). In 2018 6th International Renewable and Sustainable Energy Conference (IRSEC), pp. 1-5. http://doi.org/10.1109/IRSEC.2018.8702944
[19] Ovando, G., Sayago, S., Bocco, M. (2018). Evaluating accuracy of DSSAT model for soybean yield estimation using satellite weather data. ISPRS Journal of Photogrammetry and Remote Sensing, 138: 208-217. http://doi.org/10.1016/j.isprsjprs.2018.02.015
[20] Sayago, S., Ovando, G., Almorox, J., Bocco, M. (2020). Daily solar radiation from NASA-POWER product: assessing its accuracy considering atmospheric transparency. International Journal of Remote Sensing, 41(3): 897-910. https://doi.org/10.1080/01431161.2019.1650986
[21] White, J.W., Hoogenboom, G., Wilkens, P.W., Stackhouse Jr, P.W., Hoel, J.M. (2011). Evaluation of satellite-based, modeled-derived daily solar radiation data for the continental United States. Agronomy journal, 103(4): 1242-1251. http://doi.org/10.2134/agronj2011.0038
[22] Khalid, H., Zakaria, M. (2016). Estimation of solar radiation in southern areas of Pakistan using radiation models. Journal of Renewable and Sustainable Energy, 8(4): 043701. http://dx.doi.org/10.1063/1.4955074
[23] Angstrom, A. (1924). Solar and terrestrial radiation. Report to the international commission for solar research on actinometric investigations of solar and atmospheric radiation. Quarterly Journal of the Royal Meteorological Society, 50(210): 121-126. http://doi.org/10.1002/qj.49705021008
[24] Hargreaves, G.H., Samani, Z.A. (1982). Estimating potential evapotranspiration. Journal of the irrigation and Drainage Division, 108(3): 225-230. https://doi.org/10.1061/JRCEA4.0001390
[25] Ulfat, I., Javed, F., Abbasi, F.A., Kanwal, F., Usman, A., Jahangir, M., Ahmed, F. (2012). Estimation of solar energy potential for Islamabad, Pakistan. Energy Procedia, 18: 1496-1500. http://doi.org/10.1016/j.egypro.2012.05.166
[26] Liang, S. (2005). Quantitative Remote Sensing of Land Surfaces. John Wiley & Sons. https://doi.org/10.1016/j.agsy.2005.11.003
[27] Journée, M., Bertrand, C. (2010). Improving the spatio-temporal distribution of surface solar radiation data by merging ground and satellite measurements. Remote Sensing of Environment, 114(11): 2692-2704. http://doi.ord/10.1016/j.rse.2010.06.010
[28] https://power.larc.nasa.gov/data-access-viewer, accessed on July 13, 2020.
[29] https://meteonorm.com, accessed on Aug. 20, 2020.
[30] https://solargis.com, accessed on Aug. 20, 2020.
[31] Lu, N., Qin, J., Yang, K., Sun, J. (2011). A simple and efficient algorithm to estimate daily global solar radiation from geostationary satellite data. Energy, 36(5): 3179-3188. http://doi.org/10.1016/j.energy.2011.03.007
[32] Linares-Rodriguez, A., Ruiz-Arias, J.A., Pozo-Vazquez, D., Tovar-Pescador, J. (2013). An artificial neural network ensemble model for estimating global solar radiation from Meteosat satellite images. Energy, 61: 636-645. http://doi.org/10.1016/j.energy.2013.09.008
[33] López, G., Batlles, F.J. (2014). Estimating solar radiation from MODIS data. Energy Procedia, 49: 2362-2369. http://doi.org/10.1016/j.egypro.2014.03.250
[34] Polo, J. (2015). Solar global horizontal and direct normal irradiation maps in Spain derived from geostationary satellites. Journal of Atmospheric and Solar-Terrestrial Physics, 130: 81-88. http://doi.org/10.1016/j.jastp.2015.05.015
[35] Polo, J. (2015). Solar global horizontal and direct normal irradiation maps in Spain derived from geostationary satellites. Journal of Atmospheric and Solar-Terrestrial Physics, 130: 81-88. https://doi.org/10.1016/j.jastp.2015.05.015
[36] Almorox, J., Ovando, G., Sayago, S., Bocco, M. (2017). Assessment of surface solar irradiance retrieved by CERES. International Journal of Remote Sensing, 38(12): 3669-3683. http://doi.org/10.1080/01431161.2017.1302111
[37] IhaddadeneN. IhaddadeneR. MostfaouiM.Climate change in three different zones in Algeria. J Earth Sci Clim Change 2019; 10. https://www.omicsonline.org/conference-proceedings/climate-change-in-three-different-zones-in-algeria.pdf, accessed on Aug. 20, 2020.
[38] https://planificateur.acontresens.net/afrique/algerie/wilaya_de_saida/saida/2482572.html, accessed on Aug. 20, 2020.
[39] Li, M.F., Tang, X.P., Wu, W., Liu, H.B. (2013). General models for estimating daily global solar radiation for different solar radiation zones in mainland China. Energy Conversion and Management, 70: 139-148. https://doi.org/10.1016/j.enconman.2013.03.004
[40] Lewis, C.D. Industrial and Business Forecasting Methods. London: Butterworths. https://doi.org/10.1002/for.3980020210