Younes Kherbiche* | Nabila Ihaddadene | Razika Ihaddadene | Feres Hadji | Jed Mohamed | Abedel Hadi Beghidja
© 2021 IIETA. This article is published by IIETA and is licensed under the CC BY 4.0 license (http://creativecommons.org/licenses/by/4.0/).
OPEN ACCESS
Solar energy is the most important green energy source that may be used to address the problems caused by conventional energy sources. The research in this paper aims to evaluate the solar energy potential of M'Sila, an Algerian internal region, and to determine which technology, among those currently available on the market, is adequate for harnessing that potential for electricity production (PV and CSP). This assessment was based on data (daily temperature and daily solar irradiation) collected at M'Sila weather station for one year and from the NASA site for 34 years from 1984 to 2017. These data were treated with excel 2016 software to determine the total horizontal, diffuse and direct normal solar irradiation. During the study period, the total solar irradiation falling on a horizontal surface in M'Sila (GHI) was estimated to be 1.79 MWh/m2/year. The diffuse solar irradiation incident on a horizontal surface (DHI) and direct normal irradiation, respectively, were estimated to be 594.88 kWh/m2/year, 2117.93 kWh/m2/year. M'Sila is a favourable land for the installation of concentrating solar power plants and photovoltaic panels due to its significant potential energy. The parabolic trough system is recommended. While polycrystalline PV modules should be promoted and installed in M'Sila.
concentrated solar power, diffuse solar irradiation, direct normal irradiation, global solar irradiation, M’Sila, photovoltaic system, solar energy potential
Since the mid-nineteenth century, when the industrial era began, humanity's energy consumption has increased in various ways to meet the increasing demand of populations (industry, transportation, electricity, heating, cooling, etc.) [1]. Conventional energy sources (coal, oil, and natural gas) have played an important role in the current industrial revolution. However, due to their excessive consumption, they are currently running out [1-3]. Fossil fuels contribute to global warming by emitting large amounts of greenhouse gases (particularly the well-known carbon dioxide, CO2) during combustion [2, 4]. Aside from the problems outlined above, another downside of conventional energy is the volatile price of fossil fuels, which is particularly problematic for countries that import them [5].
Renewable energies (solar, wind, biomass, hydropower, geothermal, and others) appear to solve the problems that conventional and nuclear energies have caused [1]. At least one natural energy source exists in every country on the planet. As a result, governments all over the world have implemented policies to exploit and promote the use of their natural energy resources as a substitute for conventional and nuclear energy.
Solar energy is the most important eco-friendly energy source [4, 6]. Indeed, it is the source of fossil, wind, and tidal energies [4]. All countries on the globe have access to solar energy in the form of light and heat. The amount that reaches the earth, however, varies depending on location and climate.
Solar irradiation is the key parameter to determine the solar energy potential of any site. It represents the sun’s radiant energy falling on a unit surface area for a period, expressed in kWh/m2/duration. This duration is often a year or a day.
Human-made solar energy technologies capture solar radiation first, and then convert it to heat [7], or electricity, depending on the type of energy desired. The heat collected by various solar thermal systems can be used for low, medium, and high-temperature applications. Technologies such as concentrated solar power (CSP) are being used to provide electricity indirectly (compared to photovoltaic systems) [8, 9]. CSP technology is well suited to areas of the world that receive a large amount of solar radiation [2]. There are currently 98 CSPs in operation worldwide and others under construction and development [8].
There are four main types of CSP collectors, namely parabolic trough, central receiver (tower power), parabolic dish, and linear Fresnel. In the parabolic trough collectors (PTC), solar radiation is concentrated onto a receiver tube through a large curved mirror in the shape of a U. In the solar power tower (SPT), large flat sun-tracking mirrors (heliostats) concentrate solar radiation onto a single point receiver at the top of the centrally located tower. A sun-tracking reflector dish concentrates solar radiation on a single point receiver at the parabolic dish collector's focal point (SPD). Multiple flat mirrors that track the sun are used in linear Fresnel collectors (LFC) to concentrate sunlight onto a receiver tube [8, 10].
Photovoltaic technology, which uses semiconductors to convert solar radiation directly into electricity with no emissions, noise, or vibration, is another scientific knowledge application. This technology is a considerable power source for meeting electricity needs in both built environments or in rural and remote locations where connection to the grid is very difficult or in the absence of energy infrastructure [11].
Owing to its geographical location, Algeria has the highest solar energy potential in the Middle East and North Africa (MENA) region and one of the largest in the world. Indeed, Algeria's solar potential energy is estimated to be 13.9 TWh per year [12]. Moreover, the average annual duration of sunshine hours in the coastal area of Algeria is estimated to be 2650 hours. In the highlands, it reaches 3000 hours, while in the Sahara, it reaches 3500 [13]. Given this important potential, Algeria’s leaders have decided to exploit it to produce electricity for local consumption and export through an ambitious policy. This study is part of a larger project to estimate each region's solar potential in Algeria, a large country. M'Sila is one of the most important states in Algeria's high plateaus due to its distinguished geographical location, which qualifies it to become an economic and development pole, as it is considered a linking point between north and south, east and west.
This investigation intends to assess for the first time the solar energy potential of M'Sila, and to identify which technology, among those now available on the market, is appropriate for harnessing its solar potential for electricity production (PV and CSP). This assessment is based on data collected at M'Sila weather station for one year and from the NASA site [14] for 34 years from 1984 to 2017.
This paper starts with an introduction, then moves on to the methodology utilized, followed by the results and discussion of the findings. Finally, the report comes to a close with a conclusion.
2.1 Site location
M'Sila is the 28th of Algeria's 58 provinces, located in the north of the country at the Sahara's gates, as depicted in Figure 1. It sits at the intersection of the East, West, North, and South. As a result, it is eligible to become an economic and development zone. M’Sila covers an area of 18,175 km2 for an estimated population of 1,210,952 inhabitants [15]. The studied region is situated on Algeria's upper plateaus at a latitude of 35° 42`07``, a longitude of 4° 32`43``, and an altitude of 441 m above sea level. Due to global warming, M'Sila was previously categorized as a semi-arid zone but is now classified as an arid region [16]. The encouragement of investment in this region has received a lot of attention from government officials.
2.2 Data
The average daily temperature, maximum daily temperature, and daily global solar irradiation incident on a horizontal surface in M'Sila for 34 years (from 1984 to 2017) were used in the current study. The clearness index (KT), global horizontal irradiation (GHI), diffuse horizontal irradiation (DHI), and direct normal irradiation (DNI) were all calculated using data from NASA's website [14]. Moreover, the day length was calculated using data collected by M'Sila weather station for a year (from November 1st, 2016 to October 31st, 2017).
Figure 1. Location of M’Sila
2.3 Study parameters
2.3.1 Global horizontal irradiation (GHI)
Global horizontal irradiation (GHI) represents the total energy received from the sun and the sky by a horizontal surface on Earth. It is an essential criterion for solar potential estimation at any location.
2.3.2 Clearness index KT
The daily clearness index KT for a given site is defined as the ratio of the radiation reaching this site on a given day to the extra-terrestrial radiation reaching this site on that day expressed as [17]:
$K_{T}=\frac{H}{H_{0}}$ (1)
where, H is the daily total radiation received on a terrestrial horizontal plane, and H0 is the radiation received by the same plane outside the Earth's atmosphere. These radiations are expressed in MJ/m2.
The daily extra-terrestrial radiation incident on a horizontal surface may be obtained from the following equation [17]:
$H_{0}=\frac{24}{\pi} G_{s c}\left[1+0.033 \cos \left(\frac{360 \times n}{365}\right)\right]$
$\times\left[\cos \phi \cos \delta \sin \omega_{s}+\frac{2 \pi \omega_{s}}{360} \sin \phi \sin \delta\right] \times \frac{3600}{10^{6}}$ (2)
where, Gsc is the solar constant (Gsc=1367 W/m2), n is the day of the year (i.e., for January 1st, n=1), ϕ is the site's latitude, and $\delta$ is the declination angle given below:
$\delta=23.45 \sin \left(360 \frac{(284+n)}{365}\right)$ (3)
ωs is the sunrise hour angle given as:
$\omega_{S}=\cos ^{-1}(-\tan \phi \tan \delta)$ (4)
All the angles of Eq. (2) are expressed in degrees.
2.3.3 Diffuse irradiation
Diffuse irradiation is the non-directional radiation that comes from the entire sky vault but has had its direction changed by diffusion by molecules or particulates in the atmosphere [17]. It's also known as sky radiation, diffuse skylight, or simply a skylight. There are several models in the literature used for diffuse irradiation determination. In this study, the model of Erbs et al. [17] was adopted. It is described as follows:
For $\omega_{s} \leq 81.4^{\circ}$ and $0.3 \leq \bar{K}_{T} \leq 0.8$
$\frac{\overline{H_{D}}}{\bar{H}}=1.391-3.560 \overline{K_{T}}+4.189 \overline{K_{T}}^{2}-2.137 \overline{K_{T}}^{3}$ (5a)
For $\omega_{s}>81.4^{\circ}$ and $0.3 \leq \bar{K}_{T} \leq 0.8$
$\frac{\overline{H_{D}}}{\bar{H}}=1.311-3.022 \overline{K_{T}}+3.427 \overline{K_{T}}^{2}-1.821 \overline{K_{T}}^{3}$ (5b)
where, $\bar{H}$ is the monthly average daily total irradiation, $\bar{H}_D$ is the monthly average daily diffuse irradiation, and, $\bar{K}_T$ is the monthly average clearness index.
2.3.4 Direct normal irradiation (DNI)
Direct normal irradiation data is essential for the design and assessment of concentrating solar collectors, which track the sun's position [18]. It represents the amount of direct solar irradiation received per unit area by a plane perpendicular (or normal) to the sun's rays. In the current study, DNI belonging to the decomposition models is used. It is based on correlations between the global, direct, and diffuse components of solar irradiation, as stated below:
$G H I=D N I \times \cos \theta_{z}+D H I$ (6)
where, GHI is the global horizontal irradiation, DNI is the direct normal irradiation, and θz the solar zenith angle (the angle between the sun’s position and the vertical line perpendicular to the earth’s surface).
The current study uses the straightforward and accurate approach published by Pérez-Higueras [19], for estimating DNI from the monthly average daily global horizontal irradiation.
3.1 Global horizontal irradiation (GHI)
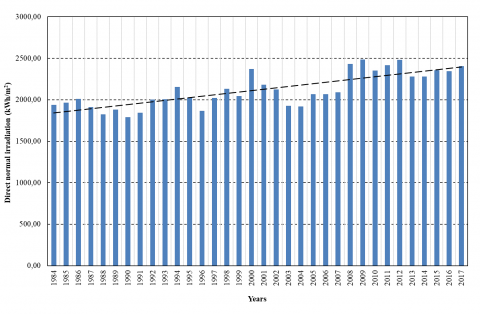
Figure 2 depicts the evolution of annual global horizontal irradiation in M'Sila over 34 years. Since the slope of the trend line is positive (dashed line), solar energy received in M'Sila is increasing. This result demonstrates that M'Sila region is warming, which is consistent with our findings on the climatic change that this region has experienced when using temperature and precipitation data [16].
Figure 2. Evolution of the annual global horizontal irradiation in M’Sila over 34 years
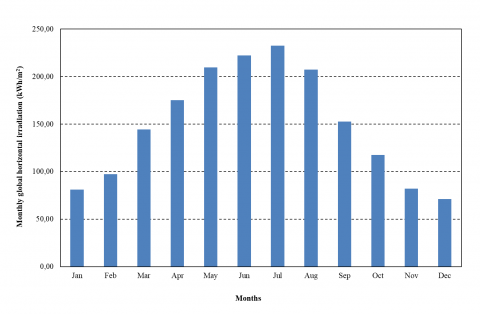
Total solar radiation falling on a horizontal surface in M'Sila (GHI) during the study period is estimated to be 1.79 MWh/m2/year, i.e., 4.91 kWh/m2/day. On a monthly scale, July is the sunniest month, whereas December is the least sunny month (see Figure 3). In terms of numerical values, the total monthly solar irradiation in M’Sila varies between 71.07 kWh/m2 and 232.42 kWh/m2 (recorded in December and July, respectively).
Figure 3. Evolution of the monthly global horizontal irradiation in M’Sila over 34 years
The average monthly solar irradiation recorded in M’Sila over the 34 years of study is estimated to be 149.40 kWh/m2/month. It should be mentioned that since 1984, the global monthly solar irradiation in M’Sila has exceeded 57310 W/m2. As can be seen from the above, M'Sila has a significant solar energy resource that needs to be used.
3.2 Clearness index KT
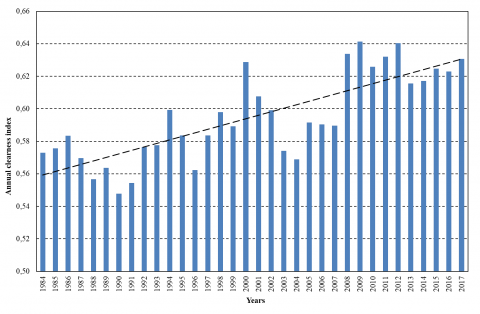
The daily clearness index spans from 0.03 to 0.81 across the study period, with the monthly average clearness index ranging from 0.40 (measured in January 2003) to 0.72. (recorded in July 2000). The monthly average clearness index is highest in July and August (dry months) and lowest in December, November, and February (wet months). The yearly clearness index, on the other hand, varies from 0.55 recorded in 1990 to 0.64 registered in 2009, as seen in Figure 4.
Figure 4. Evolution of the yearly clearness index in M’Sila over 34 years
Furthermore, since 2008, the yearly clearness index has exceeded 0.61, indicating that more than 61% of annual extra-terrestrial radiation gets through the atmosphere and reaches M'Sila ground. Hence, the yearly clearness index tends to increase over the study period (dashed line in Figure 4). This outcome is in agreement with the increasing amounts of solar irradiation incident on M'Sila.
For the classification of sky conditions, different threshold values of KT have been utilized [20, 21]. The following are the values used in this study [21, 22]:
KT < 0.35 for the cloudy or overcast sky,
0.35 ≤ KT ≤ 0.65 for the partly cloudy sky,
KT ˃ 0.65 for clear sky.
Figure 5. Evolution of the sky condition in M’Sila during 34 years of study
Over the study period, i.e., 12,410 days, M'Sila experienced 39% of sunny days (clear skies), 54% of partly cloudy skies, and 7% of overcast skies. Therefore, in M'Sila, the sky is dominated by a partially cloudy sky. The value of the annual average clearness index, which is assessed at 0.59, supports this conclusion. However, as seen in Figure 5, these proportions have shifted since 2008.
Indeed, during the last decade, M'Sila recorded 60% of clear skies, 35% of partly cloudy skies, and 5% of overcast skies. For the past decade, M'Sila's sky has been characterized by clear skies.
The industrialization of M'Sila region, the deforestation of its land, the urbanization of the area through building construction, the diminution of green spaces, the improvement of lifestyle, and other factors have all contributed to this transformation. Indeed, factories and buildings are the primary sources of greenhouse gas emissions, which have contributed to climate change.
The increase in incident solar energy recorded by this region, as described above, is due to the clarity of the atmosphere (see Figure 2 and Figure 4). The number of days with cloudy skies, as well as those with partially cloudy skies, is on the decline. On the other hand, the number of sunny days (clear skies) is rising (dashed lines in Figure 5).
The average day length (maximum sunshine duration) in M’Sila, according to the analysis of the data collected at M'Sila weather station for one year, is estimated at 12 hours. It exceeds 9 hours in winter and does not reach 15 hours in summer.
3.3 Diffuse horizontal irradiation (DHI)
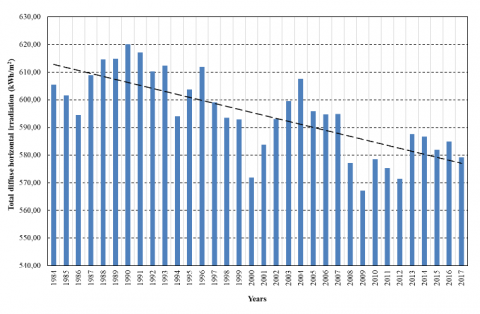
Figure 6 depicts the evolution of the estimated yearly diffuse horizontal irradiation from the hemisphere sky vault during 34 years of study. In contrast to the global horizontal irradiation and clearness index, annual diffuse irradiation tends to decrease (dashed line). Furthermore, in 1990, M'Sila experienced a high diffuse solar irradiation of 620.05 kWh/m2, and the incident diffuse irradiation hasn't topped 590 kWh/m2/year since 2008. The cloud mass that disperses direct sunlight tends to disappear, allowing more direct radiation to pass, as shown in Figures 2 and 4, and hence less incident diffuse radiation (Figure 6). Direct solar irradiation has become the primary component of incident solar irradiation in M'Sila over the last decade.
The diffuse solar irradiation incident on a horizontal surface in M'Sila (DHI) is estimated to be 594.88 kWh/m2/year, or 1.63 kWh/m2/day, based on 34 years of study.
Figure 6. Evolution of the estimated annual diffuse irradiation in M’Sila over 34 years
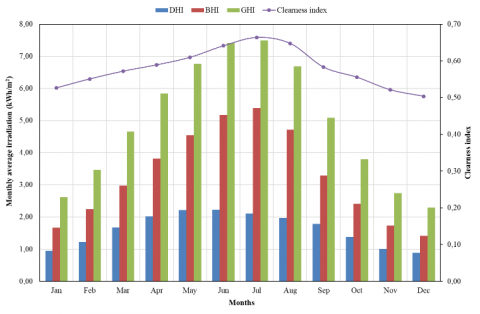
As shown in Figure 7, the highest values of monthly average daily diffuse irradiation occur most commonly between June and May (dry months), while the lowest values occur in December (wet months). The monthly average diffuse horizontal irradiation measured in M’Sila for the 34-year study period is estimated to be 49.57 kWh/m2/month. It's worth noting that since 1984, the monthly diffuse irradiation in this area hasn't exceeded 74 kWh/m2.
The cloudiness index of the atmosphere, which measures the ratio of diffuse to global solar irradiation, is highest in December and lowest in July (Figure 7). In other words, the diffuse portion of total solar irradiation in M'Sila is around 39% in December and 28% in July throughout the examined time. It should be noted that the cloudiness index in M’Sila ranges from 24% to 51%, with the highest reading occurring only once in January 2003 (an extreme phenomenon). Furthermore, the sky is rarely overcast.
Figure 7. Evolution of $\overline{\mathrm{DHI}}, \overline{\mathrm{GHI}}, \overline{\mathrm{BHI}}$, and KT in M’Sila over 34 years
The evolution of the components of the monthly average daily global horizontal irradiation, as well as the clearness index KT over the 34 years of study, is depicted in Figure 7. As seen, the wet months are characterized by a low clarity index and consequently low global solar irradiation, which includes a significant amount of diffuse irradiation. During the dry months, the opposite occurs (i.e., high KT, high GHI, low DHI, and high BHI (beam horizontal irradiation)).
3.4 Direct Normal irradiation (DNI)
Figure 8 depicts the evolution of annual direct normal irradiation in M'Sila over 34 years.
As seen, it has the same gait as the annual global solar irradiation and yearly clearness index depicted in Figures 2 and 4, respectively. Indeed, the annual direct normal irradiation is increasing since the slope of the trend line is positive (dashed line). To give more detail, the minimum value of DNI, estimated at 1788.71 kWh/m2, was recorded in 1990, and since 2008, the incident DNI has exceeded 2279.78 kWh/m2/year.
Figure 8. Evolution of the estimated annual direct normal irradiation in M’Sila over 34 years
This result confirms that M'Sila region tends to receive more direct solar irradiation, which is in agreement with the previous outcomes (less diffuse irradiation, and more clear sky). Over the study period, the DNI in M'Sila is estimated at 2117.93 kWh/m2/year, i.e., 5.80 kWh/m2/day.
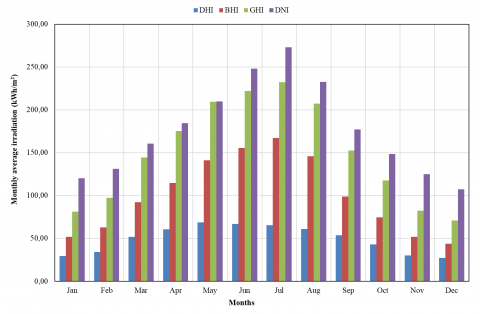
As previously stated, December is the least sunny month. Hence, the lowest DNI values are most usually recorded in this month, while the highest values are registered in July, the sunniest month (Figure 9). In terms of numerical values, the monthly average daily DNI in M’Sila varies between 2.11 kWh/m2 and 10.29 kWh/m2 (recorded in January 2003 and July 2000, respectively). The average monthly DNI in M’Sila over the studied 34 years is estimated at 176.49 kWh/m2/month. It is noted that the monthly DNI registered in that region since 1984 exceeds 65 kWh/m2.
Figure 9. Evolution of monthly average DHI, GHI, BHI, and DNI over 34 years in M’Sila
As seen in Figure 9, the values of DNI are larger than those of GHI since DNI represents the amount of solar radiation falling on a unit surface area perpendicular to the direct solar radiation coming in a straight line from the sun throughout the day. As is known, when the surface is perpendicular to the sun's rays, it receives the maximum amount of solar energy. Over the study period of 34 years, DNI and GHI have been estimated to peak at 273.20 kWh/m2 and 232.42 kWh/m2, respectively, in July (dry month). In contrast, they attain their minimums evaluated at 107.40 kWh/m2 and 71.07 kWh/m2, respectively, in December (wet month).
The DNI is an intriguing parameter for solar-concentration systems that track the sun's position. For the development of solar concentrators, a DNI criterion of > 1800 kWh/m2/year is recommended [23]. Thus, M'Sila, with a DNI of 2117.93 kWh/m2/year, is favourable land for the installation of concentrated solar power plants intended to produce electricity.
3.5 M’Sila’s Solar potential applications
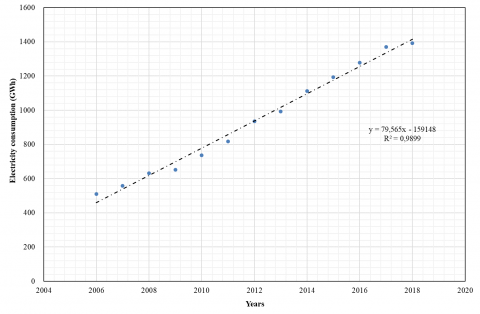
M’Sila’s electricity consumption has doubled in the past decade (Figure 10) due, especially to improved lifestyles. If electricity is generated from fossil fuels, modern life has a negative impact on the environment by emitting a significant amount of CO2.
Indeed, electricity production is responsible for approximately 40% of the total emissions worldwide, followed by transportation and industry sectors. It is, therefore, important to produce electricity from renewable sources to ensure sustainable development.
Figure 10. Electricity consumption from 2006-2018 in M’Sila
Given the solar potential that M’Sila has, we can generate solar thermal electricity from commercial CSP plants. The electric power generated by CSP systems differs according to the technology used. Indeed, it varies from 0.1 MW for SPD up to 200 MW for PTC and LFR.
SPD has the highest annual thermal and electrical efficiency among CSP technologies, as does SPT. These latter are the most land-consuming and high-cost CSP installations. When compared to other technologies, SPD uses the least amount of water. SPD also produces the least amount of electric power. It can be used in remote areas to produce off-grid electricity. Each CSP technology has pros and cons. However, the parabolic trough system (PTC) is the lowest-cost [24] and most widely used CSP technology in the world [24, 25].
To give an idea, without making any calculation, the Kanchanaburi site in Thailand has an average daily horizontal irradiation estimated at 4.88 kWh/m2/day, which is closer to that of M'Sila. Since 2012, this site has produced 8000 MWh/year of green electricity using a 5 MW commercial PTC plant installed in an area of 1,100,000 m2 [8].
Likewise, the amount of electrical power generated directly by PV systems differs depending on the technology used. Indeed, there are three different technologies for photovoltaic solar cells called wafer-based crystalline silicon technology, thin-film solar cell technology, and other new emerging technologies.
The performance of solar modules (conversion process) is influenced by environmental factors such as ambient temperature, solar radiation, wind, and relative humidity, in addition to PV technology.
El-din et al. [26] established criteria for choosing the technology of photovoltaic panels based on the temperature of the site being considered. Indeed, they claimed that monocrystalline silicon would be best suited for sites with a maximum average ambient temperature of 30℃ or less. The polycrystalline, on the other hand, would be more suited to locations with an average maximum ambient temperature of 40℃ or less. For locations with an average maximum ambient temperature of more than 40℃, the amorphous thin film type would be best.
Figure 11 shows the evolution of the maximum average annual temperature and the annual average temperature in M’Sila during the study period.
As can be seen, the maximum average ambient temperature does not exceed 40℃ and can go beyond 30℃. As a result, it is advised that polycrystalline PV modules be promoted and installed in M'Sila.
Figure 11. Evolution of the maximum average annual temperature and the annual average temperature in M’Sila over 34 years
To give an idea, without making any calculations, Oued Kebrit, in the North East of Algeria, has a solar potential close to M’Sila with a GHI of 1808 kWh/m2. A 15 MWp photovoltaic power plant has been installed over 32 hectares of this site. This plant has been in service since 2015.
Finally, we can also use M'Sila's solar potential to generate domestic hot water, cook, and so on with excellent efficiency because it is the conversion of heat into heat.
This 34-year study dedicated to evaluating the solar potential of M'Sila (a province in Algeria's interior) allows us to say that M'Sila is an excellent site to exploit in terms of solar energy since it receives a GHI of 1.79 MWh/m2/year and a DNI of 2117.93 kWh/m2/year.
M’Sila is a favorable land for the installation of concentrated solar power plants intended to generate electricity using the parabolic trough system, which is a mature technology with lower costs.
The values of the maximum average ambient temperature do not exceed 40℃ and can go beyond 30℃. Therefore, polycrystalline PV modules are recommended.
M'Sila's solar potential may also be used to generate household hot water, cook, and so on with high efficiency.
Since 2008, M’Sila has experienced a marked climate change characterized by an increase in global horizontal irradiation and direct normal irradiation, a decrease in diffuse irradiation, and an increase in clear sky days.
The data gathered by M'Sila meteorological station (in situ data) was preferred. Unfortunately, this last one only has data from October of 2015 to date. To accomplish this study, these data are insufficient. That's why NASA's archived data was used.
A simulation is recommended to determine with precision the energy and economic performance of CSP or PV, as well as to determine whether CSP or PV technology is appropriate for M'Sila.
We were able to confirm that M'sila zone can be used to generate clean electricity as a result of this research. We encourage our government officials to keep working on this project by implementing effective solar power plants (PV or CSP).
|
BHI |
Beam horizontal irradiation (kWh/m2) |
|
DHI |
Diffuse horizontal irradiation (kWh/m2) |
|
DNI GHI |
Direct normal irradiation (kWh/m2) Global horizontal irradiation (kWh/m2) |
|
Gsc |
Solar constant (Gsc=1367 W/m2) |
|
H |
Daily total radiation received on terrestrial horizontal plane (MJ/m2) |
|
H0 |
Daily total radiation received by horizontal plane outside the Earth's atmosphere (MJ/m2) |
|
H HD KT |
Monthly average daily total irradiation (MJ/m2) Monthly average daily diffuse irradiation (MJ/m2) Daily clearness index |
|
Greek symbols |
|
|
n |
Day of the year (i.e., for January 1st, n=1) |
|
δ |
Declination angle (in degrees) |
|
f |
Site's latitude (in degrees) |
|
θz |
Solar zenith angle (in degrees) |
|
ωs |
Sunrise hour angle (in degrees) |
[1] Alamdari, P., Nematollahi, O., Alemrajabi, A.A. (2013). Solar energy potentials in Iran: A review. Renewable and Sustainable Energy Reviews, 21: 778-788. https://doi.org/10.1016/j.rser.2012.12.052
[2] Ghodbane, M., Benmenine, D., Khechekhouche, A., Boumeddane, B. (2020). Brief on solar concentrators: Differences and applications. Instrumentation, Mesures, Métrologies, 19(5): 371-378. https://doi.org/10.18280/i2m.190507
[3] Kyriakopoulos, G.L. (2021). Should low carbon energy technologies be envisaged in the context of sustainable energy systems? In Low Carbon Energy Technologies in Sustainable Energy Systems, 357-389. https://doi.org/10.1016/B978-0-12-822897-5.00015-8
[4] Kalogirou, S.A. (2004). Solar thermal collectors and applications. Progress in Energy and Combustion Science, 30(3): 231-295. https://doi.org/10.1016/j.pecs.2004.02.001
[5] Kousksou, T., Allouhi, A., Belattar, M., Jamil, A., El Rhafiki, T., Arid, A., Zeraouli, Y. (2015). Renewable energy potential and national policy directions for sustainable development in Morocco. Renewable and Sustainable Energy Reviews, 47: 46-57. https://doi.org/10.1016/j.rser.2015.02.056
[6] Kannan, N., Vakeesan, D. (2016). Solar energy for future world: -A review. Renewable and Sustainable Energy Reviews, 62: 1092-1105. https://doi.org/10.1016/j.rser.2016.05.022
[7] Seddegh, S., Wang, X., Henderson, A.D., Xing, Z. (2015). Solar domestic hot water systems using latent heat energy storage medium: A review. Renewable and Sustainable Energy Reviews, 49: 517-533. https://doi.org/10.1016/j.rser.2015.04.147
[8] Islam, M.T., Huda, N., Abdullah, A.B., Saidur, R. (2018). A comprehensive review of state-of-the-art concentrating solar power (CSP) technologies: Current status and research trends. Renewable and Sustainable Energy Reviews, 91: 987-1018. https://doi.org/10.1016/j.rser.2018.04.097
[9] Ellabban, O., Abu-Rub, H., Blaabjerg, F. (2014). Renewable energy resources: Current status, future prospects and their enabling technology. Renewable and Sustainable Energy Reviews, 39: 748-764. https://doi.org/10.1016/j.rser.2014.07.113
[10] Romero, M., González-Aguilar, J. (2014). Solar thermal CSP technology. Wiley Interdisciplinary Reviews: Energy and Environment, 3(1): 42-59. https://doi.org/10.1002/wene.79
[11] Al-Smairan, M.H., Alayyash, S.M., Shatnawi, R.S. (2019). Socio-economic effects of solar home systems in Jordan Badia – A case study in Rawthat Al-Bandan village. International Journal of Sustainable Development and Planning, 14(3): 191-201. https://doi.org/10.2495/SDP-V14-N3-191-201
[12] Zafar, S. (2017). Renewable energy in Algeria. Africa, Renewable Energy. http://www.ecomena.org/renewables-algeria, accessed in March 2020.
[13] Stambouli, A.B., Khiat, Z., Flazi, S., Kitamura, Y. (2012). A review on the renewable energy development in Algeria: Current perspective, energy scenario and sustainability issues. Renewable and Sustainable Energy Reviews, 16(7): 4445-4460. https://doi.org/10.1016/j.rser.2012.04.031
[14] https://power.larc.nasa.gov/data-access-viewer/, accessed on April 5, 2020.
[15] http://www.wilaya-msila.dz/index.php?action=formunik &type=menu&idformunik=19, accessed on April 5, 2020.
[16] Ihaddadene, N., Ihaddadene, R., Mostfaoui, M. (2019). Climate change in three different zones in Algeria. Journal of Earth Science & Climatic Change, 10.
[17] Kalogirou, S.A. (2014). Environmental Characteristics, Chapter 2, Solar Energy Engineering (Second Edition): Processes and Systems. Academic Press.
[18] Lee, H.J., Kim, S.Y., Yun, C.Y. (2017). Comparison of solar radiation models to estimate direct normal irradiance for Korea. Energies, 10(5): 594. https://doi.org/10.3390/en10050594
[19] Pérez-Higueras, P.J., Rodrigo, P., Fernández, E.F., Almonacid, F., Hontoria, L. (2012). A simplified method for estimating direct normal solar irradiation from global horizontal irradiation useful for CPV applications. Renewable and Sustainable Energy Reviews, 16(8): 5529-5534. https://doi.org/10.1016/j.rser.2012.05.041
[20] Dallacort, R., Ricieri, R.P., de Lima Silva, S., de Freitas, P.S.L., da Silva, F.F. (2004). Análises do comportamento de um actinógrafo bimetálico (R. Fuess-Berlin-Steglitz) em diferentes tipos de cobertura do céu. Acta Scientiarum. Agronomy, 26(4): 413-420. https://doi.org/10.4025/actasciagron.v26i4.1800
[21] Kuye, A., Jagtap, S.S. (1992). Analysis of solar radiation data for Port Harcourt, Nigeria. Solar Energy, 49(2): 139-145. https://doi.org/10.1016/0038-092X(92)90148-4
[22] Escobedo, J.F., Gomes, E.N., Oliveira, A.P., Soares, J. (2009). Modeling hourly and daily fractions of UV, PAR and NIR to global solar radiation under various sky conditions at Botucatu, Brazil. Applied Energy, 86(3): 299-309. https://doi.org/10.1016/j.apenergy.2008.04.013
[23] https://firstgreenconsulting.wordpress.com/2012/06/04/comparison-of-csp-technologies/comparison-of-csp-technologies/, accessed on April 5, 2020.
[24] Qazi, S. (2017). Solar thermal electricity and solar insolation. Standalone Photovoltaic (PV) Systems for Disaster Relief and Remote Areas, 203-237. https://doi.org/10.1016/B978-0-12-803022-6.00007-1
[25] Häberle, A., Krüger, D. (2021). Concentrating solar technologies for industrial process heat. In Concentrating Solar Power Technology, 659-675. https://doi.org/10.1016/B978-012-819970-1.00011-6
[26] El-din, A.H., Gabra, C.F., Ali, A.H. (2013). Effect of ambient temperature on performance of different types of PV cells at different location in Egypt. Solar Energy, 83: 604-624.