Matheus M.G. Rumbiak* | Akhmad Fauzi | Dedi B. Hakim | Lala M. Kolopaking
© 2021 IIETA. This article is published by IIETA and is licensed under the CC BY 4.0 license (http://creativecommons.org/licenses/by/4.0/).
OPEN ACCESS
The border area of Indonesia - Papua New Guinea is one of the border areas of Indonesia which has complex characteristics. Apart from differences in geographical conditions, this border region also has characteristics of customary territories that are not owned by other border areas in Indonesia. This complexity causes high variations in the performance of regional or district development in the RI-PNG border area. This study was conducted to evaluate the performance of sustainable regional development through the PROMETHEE (Preference Ranking Organization Methods for Enrichment Evaluation) method. The results of the analysis show that areas that tend to be open with access to other areas in Indonesia such as Merauke and Jayapura tend to have better performance than other border areas. These results can be used as lessons learned in sustainable regional development planning in other border areas.
border regions, PROMETHEE, performance of regional development
The Indonesia-Papua New Guinea border area covers five regions, namely Merauke Regency, Boven Digoel Regency, Bintang Mountains Regency, Keerom Regency and Jayapura City. Each of these five regions has the potential for rich natural resources and cultural potentials that have not been fully managed to improve welfare. In addition, the varied geographical conditions of the region and the low level of accessibility have made it difficult for some border areas in Papua Province to develop. As a result, development which is expected to accelerate economic growth, equitable distribution of income and improve the quality of human resources is very difficult to achieve in a short time.
As the leading region of a country, the border area of the Province of Papua - Papua New Guinea is part of the region that must receive development priorities and concentrate on future development in Indonesia. This is intended as an effort by the government to accelerate equitable development and make the Indonesia-Papua New Guinea border area a state showcase. However, in reality, the Papua-Papua New Guinea border area has not been fully functioned by the central government due to various political and security considerations.
There are four main problems that hinder development progress and cause the RI-PNG border area to become a relatively underdeveloped or slow-developing area so that not all border areas in Papua and Papua New Guinea receive government attention.
First, poor governance and corruption have caused development failures, especially poverty alleviation programs for most border communities, especially indigenous Papuans who live along the border between the two countries.
Second, the political-security condition which is relatively unstable due to disturbances from the National Liberation Army/Free Papua Organization (TPN-OPM) West Papua which is still volatile and makes the border area a military base for guerrillas and attacks against military personnel (Indonesia Military/Indonesia Police) on duty at border posts.
Third, illegal cross-border trade transactions such as marijuana sales originating from neighboring countries, especially from PNG and increasingly occurring using unofficial entrances, either by road or by sea to Indonesian territory (Papua).
Fourth, the similarity of culture and customs increasingly blurs the territorial boundaries of the country, so that there is an opportunity for conflicts over natural resources and land (ulayat land) between indigenous peoples in the territory of Indonesia and indigenous peoples in the territory of neighboring countries.
Based on the four problems above, the central government has attempted to take preventive measures by conducting policy interventions to develop several border areas (districts) as entry points and gateways in encouraging accelerated development, for example the development of road infrastructure for smooth access to transportation, economic transactions and trade. for local cross-border communities, such as at the integrated cross-border post (PLBN) in Skouw District (Jayapura City) and in Sota District (Merauke District).
This study proves the similarity in several research findings in India and the Greater Mekong Subregion that the development of cross-border road infrastructure has a positive effect on the regional economy as well as increasing individual incomes. Promethee is used as an analytical tool to determine the ranking order of alternative choices based on criteria. The results show that there are differences in development performance in Merauke Regency and Jayapura City with other border areas. Differences in performance may occur due to conditions with different regional characteristics, both physically, socio-economically and politically-territorial security.
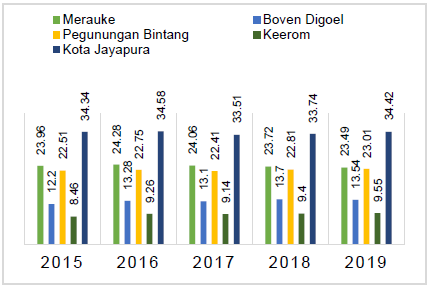
Poverty and inter-regional concern are the main problems in Papua, including in the border areas. Indonesia's 2015-2019 statistical data shows the number of poor people on the RI-PNG border area [1], which can be seen in Figure 1 below:
Figure 1. Number of Poor Population (thousand) in Border Area of RI-PNG 2015 – 2019
Figure 1 above shows that although Jayapura City and Merauke Regency are developed and developing regions, the highest number of poor people is still found in these two areas, namely Jayapura City with 43.42 million people, followed by Merauke Regency, with 23.49 (2019). Another data that shows the development of border areas in Papua is the human development index. Data on the development of the 2015-2019 human development index (HDI) can be seen in Figure 2 below:
Figure 2. Human development index (HDI) in border area of RI-PNG 2015 – 2019
Figure 2 above shows that the highest HDI in 2015 were Jayapura City (78.05) and Merauke Regency (67.75). Meanwhile, the lowest HDI is the Pegunungan Bintang Regency (40.91). In 2019 there was an increase in HDI, where Jayapura City still ranked at the top (80.16), and Merauke Regency (69.68), while the Pegunungan Bintang Regency was still at the lowest rank, with an HDI of 45.21. This shows that there has been a significant development in the quality of human resources in the past five years.
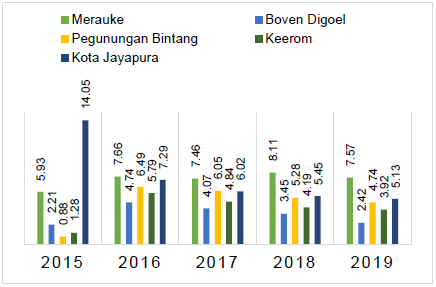
Other data that also shows regional developments is the growth rate of gross regional domestic product (GDP) in 2015-2019 on the basis of constant prices (2000), which can be seen in Figure 3 below:
Figure 3. Growth rate of gross regional domestic product (thousand) at constant market prices in border area of RI-PNG 2015 – 2019
Socio-economically, the RI-PNG border area shows progress in development, but one of the obstacles that also hinders its development is that the function of the border area is often used as a military operation area and a hiding area for economic rent hunters to carry out trade transactions illegally, so that not for the welfare and prosperity of the local community, especially residents who live in leading villages that directly border neighboring countries.
The purpose of this study is to evaluate the development performance of the RI-PNG border area and determine its priority areas for development, especially underdeveloped border areas (Pegunungan Bintang Regency, Boven Digoel Regency and Keerom Regency) using a comparison scenario in 2007, 2019 and 2024 based on deliberately selected sustainability criteria.
The structure of this research includes: (1) Introduction; (2) Literature Review; (3) Characteristics of Study Areas; (4) Method of Analysis; and (5) Result and Discussion.
2.1 Regional development concept
The emergence of big cities in the world as core regions that provide service facilities, industry and trade, as well as centers of government has proven the truth of this theory. Until now, some developing countries still apply this theory, even though it has been abandoned by some developed countries, as it is considered as the causes a lot of imbalance between growth centers and regions behind it [2].
The phenomenon of the backwash effect, urbanization and migration, is clear evidence of the result of the application of the growth center theory that does not consider the aspects of equity and sustainability. The concentration of economic activities and urbanization of the population to big cities, and the formation of new markets and growth centers have an effect, this is due to the spatial interactions that occur in the dimensions of regional economic development [3].
According to the neoclassical growth theory which is based on the Solow-Swan model theory which emphasizes the importance of capital and labor as sources of growth. However, the Solow-Swan theory has a weakness in responding to the role of technology as a source of growth. To answer this weakness, Romer and Lucas with the theory of endogenous growth emphasized the role of research and technology that drives economic growth and national development.
Currently, culture is one of the development assets that can encourage increased income. David Trosby identifies economic-culture as capital and value in development, for example artifacts and intangible objects as an economic value that can be raised as a source of economic income for the community [4]. Thus, the rich culture of Papua can be utilized and managed to improve the welfare of the community. Therefore, local governments do not only focus on infrastructure development but can raise cultural values to develop Papuans in achieving sustainable development goals through strengthening customary institutions at the rural level. The countryside is not only a power source of food, but also a strength of local social and economic resources whose role can not be ignored.
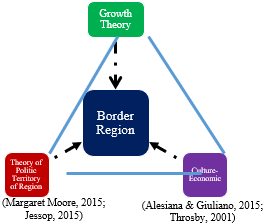
Figure 4 showed that the development of border areas is also inseparable from various conflicts of interest, so that collaboration in border governance is needed using the growth theory approach [2], political theory of territory by Moore [5], and economic-cultural theory by Throsby [4] and Alesiana and Giuliano [6]. Them argumentation used to solve development problems in the RI-PNG border areas.
Figure 4. Border development concept
In the development of the RI-PNG border area, there are several studies that become lessons about how policy makers can develop an area to achieve a development target for the progress of its border areas. The following describes examples of empirical studies in several countries that discuss national borders and the importance of cross-border cooperation in several sectors that can be used as lessons learned in the development of border areas in the Papua-Papua New Guinea Province.
Studies that discuss borders and the importance of cross-border cooperation in several sectors in various countries can be used as lessons in the development of border areas in the Papua-Papua New Guinea Province. One of those studies is the research on the impact of cross-border road infrastructure on foreign trade and investment in the Greater Mekong Subregion using the gravity model approach. It shows that the development of cross-border road infrastructure has a positive effect on intra-regional trade with the main commodity elasticity around 0.6-1.4 [7].
Another finding is the two-way causality relationship between transportation infrastructure (road and rail) to economic growth in India. This finding shows that if the economy grows, individual income will also increase and the share of income can contribute to gross domestic capital formation. This study reveals that a suitable transportation policy must be maintained to improve transportation infrastructure and lead to sustainable economic growth in India [8]. Other studies are Cross-border interactions in Portugal and Spain [9]. Research on the importance of public transportation as a vehicle for mobility to tourism in the Alps is unique to tourists [10]. Research on cross-border entrepreneurial development opportunities on Polish territory [11].
Further studies related to the discussion are sustainable development research on the Polish territory, which requires a strategic program of development for the future with a multi-functional concept in the development of a monitoring system and increasing the level of economic competitiveness in the boundary areas in the medium-term prospects [12].
Research on cross-border cooperation, for example, on the management of transboundary water resources in a sustainable manner to achieve sustainable development goals with an integrated water resources management approach on a regional scale in Malawi, Africa [13].
Research on hot spring management requires collaboration as an important step for transboundary groundwater management [14], research on spatial environmental governance, in the Lake Constance region [15]. Research on transboundary development cooperation in the Baltic sea-EU region [16].
Research in the development of the agricultural sector, for example research related to non-agricultural entrepreneurship in Papua New Guinea [17]. Cross-border connected learning in a pilot agricultural pilot project study in northern Syria involving universities and private institutions as sources of knowledge and skills for industry and agriculture [18]. And a study in the industrial sector related to the dismantling of construction waste that crosses national borders between Italy and Switzerland [19].
2.2 Sustainable development
Sustainable development is a strategy of utilizing natural ecosystems in such a way that their functional capacity to receive benefits for human life is not damaged [20]. Smith defines environmentally sustainable development as development that minimizes the use of resources and increases the entrophy of the earth [20]. While the World Commission on Environmental Development (1987) defines the concept of sustainable development as development to meet the needs of the present without compromising the ability of future generations to meet their needs [20].
Sustainability of development is seen in three dimensions of sustainability as stated by Sarageldin as "a triangular framework" namely economic, social and ecological sustainability. Spangenberg added an institutional dimension as the fourth dimension of sustainability, so that this dimension forms a sustainability prism [20].
And according to Vogelpohi and Aggestan [21], institutional dimensions is one of the impoertant dimensions in a sustainable development (Figure 5). This dimension is seen as part that must be considered as an integral representation of sustainable economic, social, and environment objective in institutional arrangement.
Figure 5 Dimension of sustainable prism
2.3 PROMETHEE method
The PROMETHEE method is used in analyzing border areas because the need for this analysis is to evaluate which border areas show the best development performance based on sustainability criteria.
This method was first developed by Brans in 1985 [22]. PROMETHEE is one of the analytical methods used to evaluate alternatives with given criteria and rank final decisions and some interesting PROMETHEE applications.
Several studies using the PROMETHEE method are the development of sustainable gas fields in East Natuna, Indonesia [22], the determination of the location of dry ports in Southern Thailand [23], evaluation of automation in automotive technology [24], and the development of tourism competitiveness [25]. In the PROMETHEE method, measures are first compared in pairs against each criterion according to the preference of the decision maker, producing a local score. These local scores are then combined into global scores for partial rankings on PROMETHEE I, and for full rankings on PROMETHEE II [26]. PROMETHEE is built on the basic notation, with a set A of alternatives that must be ranked, and K criteria that must be optimised:
$\mathrm{A}=\left\{a_{1}, a_{2}, \ldots, a_{3}\right\}$ a set of discrete alternatives, scenarios, actions, techniques a1, (lϵL)
$\mathrm{F}=\left\{f_{1}, f_{2}, \ldots, f_{3}\right\}$ a set of criteria relevant for decision fk, (kϵK)
$f_{k}\left(a_{i}\right)$ indicates the evaluation of the alternative al with respect to criterion fk. All these elements form a (LxK) matrix D, called evaluation matrix.
The method is based on the introduction, for each criterion, of a preference function Pk, giving the preference of the decision maker for an action a with regard to b. Its value is between 0 and 1, within the same defined criterion. The smaller the function is, the greater is the indifference of the decision maker; the closer to one, the greater his preference. In case of strict preference, the preference function is 1. A preference function, Pk(a, b) is usually expressed by a function p(d) such that:
$\forall \mathrm{a}, \mathrm{b} \in \mathrm{A} P_{k}(a, b)=\mathrm{p}\left(d_{k},\right)$ (1)
$d_{k}=f_{k}(\mathrm{a})-f_{k}(b)$ (2)
$0 \leq P_{k}(a, b) \leq 1$ (3)
Using a preference index Π (a, b) we can determine the preference for a with regard to b over all criteria:
$\Pi(a, b)=\sum_{k}^{K} w_{k} P_{k}(a, b)$ (4)
A valued outranking graph consisting of nodes are represented by actions and arcs, where each arc (a, b) has a value Π(a, b). When obtained, the valued outranking graph offers a decision-maker means for determining a partial preorder (PROMETHEE I), or a total preorder (PROMETHEE II) (Brans and Mareschal, 2002 in [26]).
In order to rank the actions by a partial preorder, we must evaluate the outgoing flow:
$\Phi^{+}(a)=\sum_{x \in L} \Pi($ a) $\mathrm{P}(\mathrm{a}, \mathrm{x})$ (5)
And the incoming flow.
$\Phi^{-}(a)=\sum_{x \in L} \Pi($ a $) \mathrm{P}(\mathrm{a}, \mathrm{x})$ (6)
The outgoing flow $\Phi^{+}(\mathrm{a})$ describes the degree to which a dominates the other actions in L, while the incoming flow $\Phi^{-}(\mathrm{a})$ represents the degree to which a is dominated. Selisih antara nilai dan nilai ini kemudian dihitung sebagai net flow atau $\Phi(a)=\Phi^{+}(a)-\Phi^{-}(a)$ [26].
In PROMETHEE, there are six possible preference functions that can be used to determine an alternative option, namely: type I Usual Criteria), Type II Quasi-Criteria (U Shape), Type III V-Shape, Type IV Step Function, Type V Linear and Type VI Gaussian [26].
For preference selection, if option "a" dominates "b", then π (b, a) = 0, but not necessarily the same as 1. The preference index between options a relative to b can be defined as the weighted average of the preference function for six different criteria and mathematically it can be written in the following equation [26]:
$\pi(a, b)=\frac{\sum_{i}^{k} w_{i} P(a, b)}{\sum_{i} W_{t}}$ (7)
P (i) (a, b) is defined as the preference function of option a over option b for the ith type criterion. This preference function has a value between 0, which means there is no difference between a and b to 1, which indicates a significant difference between option a and option b [26].
In geographic and political nomenclature, New Guinea refers to the entire island, which is the largest tropical island, about 2,700 kilometers long and 900 kilometers wide. On this island there are also more than 1,200 language groups, and the most in the world. Papua has 250 languages and there are 800 language in PNG. Territorially, the length of the boundary line between the Provinces of Papua (RI) and Papua New Guinea is approximately 830 km [27].
Based on the regional typology, Merauke Regency is a coastal area and is located at an altitude of 4 meters to 60 meters above sea level (masl), Boven Digoel Regency at an altitude of 19 meters to 125 meters above sea level. Pegunungan Bintang Regency at an altitude ranging from 1,400 meters above sea level, Keerom Regency at an altitude of 0 meters to 2,000 meters above sea level and Jayapura City at an altitude of 0 meters to 200 meters above sea level. The Table 1 show about regional charateristic, number of districs and number of villages in RI-PNG border are.
Table 1. Regional characteristic
|
Regency/City |
An area (Km²) |
Number of Districts |
Number of Villages |
|
Merauke |
43,240.95 |
20 |
176 |
|
Boven Digoel |
27,880.73 |
20 |
105 |
|
Peg. Bintang |
16,043.91 |
34 |
227 |
|
Keerom |
8,767.58 |
12 |
91 |
|
Jayapura City |
786.18 |
5 |
16 |
Papua is the western part of the large island of New Guinea. Its area is 416,129 km² and supports the most ancient and extant tropical forest in Asia Pacific. Papua, which is dominated by the central mountain range, produces high rainfall, which flows northward, into the interior of the vast Mamberamo River and southwards towards the widening triangular alluvial plain, when it reaches eastward to the border of Papua New Guinea [27].
The Papuan population consists of several ethnicities, both local and immigrant ethnicities. The indigenous Papuans come from Melanesian ethnicity and are the same as the PNG population. Meanwhile, the migrant population comes from the Malay ethnicity (Batak, Javanese, Makassar, Bugis, Sundanese, Kalimantan, Toraja). The ethnic migrants who are similar to native Papuans are Ambon, Kupang and Ternate.
The population of Papua has continued to increase due to the entry of migrant populations to Papua since the enactment of Special Autonomy. According to data from the Central Statistics Agency for 2019, the total population of Papua currently reaches 3,600.
The RI-PNG border area has potential natural resources such as minerals and potential timber forest products. These potentials have not been managed optimally, because accessibility to potential locations is still very limited. However, there are still many illegal thefts of forest products and mineral resources. Many illegal miners take advantage of the lack of access to roads and means of transportation to carry out these activities illegally. Data from the Papua Province Mining and Energy Office, 2005, that there are several metal and non-metallic mineral potentials in several border districts, as shown in Table 2.
Table 2. Potential of metallic minerals in the RI-PNG border area
|
Regency/City |
Border District |
Potential of Minerals |
|
Marauke |
- |
- |
|
Boven Digoel |
Jair |
Gold dan Silver |
|
Mindiptana |
Copper, Plumbum, Zeng |
|
|
Pegunungan Bintang |
|
Gold |
|
Keerom |
Web |
Gold and Silver |
|
Arso |
Coal and Chrom |
|
|
Waris |
Copper, Plumbum |
|
|
Jayapura City |
|
Gold |
The potential above has not been processed optimally to improve the welfare of the community. The gold mine that is currently being exploited is located in Penunungan Bintang Regency. The mining company operating in Penunungan Bintang Regency is Aneka Tambang Co.Ltd , with a mining area of 3,200 ha.
Likewise with cross-border economic conditions. Economic activities across borders between the territory of Indonesia and Papua New Guinea (PNG) can be divided into 2 (two) groups based on the position of each priority location towards the border line. Most of Papua, which has direct access to the PNG border area, has quite intensive and varied cross-border economic interactions.
As explained in the introduction, the developed and developing RI-PNG border areas are areas that have open access to both transportation and cross-border trade. More clearly can be seen in Table 3.
Table 3. Accessibility of border area RI-PNG
|
Regency/Munipacility |
Accessibility |
||
|
Land |
Sea |
Air |
|
|
Merauke (A1) |
√ |
√ |
√ |
|
Boven Digoel (A2) |
√ |
- |
√ |
|
Pegunungan Bintang (A3) |
- |
- |
√ |
|
Keerom (A4) |
√ |
- |
- |
|
Jayapura City (A5) |
√ |
√ |
√ |
In general, each border area in Papua Province has had access from the capital to the border districts, however, for access through smooth land transportation for cross-border trade only Merauke Regency and Jayapura City. This is possible because these two regions have seaports and airports that facilitate flights from outside Papua to the region, and the road network to the PNG area is quite good.
Especially for the Pegunungan Bintang Regency, it can only be accessed using air transportation, due to difficult topographical conditions causing access by road to still very limited. In contrast to the regencies of Boven Digoel and Keerom, although they cannot be accessed by sea, these two areas have road access from the center of the capital to several border districts.
4.1 Definition of alternative
Alternative (A) is an autonomous region in the border area of the Papua (Indonesia) - Papua New Guinea Province designated by the central government as the National Strategic Activities Center (NSCA) and not the National Strategic Activity Center. There are three areas that become NSAC, including Merauke Regency (A1), Boven Digoel Regency (A2) and Jayapura City (A5). Meanwhile, autonomous regions that are not included in NSAC are Pegunungan Bintang Regency (A3) and Keerom Regency.
The National Strategic Activity Center is an urban area designated to encourage the development of its border areas. While a non NSAC area is a buffer area that supports the core area (NSAC).
4.2 Weigthing of criteria
The criteria used in this study are based on indicators issued by the Indonesian Central Bureau of Statistics (ICBS). The criteria are categorized into five categories. And these are socio-demografy, economic, infrastructure, and environment categories. Furthermore, based on the above categories, the criteria for each category were identified. Determination of weight based on the assessment of each question on each criterion using a questionnaire. There are 20 questions for each sub-criteria and respondents determine the score using a Likert scale (1 = very unimportant; 2 = not important; 3 = quite important; 4 = important; 5 = very important). The results of each respondent were calculated using a weighted average.
The Table 4 is a results of determing the weight base on assessment of each sub-criteria, the following weights are obtained:
Table 4. The results of determining the weight base on base line 2007 and 2019
|
Code |
Criteria |
Weight 2007 |
Weight 2019 |
|
Sosio-demografy(C1) |
|
|
|
|
C11 |
Number of Papoulation (POP) |
0.06 |
0.05 |
|
C12 |
Percentace of Poor Population (POV) |
0.06 |
0.05 |
|
C13 |
Human Deleopmen Index(HDI) |
0.05 |
0.05 |
|
C14 |
Labour force participation rate (LFPR)) |
0.06 |
0.05 |
|
C15 |
Open Employee Rate (OER) |
0.05 |
0.05 |
|
Economy (C2) |
|||
|
C21 |
Number of Bank available(BANK) |
0.04 |
0.04 |
|
C22 |
Number of village unit cooperatives available (COOP) |
0.05 |
0.05 |
|
C23 |
The number of small and medium industries is growing (SMS’s) |
0.05 |
0.04 |
|
C24 |
Adjusted real per Capita Expenditure (CAP_EXP)) |
0.05 |
0.04 |
|
Infrastructure (C3) |
|||
|
C31 |
Community Health Center (CHC) |
0.05 |
0.04 |
|
C33 |
The length of roads built by the district government (Gov_Road) |
0.05 |
0.05 |
|
C34 |
Quality of available ITC networks(ITC) |
0.04 |
0.04 |
|
C35 |
Percentage of households using piped drinking water (DW) |
0.05 |
0.05 |
|
Governance (C4) |
|||
|
C41 |
Good Governance (GG) |
0.05 |
0.04 |
|
C42 |
Number of criminal cases reported to the police (CRIME) |
0.05 |
0.05 |
|
C43 |
Regional security conditions (Sequrity) |
0.05 |
0.04 |
|
C44 |
Number of Doctor Available |
0.04 |
0.03 |
|
Environmental (C5) |
|||
|
C51 |
Percentage of houshold by resourse ligthing State Electricity Company (PLN Electric) |
0.04 |
0.05 |
|
C52 |
Percentage of households using proper sanitation from a septic tank (ST) |
0.06 |
0.05 |
|
C53 |
Potential air pollution from motor vehicle fumes (POLUTION) |
0.06 |
0.05 |
5.1 Results simulation base on weighting (first scenario)
According to the PROMETHEE tool, which categorizes partial rank as (PROMETHEE I) and complete rank as (PROMETHEE II), it is obtained that the best choice is Alternative 1 (see figure and Table 5), followed sequentially by Alternatives 5, 3, 4 and 2. Next, Alternative 1 outperforms the other four alternatives because of preferences for economic, social, technological, and governance aspects. These findings reveal that Merauke Regency and Jayapura City is more developed than other border areas.
Table 5. Value of phi, phi+ and phi- for first scenario
|
Rank |
Alternatives |
Phi |
Phi+ |
Phi- |
|
1 |
Merauke (A1) |
0.3504 |
0.6568 |
0.3064 |
|
2 |
Jayapura city (A5) |
0.3465 |
0.6733 |
0.3267 |
|
3 |
Keerom (A4) |
-0.0611 |
0.4260 |
0.4871 |
|
4 |
Boven Digoel (A2) |
-0.2274 |
0.3325 |
0.5899 |
|
5 |
Peg. Bintang (A3) |
-0.3784 |
0.2734 |
0.6518 |
The results of the comparison scenario using data from 2007, 2019 and 2024 show that although there are changes in the data on several maximum and minimum criteria values (POP, HDI, LPFR, etc.) due to regional developments, the facts show that Merauke Regency and Jayapura City are border areas that construction performance is very good. So it can be concluded that Merauke Regency (A1) and Jayapura City (A5) are the best alternatives. This means that although other border areas experience social, economic, infrastructure, governance and ecological development, Merauke Regency and Jayapura City remain in the top position.
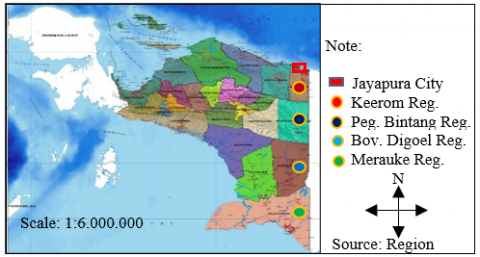
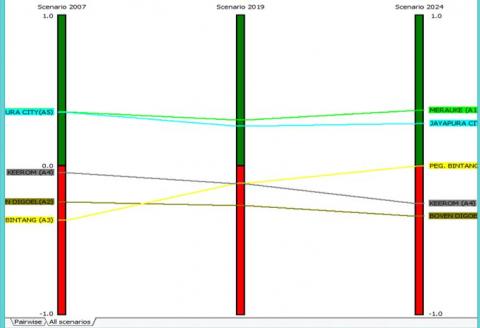
More clearly, a comparison of the scenarios for ranking development performance in the five border areas in Papua can be seen in Figure 6.
In Figure 7, it can be seen that in 2007, the data showed that Merauke Regency and Jayapura City were in the top position (phi +). Then in 2019, there was a change in position, where at the beginning of 2007 the Bintang Mountains Regency was in the last position, experiencing a shift to the third position in the 2019 and 2024 scenarios. This was caused by several significant changes in the criteria values and weight, namely POV, HDI, LFPR. Changes in the criteria values occurred due to a decrease in the number of poor people, an increase in HDI, an increase in the labor force participation rate from 2007 to 2019. This means that for approximately twelve years there has been a very significant regional development. The development of this region also has an impact on changes in several socio-demographic, economic, infrastructure, governance and environmental indicators.
Figure 6. Map of study area
Note: Merauke (Green Color); Jayapura City (Blue Color); Peg. Bintang (Yellow Color); Keerom (Grey Color); Boven Digoel (Brown Color)
Figure 7. Ranking of comparative scenario 2007, 2019, 2024
The indications in Figure 6 above show that lagging border areas such as Boven Digoel Regency, Pegunungan Bintang Regency, and Keerom Regency have the potential to develop into developed regions such as Merauke Regency and Jayapura City. This can be seen from several criteria values when a scenario changes, automatically the position of these regions will also change to the top ranking. This condition can occur if each stage of development requires planning in determining the targets and targets to be achieved for each indicator or criterion in one year of development planning.
In the context of sustainable development, the sub-criteria that meet the sustainability requirements with minimum preference are reduction in the number of poor people (POV), reduction in the open unemployment rate (OER), air pollution due to the increase in the number of motorized vehicles (POLUTION) and reduction in carbon emissions due to energy use. PLN's power plants are sourced from diesel engines (PLN Electric). Meanwhile, the sub-criteria for sustainability with maximum preference are population size, GRDP growth rate based on constant prices (2000), growing number of SMEs, increasing real EXPENDITURE per CAPITA per year, increasing clean water facilities (WATER), and improving proper sanitation (SANITATION).
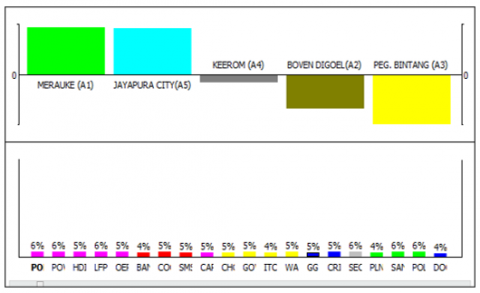
Promethee analysis using scenario 1 (2007) is the base year to determine the development of each region before the comparison scenario is carried out. The weighting data in Figure 8 below shows the initial weight based on the average respondent's assessment is still in a state that has not changed (fixed).
Figure 8. Walking weight on base line 2007
Based on the figure above, it can be seen that Merauke Regency and Jayapura City are in a positive position (phi +), while Keerom Regency, Boven Digoel Regency and Pegunungan Bintang Regency are under the zero line or negative position (phi-). This means that Keerom Regency, Boven Digoel Regency and Bitang Mountains Regency are underdeveloped border areas. This happens because the input data shows that there has been no change in the weight and value of the criteria for each category or indicator.
5.2 Scenario 2 (2019)
Pomethee II analysis in the second scenario (2019) shows that there is a change in the ranking of alternative choices as shown in the following Table 6.
Table 6. Value of phi, phi+ and phi- for second scenario
|
Rank |
Alternatives |
Phi |
Phi+ |
Phi- |
|
1 |
Merauke (A1) |
0.3049 |
0.6099 |
0.3049 |
|
2 |
Jayapura city (A5) |
0.2940 |
0.6264 |
0.3324 |
|
3 |
Peg. Bintang (A3) |
-0.0247 |
0.4478 |
0.4725 |
|
4 |
Keerom (A4) |
-0.2225 |
0.3352 |
0.5777 |
|
5 |
Boven Digoel (A2) |
-0.3516 |
0.2747 |
0.6264 |
In the analysis of scenario two, there is a change in all indicator values, so that there will be a change in position, especially the three lagging border areas. The results of the scenario show that if several criteria are selected and values are changed according to statistical data (BPS, 2020), then the Bintang Mountains Regency (yellow block) is in third position. This shows that there is a change in position because some of the criteria values have increased in number. For example, the sub-criteria for the percentage of poor people (POV, HDI, TPAK, and WATER).
5.3 Scenario 3 (2024)
Scenario 3 is a projected border area development in 2024, namely changing several sub-criteria values which are assumed to have a significant influence on regional development. For example, for the Bintang Mountains Regency, the sub-criteria values are changed, including: HDI (HDI) from 45.21 to 56.00 (2024), District Road Improvement (ROAD_GOV) from 0 km (2019) to 1.5 km (2024). ), an increase in the number of cooperatives (COOP) from 1 unit (2019) to 5 units (2024), an increase in the total annual per capita expenditure (Cap Expenditure) from 0.78 USD (2019) to 0.79 USD (2024), and an increase in security stability (SECURITY) from high (high) to very high (2024). While the weights are assumed to remain the same as in the second scenario.
Based on the change in the sub-criteria value, the results of the PROMETHEE II analysis for the third scenario (2024) are obtained as follows (Table 7):
Table 7. Value of phi, phi+ and phi- for third scenario
|
Rank |
Alternatives |
Phi |
Phi+ |
Phi- |
|
1 |
Merauke (A1) |
0.3269 |
0.6099 |
0.2830 |
|
2 |
Jayapura city (A5) |
0.2390 |
0.5824 |
0.3434 |
|
3 |
Peg. Bintang (A3) |
0,0082 |
0.4698 |
0.4615 |
|
4 |
Keerom (A4) |
-0.2445 |
0.3132 |
0.5577 |
|
5 |
Boven Digoel (A2) |
-0.3297 |
0.2747 |
0.6044 |
The results of Promethee's analysis show that there is a change in the ranking of the position of the border areas which are classified as underdeveloped into developed regions. This scenario was made with the intention of designing a policy to overcome the problem of inequality between regions and reduce the number of poor people as one of the development targets as stated in the strategic plan or Regional Medium Term Development Plan (RPJMD) of each border area.
Based on the three scenarios above (007, 2019 and 2024) the development performance of Merauke Regency and Jayapura City are the best compared to the other border areas. However, in certain indicators, there was a change in the ranking of positions outside Merauke Regency (A1) and Jayapura City (A5). For example, in scenario 2 (2019), the positions of the Bintang Mountains Regency (A3) and Keerom Regency (A4) are in third place, with almost the same Phi value. Boven Digoel Regency (A2) is in the lowest ranking position.
In scenario 3 (2024), when certain criteria values are changed, the position of the Bintang Mountains Regency (A3) is in third place. The fourth rank is Keerom Regency (A4) and the lowest rank is Boven Digoel Regency (A2).
Pegunungan Bintang Regency, Keerom Regency and Boven Digoel Regency are border areas that are classified as slow to develop. This is due to the lack of accessibility and connectivity to these areas. The condition of the road is not good and it is an isolated area so that transportation access is also very limited. These areas are also areas prone to armed conflict between the National Liberation Army/Free Papua Organization-West Papua and the Indonesian National Army/Police of the Republic of Indonesia. Frequent security disturbances in these areas cause these areas to be very closed. However, in recent years, security conditions have improved due to the presence of border security patrols that are carried out routinely by the Indonesian National Armed Forces/Republic of Indonesia Police officers who are assigned to border posts.
Based on the comparative analysis of the scenarios above, the border areas that are the priority for development are the Bintang Mountains Regency, Keerom Regency and Boven Digoel Regency. To develop the region in the context of sustainable development, the indicators and criteria for sustainability that need to be considered by the government for further policy intervention are criteria that contribute negatively to regional development performance. The hope of this research is that after the government intervenes in policy on some of these indicators, there will be a change in the ranking of border areas that are classified as underdeveloped areas.
Poor governance is also a problem in border areas. This indication can be seen from the number of identity cards that are not entirely owned by every citizen in Indonesia. The results of the field survey show that in general Indonesian citizens at the RI-PNG border, for example in Moso Village, Muara Tami District, Jayapura City do not have identity cards.
Beside that, from the security aspect, this area is the most vulnerable to security disturbances conducated by the Papuan freedom fighters group. Many cases of shootings taking place in this area are carried out by armed groups or better known as the National Liberation Army/Free Papua Organization (TPN-PB/OPM), who fights the government as armed groups guerrilla in the wilderness of Papuan deep jungle.
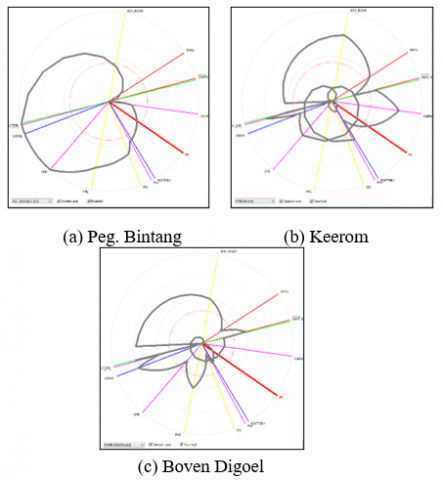
5.4 Radar diagram analysis for development priority areas with GAIA
The development priority areas in question are autonomous regions on the Papua - PNG border which are classified as underdeveloped areas. In this case, there are three border autonomous regions that are categorized as underdeveloped, namely Boven Digoel Regency, Pegunugan Bintang Regency, and Keerom Regency.
Analysis of the radar diagram in Figure 9 below, it can be explained that the circle that goes out from the center point (zero point) shows the better the criteria contribution (positive contribution), while the circle towards the zero point is the opposite [22].
Based on Figure 9, the positive contribution that needs to be considered for the development of underdeveloped border areas according to the 2019 scenario can be seen in the following Table 8.
Figure 9. Result of promethee radar diagram analysis
Table 8. Positive contribution by performance rank
|
Rank |
Regency/Munipacility |
Positive Contribution |
|
1 |
Merauke (A1) |
Goverment Road, SMS’s, Cooperatives, Community Health Center (CHC), Papulation, ITC, and PLN Electric |
|
2 |
Jayapura City (A5) |
Sanitation, Cooperatives, Capital Expenditure, Doctor, Population, and ITC. |
|
3 |
Pegunungan Bintang (A3) |
Polution, LFPR, Crime, OER, CHC, and ITC |
|
4 |
Keerom (A4) |
Gov_Road, SMS’s, Capital Expenditure, LFPR, and Doctor |
|
5 |
Boven Digoel (A2) |
Cooperatives, Gov_Road, LFPR, Crime and CHC |
Source: Promethee Analyzed [26]
Development priorities for underdeveloped border areas in the context of sustainable development must pay attention to criteria that contribute negatively to both the socio-demographic dimension, the economic dimension, the infrastructure dimension and the ecological dimension. In addition, the dimensions of customary institutions also need to be considered because one of the border problems is that the indigenous community has not played a role in managing the boundaries between the Republic of Indonesia and PNG.
The political dimension also needs to be taken into account by opening up space for dialogue between the National Liberation Army/Free Papuan Organization (TPN/OPM) group and the Indonesian National Army (TNI) officers so that the problem of national disintegration can be minimized and reduce armed conflict.
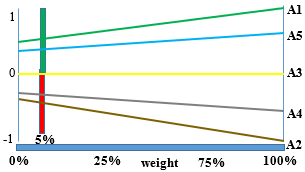
5.5 Sensivitas analysis
Sensitivity analysis was performed to examine the change in ranking, which resulted from the variation in the weights of the selected subcriteria [22]. Figure 10 shows that although a ranking change test has been carried out by shifting all sub-criteria in the software, it turns out that only the Percentage of Poor People (POV) sub-criteria sub-criteria do not change the position of the ranking chart. alternative for Merauke Regency (green line) and Jayapura City (blue line). This means that the two border areas remain above the zero point line, even though the POV sub-criteria have shifted from 6% to 100%.
Figure 10. Sensivitas analysis
Based on Figure 10 above, it can be seen that Merauke Regency is in the top position. This shows that even though it is a developing region, the poverty rate in this region is still quite high. The poverty alleviation program has not been able to be realized optimally, because the absorption of labor in the agricultural sector, industrial sector and service sector is not balanced. The largest absorption of manpower is in the service sector, while the demand for employment in the small and medium industry and large industries is very limited. The industries that are mostly developing in the border areas of Papua are small and medium industries.
The micro, small and medium industries that are growing in Jayapura City and Merauke are quite fast. However, for Keerom Regency, Boven Digoel Regency and Bintang Mountains District, it is very slow. This is because the level of innovation in the entrepreneur community is very low. The local population mostly depends on government assistance
The Indonesia-Papua New Guinea border region is one of the border areas in Indonesia that is unique and has the characteristics of an indigenous territory, so it is different from other borders in Indonesia. This region is also different in its development, where there are several areas that are relatively developed and developing, but there are some areas that are relatively left behind because they show different performance criteria for development.
Based on this study, the difference in the performance of the criteria shows that the border areas of Indonesia that are developing and advanced are border areas that tend to be open and have high accessibility and connectivity with border areas in other countries).
This study has evaluated the ranking of border areas based on criteria in the perspective of sustainable development, namely socio-demographic, economic, infrastructure and environmental criteria using 2007 and 2019 data as comparison data to determine changes in development progress. The results of the analysis show that there is a change in the ranking of underdeveloped regions into potential areas for progress and development if appropriate policy interventions are carried out against several criteria that are assumed to be able to improve development performance in a sustainable manner.
Whereas based on future projections on the development of border areas using the third scenario (2024) by changing several indicators, the results show that all border areas have the potential to become developed and developing regions.
The lesson learned that can be drawn from this research is that local governments, especially underdeveloped border areas, are making policy leaps by encouraging the criteria that gave negative contributions in this study to become positive contributions to being able to change the ranking position for the better.
The author’s gratitude goes to the Endowment Fund for Educatioan (IEFE/LPDP) of the Ministry of Finance of the Republic of Indonesia which has provided educational scholarships during the study and to the Papuan Provincial Government who has given permission during this research and has been completed according to schedule and the Provisional Government of Papua through educational scholarships so that this research can be carried out and completed properly. The author would like to express a deep thankfulness to Prof. Akhmad Fauzi, Ph.D, Dr. Dedi Budiman Hakim and Dr. Lala M. Kolopaking for their guidance, so that this article can be published as part of the author’s dissertation writing.
[1] Indonesia Statistic Agency, Papua in Figure 2015-2020. https: www.bps.papua.go.id.
[2] McCann, P. (2001). Urban dan Regional Economics. Oxford University Press Inc, New York. USA. First Published 2001.
[3] Adisasmita, R. (2008). Pengembangan Wilayah. Konsep dan Teori (Regional Development. Consepts and Theories). Graha Ilmu. Yogyakarta. Indonesia. First Pusblished. https://onesearch.id/Author/Home?author=Rahardjo+Adisasmita.
[4] Trosby, D. (2015). Economic and Culture. Cambridge University Press. USA.
[5] Moore, M. (2015). A Politic Theory of Territory. Published to Oxford Scholarship Online. http://0xford.universitypressscholarship.com.
[6] Alesina, A., Giuliano, P. (2015). Culture and Institution. Journal of Economic Literature, 53(4): 898-944. http://dx.doi.org/10.1257/jel.53.4.898
[7] Edmonds, C., Fujimura, M. (2006). Impact of cross-border road infrastructure on trade and investment in the Greater Mekong Subregion. Third LAEBA Annual Meeting Seoul, South Korea, pp. 1-17.
[8] Pradhan, P.R., Bagchi, P.T. (2013). Effect of transportation infrastructure on economic growth in India: The VECM approach. Res. Transp. Econ., 38(1): 139-148. https://doi.org/10.1016/j.retrec.2012.05.008
[9] Fontes, J.M., Ribeiro, A., Silva, J. (2014). Accessibility and local development: interaction between cross-border accessibility and local development in Portugal and Spain. Procedia - Soc. Behav. Sci., 111: 927-936. https://doi.org/10.1016/j.sbspro.2014.01.127
[10] Cavallaro, F., Dianin, A. (2020). Cross-border public transport as a driver for tourism in the Alps. Transp. Res. Procedia, 48(2): 2446-2461. https://doi.org/10.1016/j.trpro.2020.08.262
[11] Kurowska-Pysz, J. (2016). Opportunities for cross-border entrepreneurship development in a cluster model exemplified by the Polish-Czech border region. Sustain., 8(3): 230. https://doi.org/10.3390/su8030230
[12] Lewczuk, J., Ustinovichius, L. (2015). The concept of multi-functional development of cross-border regions: Poland case. Procedia Eng., 122: 65-70. https://doi.org/10.1016/j.proeng.2015.10.008
[13] Fraser, C.M., Kalin, R.M., Kanjaye, M., Uka, Z. (2020). A national border-based assessment of Malawi’s transboundary aquifer units: Towards achieving sustainable development goal 6.5.2. J. Hydrol. Reg. Stud., 31: 100726. https://doi.org/10.1016/j.ejrh.2020.100726
[14] Szocs, T., Rman, N., Rotár-Szalkai, Á., Tóth, G., Lapanje, A., Černák, R., Nádor, A. (2017). The upper pannonian thermal aquifer: Cross border cooperation as an essential step to transboundary groundwater management. J. Hydrol. Reg. Stud., 20: 128-144. https://doi.org/10.1016/j.ejrh.2018.02.004
[15] Scherera, R., Zumbuscha, K. (2011). Limits for successful cross-border governance of environmental (and spatial) development: The Lake Constance Region. Procedia - Soc. Behav. Sci., 14: 101-120. https://doi.org/10.1016/j.sbspro.2011.03.028
[16] Studzieniecki, T., Palmowski, T., Korneevets, V. (2015). The system of cross-border tourism in the polish-Russian borderland. Procedia Econ. Financ., 39: 545-552. https://doi.org/10.1016/S2212-5671(16)30298-2
[17] Schmidt, E., Mueller, V., Rosenbach, G. (2020). Rural households in Papua New Guinea afford better diets with income from small businesses. Food Policy, 97: 101964. https://doi.org/10.1016/j.foodpol.2020.101964
[18] Abdullateef, S., Parkinson, T., Sarmini, T. (2020). Cross border connected learning in northern Syria: An agricultural pilot study. J. Educ. Res. Open, 1: 100005. https://doi.org/10.1016/j.ijedro.2020.100005
[19] Borbon-Galvez, Y., Curi, S., Dallari, F., Ghiringhelli, G. (2021). International industrial symbiosis: Cross-border management of aggregates and construction and demolition waste between Italy and Switzerland. Sustain. Prod. Consum., 25: 312-324. https://doi.org/10.1016/j.spc.2020.09.004
[20] Rustiadi, E., Saifulhakim, S., Panuju, R.D. (2009). Perencanaan dan Pengembangan Wilayah (Regional Development and Planning). Yayasan Obor Indonesia. First Edition.
[21] Vogelpohl, T., Aggestam, P. (2011). Public policies as istitution for sustainability: potential of the concept and findings from assesing sustainable in the European forest-base sector. Eur J Forest Res., 131(1): 57-71. https://doi.org/10.1007/s10342-001-0504-6
[22] Batubara, M., Purwanto, W.W., Fauzi, A. (2016). Proposing a decision-making process for the development of sustainable oil and gas resources using the petroleum fund: A case study of the East Natuna gas field. Resour. Policy, 49: 372-384. https://doi.org/10.1016/j.resourpol.2016.07.010
[23] Komchornrit, K. (2017). The selection of dry port location by a hybrid CFA-MACBETH-PROMETHEE method: A case study of Southern Thailand. Asian J. Shipp. Logist., 33(3): 141-153. https://doi.org/10.1016/j.ajsl.2017.09.004
[24] Neb, A., Remling, D. (2019). Quantification and evaluation of automation concepts based on a multi-criteria decision analysis Procedia CIRP, 84: 624-629. https://doi.org/10.1016/j.procir.2019.04.321
[25] Lopes, F.P.A., Muñoz, M.M., Alarcón-Urbistondo, P. (2018). Regional tourism competitiveness using the PROMETHEE approach. Ann. Tour. Res., 73: 1-13. https://doi.org/10.1016/j.annals.2018.07.003
[26] Fauzi, Akhmad. (2019). Teknik Analisis Keberlanjutan (Sustainability Analysis Techniques). PT. Gramedia Pustaka Utama, Jakarta, Indonesia.
[27] Kartikasari, N.S., Marshall, J.A., Beehler, M.B. (ed) (2012). Ekologi Papua (Papua Ecologi). Yayasan Obor Indonesia Publihsed. Jakarta. Indonesia. http://opac.lib.ugm.ac.id/index.php?mod=book_detail&sub=BookDetail&act=view&typ=htmlext&buku_id=773841&obyek_id=1.