Zuhair Jaber Mushref* | Ameer Mohammed Khalaf | Salah Othman Abed Al-Ani
© 2021 IIETA. This article is published by IIETA and is licensed under the CC BY 4.0 license (http://creativecommons.org/licenses/by/4.0/).
OPEN ACCESS
The research aims to give an accurate perception of the role of modern technologies, represented by geographic information systems, in extracting data and information, and then building a geographical database for urban land uses in an Ana city to reach generalized models based on the source map with a scale of 1/5000 and then building generalized models through The application of digital generalization elements according to the different standards adopted in the research (1/10000, 1/25000, 1/50000, 1/100000) in order to reach the end to the best results in the cartographic production of these models in a way that facilitates the process of understanding and perception by finding The most appropriate way to represent this data on a map according For the functional importance of each of the uses through disposal to eliminate overlap between uses Depending on the generalization elements of selecting, deleting, simplifying, smoothing, coding and exaggeration, and finally, as The research showed that there is a difference in the areas, uses and preparation of methods when moving from one scale to another. the research concluded by building a three-dimensional model to simulate the natural process of generalizing digital cartography according to different scales.
digital layers, cartographic generalizations, Anah city
The digital map is one of the most important systems in completing the cartographic tasks in the computer environment by entering, processing and outputting data in a way that matches the cartographic presentation that helps the user to make a decision [1-3]. It is a graphical representation of the real world and is drawn with a scale smaller than its reality, and it cannot show all the details, especially when maps are reproduced with a smaller scale than larger scale maps, and therefore the process of designing maps requires processing the data that form the content of the map according to the nature Scale and purpose of creating the map This process is called cartographic generalization [4-6]. It is considered one of the important processes in making maps, as it is possible to create maps of a smaller scale and derive them from maps of a larger scale by adopting a group of treatments such as the process of selecting some features and deleting others from them, simplifying and smoothing the jagged lines, as well as highlighting some features from others according to their importance [7, 8].Therefore, the size of their symbols must be exaggerated or distinguished by colors that are an indication and indication of the importance of these features, On this basis, in this research, there are several forms to express the importance of using the land [9-12].
1. Is there a possibility of applying modern geographic technologies in building a spatial and descriptive database of urban land uses and then translating it into cartographic models?
2. Is it possible to prepare multi-scale digital generalization maps through deletions and simplifications of the secondary and less important features while preserving the most important features while changing the scale from large to small and eliminating swarming and interference between uses?
2.1 Research hypothesis
1. Modern technologies such as geographic information systems can be used to build a geospatial and descriptive database of urban land uses and represent them through cartographic models.
2. The possibility of conducting digital generalization processes represented by selection, deletion and simplification in proportion to the change of the map scale.
2.2 Research aims
The research aims to highlight the role of geographic technologies in preparing maps of urban land uses through the digital stratification system, and then build automatic models with various scales to determine the importance of cartographic representation for the generalization and digital coding of urban land uses at different scales.
2.3 Research methodology
The research relied on the inductive approach that aims to extrapolate things by revealing the interrelationships between geographical features, as well as the quantitative analysis approach in applying statistical methods and then modeling them into generalized multi-scale digital maps [11, 13-15].
2.4 Research limits
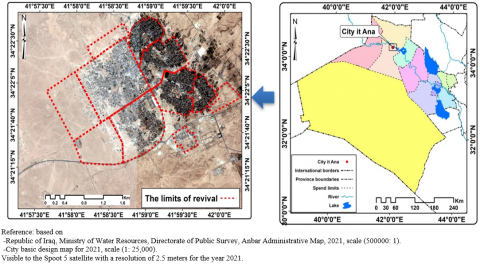
The research area is located within Al-Anbar Governorate, as shown in Figure 1. It is bounded on the north by Haditha Lake, on the south by (Baghdad-Al-Qaim) road, on the west by Wadi Al Qasr, and on the east by Wadi Al-Rayhana.
Figure 1. The location of Ana city
Urban, commercial, industrial, educational, health, religious, administrative, health, recreational, transportation methods, maps of urban land uses were prepared by drawing layers and giving the appropriate coding for each use, which distinguishes it from other uses, as shown in Figure 2 and Table 1.
Figure 2. The geographical distribution of the urban uses of Ana city for the year 2021
Table 1. Urban land use for Ana city for the year 2021
|
Uses |
Usage area in square meters Length of streets in meters |
|
|
Linear Use |
Transfer usage / number |
801 No. / 122486 A.D. |
|
Area use |
Residential use / m2 |
2297138 |
|
Commercial use / m2 |
76764 |
|
|
Industrial use / m2 |
88505 |
|
|
Instructional use / m2 |
346911 |
|
|
Sanitary use / m2 |
42193 |
|
|
Administrative use / m2 |
523628 |
|
|
Religious use / m2 |
214765 |
|
|
Recreational use / m2 |
369546 |
|
|
Reference: based on: Figure 2 |
||
The process of building maps using geographic information systems is more flexible than the manual method of cartography, and that is why these systems and their application programs have been relied upon to carry out the process of digital mapping for urban land uses (linear and cadastral) at the scales 1/5000, 1/10000 and 1/25000 1/50000 and 1/100000 scale for access to a miniature, high-visibility map.
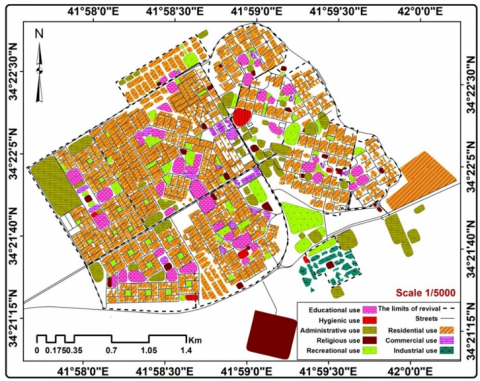
3.1 Digital mapping circular for urban land uses in Ana city according to the scale 1/5000
The digital cartographic generalization was carried out according to this scale and considered it the basis for the measures that were identified in the subject of the research, as the simplification and smoothing processes were applied without the selection and deletion processes, as this map represents the source map for the generalization process and as shown in Figure 3.
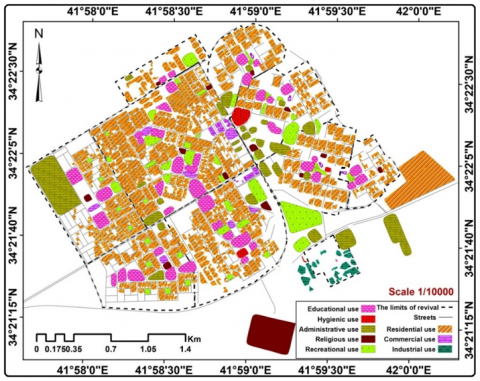
3.2 The digital mapping circular for urban land uses in Ana city according to the scale of 1/10000
The generalization process of digital mapping for urban land uses was carried out by relying on the equation (F. Topfer). in selecting unnecessary features on the basis of their importance, area and lengths on the map with a scale of 1/10000 to make the map less crowded, and then to perform the simplification and smoothing process. And the coding for other land uses that appeared in the map.
So the linear uses of the land represented by the streets became (801) streets after it was (566) streets in the source map, while the cadastral uses of the land decreased its areas from (3959450) square meters in the scale of 1/5000 to (2799753) square meters in the scale of 1/10000 generalized As shown in Table 2 and Figure 4.
Ac = As $\sqrt{\frac{S c}{S s}}$
Ac = the area of the features to be picked for removal in the target map (smaller scale).
As = the area or numbers of features to be picked for removal in the previous map (larger scale or source).
Sc = denominator of the scale fraction in the previous (source) map.
Ss = denominator of the target (grouped) map scale.
Table 2. Results The process of digital mapping of the urban land use of a city for the year 2021
|
Use |
Scale 1/5000 |
Scale 1/10000 |
|
Transfer usage / number |
801 |
566 |
|
Residential use / m2 |
2297138 |
1624322 |
|
Commercial use / m2 |
76764 |
54280 |
|
Industrial use / m2 |
88505 |
6,2582 |
|
Instructional use / m2 |
346911 |
245303 |
|
Sanitary use / m2 |
42193 |
29835 |
|
Administrative use / m2 |
523628 |
370261 |
|
Religious use / m2 |
214765 |
151862 |
|
Recreational use / m2 |
369546 |
261308 |
Figure 3. Digital mapping circular for urban land uses in Ana city for the year 2021, on a scale of 1/5000
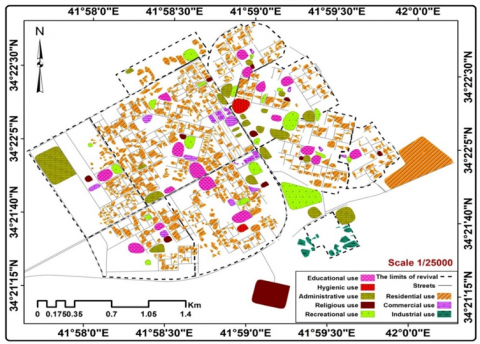
3.3 The digital mapping circular for urban land uses in Anah city according to the scale 1/25000
The results of the cartographic circular with a scale of 1/25000 showed that the linear land uses (streets) became (358) streets after they were (566) streets in the map with a scale of 1/10000, while the area of cadastral uses of all kinds reached (1770719) square meters after If it was (2799753) m2 in the scale 1/10000 by conducting the selection and removal operations of the landmarks according to their size and importance depending on the population density in the area, and then the simplification and smoothing and coding currencies were applied in this scale, Table 3 and Figure 5.
Table 3. The results of the digital mapping process for urban land uses for a city for the year 2021 between the scales 1/10000 and 1/25000
|
use |
Scale 1/1000 |
Scale 1/25000 |
|
Transfer usage / number |
566 |
358 |
|
Residential use / m2 |
1624322 |
1027311 |
|
Commercial use / m2 |
54280 |
34330 |
|
Industrial use / m2 |
6,2582 |
39580 |
|
Instructional use / m2 |
245303 |
155143 |
|
Sanitary use / m2 |
29835 |
18869 |
|
Administrative use / m2 |
370261 |
234174 |
|
Religious use / m2 |
151862 |
96046 |
|
Recreational use / m2 |
261308 |
165266 |
Figure 4. The digital mapping process for urban land uses for Anah for the year 2021 between the scales 1/5000 and 1/ 100000
Figure 5. The process of digital mapping for urban land use in Anah for the year 2021 between the scales 1/10000 and 1/25000
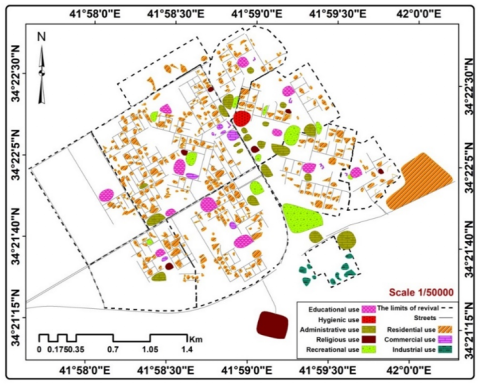
3.4 The digital mapping circular for urban land uses in Anah city according to the scale of 1/50000
The preparation of a map of the scale of 1/50000 was based on the previous mathematical equations that deal with and generalize the features of the patterns (linear and cadastral). Reducing the overcrowding of the uses, then applying the elements of simplification and smoothing, then the coding process, and finally applying the element of exaggeration to the healthy land uses to avoid eliminating this use due to the importance of the city population Through Table 4 and Figure 6, we find that the number of streets became (253) streets in the scale of 1/50000 after it was (358) streets in the scale of 1/25000, while the area of the area of the area became about (1252088) square meters in the scale of 1 / 50,000 after it was (1770719) m2 on the scale 1/25000. At 1/50000 scale.
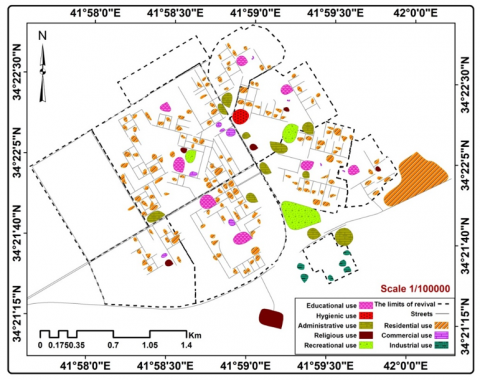
3.5 The digital mapping circular for urban land uses in Anah city according to the scale 1/100000
The numerical generalizations of the land uses within this scale were made according to the mathematical operations that were adopted in other scales, as the linear type land uses occurred and the number became (179) streets in the scale of 1/100000 after it was (253) in the scale of 1/50000. As for the survey patterns, its area amounted to (885360) square meters in the scale 1/100000, compared to (1252088) square meters in the scale 1/50000, as shown in Table 5 and Figure 7.
This discrepancy in numbers and area is a result of applying the digital generalization elements of selecting and removing, and then the two elements of simplification and smoothing, and then giving the appropriate coding for each use with the application of the exaggeration element on the health uses of land, meaning that the usage area decreased when the circular was applied, but its area in the map did not change.
Table 4. Results of the digital mapping process for urban land use for a city for the year 2021 between the scales 1/25000 and 1/50000
|
Use |
Scale 1/25000 |
Scale 1/50000 |
|
Transfer usage / number |
358 |
253 |
|
Residential use / m2 |
1027311 |
726419 |
|
Commercial use / m2 |
34330 |
24275 |
|
Industrial use / m2 |
39580 |
27987 |
|
Instructional use / m2 |
155143 |
109703 |
|
Sanitary use / m2 |
18869 |
13342 |
|
Administrative use / m2 |
234174 |
165586 |
|
Religious use / m2 |
96046 |
67915 |
|
Recreational use / m2 |
165266 |
116861 |
Table 5. The results of the digital mapping process for urban land uses for a city for the year 2021 between scales 1/50000 and 1/100000
|
use |
Scale 1/50000 |
Scale 1/100000 |
|
Transfer usage / number |
253 |
179 |
|
Residential use / m2 |
726419 |
513656 |
|
Commercial use / m2 |
24275 |
17165 |
|
Industrial use / m2 |
27987 |
19790 |
|
Instructional use / m2 |
109703 |
77572 |
|
Sanitary use / m2 |
13342 |
9434 |
|
Administrative use / m2 |
165586 |
117087 |
|
Religious use / m2 |
67915 |
48023 |
|
Recreational use / m2 |
116861 |
82633 |
Figure 6. The digital mapping process for urban land uses for Anah for the year 2021 between the scales 1/25000 and 1/50000
Figure 7. The process of digital mapping of urban land uses for Anah for the year 2021 between the scales 1/50000 and 1/100000
For the purpose of conducting a comparison process between the source map of urban land uses in Ana city with the maps that were produced from the digital generalization process for the scales 1/10000, 1/25000, 1/50000 and 1/100000, the matching process was carried out based on Arc Map 10.4.1 program. In order to determine the area ratio corresponding to the source map and the area percentage not matching with the source map, as it appears in the cartographic models (Figure 8) and Table 6.
Figure 8. Cartographic models
Table 6. The reconciliation process between the source map and generalized maps for different measures of urban land use in Ana city for the year 2021
|
Use |
The area is sq.m. |
Percentage |
|
Area of correspondence between 1/10000 scale map and the source map |
2799753 |
70.7 % |
|
The mismatched area between the 1/10000 scale map and the source map |
1159697 |
29.3% |
|
Area of congruence between 1/25000 scale map and source map |
1770719 |
44.7% |
|
The mismatched area between the 1/25000 scale map and the source map |
2188731 |
55.3% |
|
Area of congruence between 1/50000 scale map and the source map |
1252088 |
31.6% |
|
The mismatched area between the 1/50000 scale map and the source map |
2707362 |
68.4% |
|
Area of congruence between 1/100000 scale map and the source map |
885360 |
22.4% |
|
The mismatched area between the 1/100000 scale map and the source map |
3074090 |
77.6% |
As a final outcome of the generalization of digital, a three-dimensional model was built to simulate the digital mapping process of the models that were prepared on the basis of different measures, which facilitates the process of comparison between the functional importance of urban land uses by applying the elements of digital generalization as shown in Figure 9.
Figure 9. A three-dimensional (3D) model of the different measures
1. The research presented a model for the importance of using GIS techniques in building a geographical database for urban land uses with different scales 1/5000, 1/10000, 1/25000, 1/50000 and 1/100000.
2. Moving from one scale to another has an impact on the generalization process. The smaller the scale, the more important the generalization process will be to achieve an acceptable and non-cramped shape of the map through the application of digital generalization elements represented by (selection, deletion, simplification, smoothing, coding, exaggeration).
3. The research showed that there is a difference in the areas, uses and preparation of methods when moving from one scale to another.
4. The research found building a three-dimensional model to simulate the natural process of digital mapping with different scales.
1. The appropriate representation methods and methods must be relied upon in the coding process for the geographical features to which the digital mapping mechanisms have been applied in accordance with the characteristics of the map that are accurate, clear and easy to visual perception.
2. Researchers urged the trend towards studies related to the issue of generalization of digital cartography due to the lack of studies in this direction.
3. The necessity to urge researchers to keep pace with the development in the information revolution and to know new knowledge by practicing the use of software for geographic information systems in order to be able to employ their scientific and technical capabilities in the mapping process, whose applications have become involved in many fields of science.
[1] Ahmed, S.A.G., Mushref, Z.J. (2021). Three-dimensional modeling of visual pollution of generator wires in Ramadi city. PalArch’s Journal of Archaeology of Egypt / Egyptology, 18(7): 1659-1668.
[2] Stojanovic, M., Drobnjak, S., Jovanovi, J.M., Galjak, N., Vucicevic, A. (2020). Analysis of cartographic generalization based on PYTHON programming language on digital topographic maps. GISTAM 2020 - Proc. 6th Int. Conf. Geogr. Inf. Syst. Theory, Appl. Manag., no. Gistam, pp. 191-198. https://doi.org/10.5220/0009396501910198
[3] Kwan, M.P. (2002). Feminist visualization: Re-envisioning GIS as a method in feminist geographic research. Ann. Assoc. Am. Geogr., 92(4): 645-661. https://doi.org/10.1111/1467-8306.00309
[4] Satam, A.T.M., Nahar, Z.J.M., Khalaf, A.M. (2020). Building digital hydrological models for the Habbaniyah lake reservoir to calculate area variable. Multicult. Educ., 6(4): 1-8. https://doi.org/10.5281/zenodo.4147322
[5] Sulaiman, S.O., Najm, A.B.A., Kamel, A.H., Al-Ansari, N. (2021). Evaluate the optimal future demand of water consumption in Al-Anbar province in the west of Iraq. International Journal of Sustainable Development and Planning, 16(3): 457-462. https://doi.org/10.18280/ijsdp.160306
[6] Abdulhameed, I.M., Sulaiman, S.O., Najm, A.B.A. (2021). Reuse wastewater by using water evaluation and planning (WEAP)(Ramadi city–case study). In IOP Conference Series: Earth and Environmental Science, 779(1): 12104. https://doi.org/10.1088/1755-1315/779/1/012104
[7] Abed Hammad, L.M. (2021). Dynamic analysis of the impact of Anbar university on increasing traffic congestion in Ramadi. PalArch’s J. Archaeol. Egypt/Egyptology, 18(7): 189-199.
[8] Stoter, J., Post, M., Van Altena, V., Nijhuis, R., Bruns, B. (2014). Fully automated generalization of a 1:50k map from 1:10k data. Cartogr. Geogr. Inf. Sci., 41(1): 1-13. https://doi.org/10.1080/15230406.2013.824637
[9] Malczewski, J. (2006). GIS‐based multicriteria decision analysis: a survey of the literature. Int. J. Geogr. Inf. Sci., 20(7): 703-726. https://doi.org/10.1080/13658810600661508
[10] Park, W., Huh, Y. (2019). Generalization of road network using logistic regression. J. Korean Soc. Surv. Geod. Photogramm. Cartogr., 37(2): 91-97. https://doi.org/10.7848/ksgpc.2019.37.2.91
[11] Jaber, Z., Talak, A., Mohammed, A., Abed, K., Othman, S. (2020). Geomatics techniques of assessing the land cover of Sehailiya valley’s Basin in Iraq. Multicultural Education, 6(3): 133-142. https://doi.org/10.5281/zenodo.4147298
[12] Najm, A.B.A., Abdulhameed, I.M., Sulaiman, S.O. (2020). Water requirements of crops under various Kc coefficient approaches by using Water Evaluation and Planning (WEAP). International Journal of Design & Nature and Ecodynamics, 15(5): 739-748. https://doi.org/10.18280/ijdne.150516
[13] AlHamaydeh, M., Al-Shamsi, G., Aly, N., Ali, T. (2021). Seismic risk quantification and GIS-based seismic risk maps for Dubai-UAE_Dataset. Data Br., 39: 107566. https://doi.org/10.1016/j.dib.2021.107566
[14] Khalaf, A.M., Mushref, Z.J., Khaleefah, I.M., Abed, S.O. (2021). Relational modelling of the earth's surface topography impact on vegetation density using RS and GIS: Rawnduz as a model. International Journal of Design & Nature and Ecodynamics, 16(4): 435-444. https://doi.org/10.18280/ijdne.160410
[15] Ali, E. (2020). Geographic Information system (GIS): Definition, development, applications & components. https://www.researchgate.net/publication/340182760_Geographic_Information_System_GIS_Definition_Development_Applications_Components.