Masrur Alatas* | Maria Theresia Sri Budiastuti | Totok Gunawan | Prabang Setyono
© 2021 IIETA. This article is published by IIETA and is licensed under the CC BY 4.0 license (http://creativecommons.org/licenses/by/4.0/).
OPEN ACCESS
This study was designed to determine the stages in the identification of micro-hydro in irrigation channels based on the classification and level of data requirements in a project, starting from the initial study, feasibility study and detailed engineering design. The study was conducted with site selection criteria using four information systems and technology tools, namely Google Earth, GIS Topography, UAV Drone Phantom DJI 4, and Nikkon DTM 332 Total Station. The results shows through GE and GIS, obtained 23 potential points, 7 of which are high potential, followed by field measurements with 1 selected UAV location Cascade, and detailed with TS to produce Head (H) 12 m, with CM and FDC probability 75% discharge (Q) 5.5 m3/s, generated power (P) 550 kW. This study provides a method and solution for speed in identifying potential with Google Earth and GIS (Macro Class), speed and risk reduction for surveyors with UAVs (Mezo Class), and accuracy and detailing at selected locations with Total Station (Micro Class). So that this research provides accuracy in the stages, methods and tools used in the identification of micro-hydro potential in irrigation channels.
micro-hydro potential identification, primary irrigation channel, current meter, FDC, GIS, Google Earth, UAV, Total Station, Yogyakarta, Indonesia
Indonesian electricity demand was 68% (in 2017) of the total national installed capacity generated by PT PLN (State Electricity Company), with energy sources dominated by coal (55%) and natural gas (26%) [1]. Fossil energy sources are increasingly limited and cannot be renewed, as an example is coal which can only be provided until 82 years, while natural gas is only up to 33 years [2]. Fossil fuels or Fossil energy is also one of the pollutants, that the produced carbon dioxide does cause air pollution and causes heat to be trapped in atmosphere, and making it the main contributor to global warming and climate change [3]. For this reason, the government's efforts to reduce Green House Gas (GHG) emissions in the energy sector include prioritizing the development of new and renewable energy, fuel switching, and using low-carbon and efficient technology [4].
The industrial revolution 4.0 is shown by digitalization, use of electronics, and information technology both manufacturing and services [5]. The concept of the industrial revolution 4.0 allows for efficient and effective production with the help of faster computers and the use of more sophisticated tools, so that the costs incurred are more reasonable [6]. The main idea of the industrial revolution 4.0 is to exploit the potential of new technology and the concept of digital mapping and visualization of the real world [7], for that technology plays an important role in various sectors, one of which is energy.
Micro-hydro is a renewable energy that is environmentally friendly with efficient operational costs. The main advantage of micro-hydro does not affect environmental degradation because construction and water use can be neglected [8]. Calculation of potential energy generated from micro-hydro power has been carried out and in the data per province. Mini and micro-hydro potential in the special region of Yogyakarta reaches 5 MW [2]. However, the problem occurring is that there is no data on the potential energy generated by micro-hydro in detail. Research on the potential of micro-hydro energy in the Serayu Opak River Region has been carried out by Pranoto et al. [9], namely the potential energy in the Kalibawang Main Channel reaches 3.2 MW with 29 location points. This value is a visual calculated globally using GIS assistance, so detailed measurements in the field need to be carried out. Furthermore, detailing the potential for micro-hydro using UAVs with drones can reduce the risk factor in the field, is simple and cost-effective [10].
Geographic Information System (GIS) has been carried out to support renewable energy spatial planning. GIS can display calculations and visualizations [11], making it easier to analyze. With GIS the potential point for future RE development can be estimated [12]. Visualization of rivers and irrigation channels with the help of GIS can be used to identify the potential of RE, namely micro-hydro. The results of the temporary identification can be used as a reference for verification in the field.
Topographical surveys directly in the field take a lot of time, and sometimes the sites surveyed are not the best potential points. So that studies with Google Earth and GIS provide initial data and the environment around potential locations, the coordinates of potential points and access to locations. This initial data is important to know to make strategies and priorities. The selected location was carried out by a UAV survey for speed of obtaining data and reducing risks to the surveyor, especially in high falls, fast currents and wide channels. Selection of the best location, access and the best potential for measurements with a Total Station, this stage is to speed up work efficiently, precisely, not to repeat surveys, save survey costs and reduce risks to the surveyor team.
Efforts to detect the development of micro-hydro potential in the field study location are by collaborating with secondary data that has been published by related parties (GIS data), tracking potential with Google Earth, identifying potential Unmanned Aerial Vehicle (UAV) versions of the results of field shots, followed by selecting the best potential, namely cascade, and finally topographic details and cross-section at selected cascade locations. In connection with the series of activities, the purpose of this study is to identify the potential of micro-hydro in an efficient and accurate way by combining the GIS, Google Earth, UAV, and Total Station (TS) method approaches.
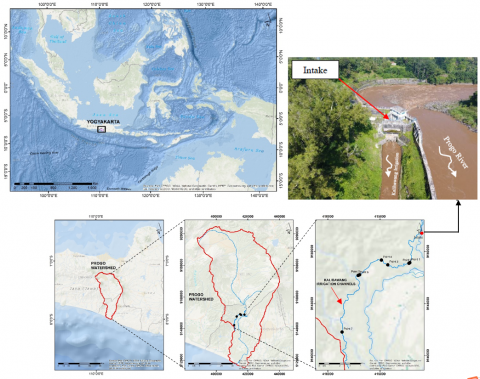
The research location is along the Kalibawang Primary Irrigation Channel along 25 km, with side tapping intake and water discharge designed at 7 m3/s for irrigation covering an area of 6,337 ha. Kalibawang irrigation water discharge is taken from the Progo River which is systemized from the Progo watershed. Administratively, the Progo Watershed is located in Central Java Province and Special Region of Yogyakarta (DIY). The area of the Progo Watershed is ± 2,421 km2, with the length of the main river is ± 138 km. The monthly average discharge of the Progo River was recorded in several places, namely Kali Bawang 58.50 m3/s. At the Kalibawang station, the maximum debit of the Progo River is 331 m3/s and a minimum of 12.00 m3/s (Figure 1).
Figure 1. The research location Kalibawang Irrigation Channels
Data collection in the form of secondary data (GIS + RBI/ Indonesia Topographic Map), Google earth image data, field data (UAV, TS measurement, measurement of potential discharge with Current Meter/ CM). Data collection methodology for measuring situations applied Nikkon DTM 332 Total Station, flow velocity and potential discharge data. Figure 2 shows that the stages in the study include two main activities, namely identification of discharge data and height difference, then a recommendation for the type of turbine that is most suitable to be applied at the study location. Determination of height difference begins with macro activities through analysis of GIS data, then mezo identification through UAV measurements, and is detailed in micro detail with TS measurements. The GIS and GE data processing stages rely on secondary data in the form of elevation to be calculated into head data. The visualization of the UAV and TS is the result of field data processing, the head value of the UAV stage is the difference in the height of the contour lines resulting from aerial photo data processing, while the head value of the TS can be determined through the measured height and angle data.
Figure 2. Schematic model stages for identifying micro-hydro potential through integration of information and technology on irrigation channels
2.1 Macro Data Processing with Google Earth (GE) and Global Information System (GIS)
Secondary data are obtained from Serayu Opak River Basin Area Center (BBWSO) and Geospatial Information Agency (BIG) including irrigation channel shape file and contour data. GIS and RBI are used to determine the elevation by extracting DEM data. The DEM data are created using the ‘topo to raster' method with the input data are in form of the contour data [13]. The DEM data are extracted from the Spatial Analyst Tool, the Extract Value to Points, so the elevation of each point can be known. Each of the elevation point is calculated to determine the potential head based on GIS and RBI using Eq. (1). The irrigation channel segment is determined based on the best potential point that has been selected through a combination of GIS analysis and Google Earth.
2.1.1 Google earth based data processing
Prediction of potential height difference can be calculated roughly with Eq. (1) as follows:
∆H Potential = Elv a – Elv b (1)
Or in the following equation:
$\Delta H_{p o t}=\left(\sqrt{\frac{\left(L_{a-b}\right)^{2}}{\Delta H^{2}}} \times\left(\frac{\Delta H}{\sqrt{\frac{\left.\left(L_{a-b}\right)^{2}\right)}{\Delta H^{2}}}}\right)\right)-\left(L_{a-b} \times 10^{-3}\right)$ (2)
$\Delta \mathrm{H}_{p o t}={ }_{\Delta} \mathrm{H}_{a b}-\left(L_{a b} \times 10^{-3}\right)$ (3)
$\Delta \mathrm{H}_{p o t}=\Delta \mathrm{H}_{a b}-\left(\sqrt{L_{a b}^{2}} \times 10^{-3}\right)$ (4)
2.2 Mezo data processing with UAV based data processing
The identification phase, based on GIS as well as Google Earth, have been carried out at the pre-field stage. So, it is efficient to determine potential recommendations which can be used to carry out the topographic and situation measurements and land use using a Phantom 4 UAV drone. Taking aerial photographs UAVs begins with determining the drone's flight path, and desired map scale. The formula used to determine the scale of the map is presented in Eq. (5). The result of this UAV is then processed to produce DEM data which is used to determine the potential for high differences [14].
S = CFL / (Elv H2 – Elv H1) (5)
∆H = Elv H2 – Elv H1 (6)
2.2.1 Processing the data and creating DEM
To see the visual contour in 3D form, it is necessary to do the next processing called DEM with surface. The stages in processing UAV data into DEM data and 3D contours are presented in Figure 7. This process is required to clean up irregular and overlapping photo data and generate the georeferenced 3D point clouds [15]. Any software can help to generate the georeferenced 3D dot clouds such as Agisoft PhotoScan, but this software is quite sophisticated in UAV applications and makes it possible to produce DEM and orthophoto in the desired coordinate system. This software uses a lot of computer resources and will require a very fast computer, especially when there are large amounts of data need to be processed [15]. The data processing begins with making Tie points representing the number of 3D cloud points which amount to 86,992 points (see Figure 7b). For geomatic applications, we need firstly to georeferenced the data. One of the methods commonly used for that is direct georeferencing. This method combines the GPS time and camera inertial time, which are important for data adjustment and then generate the 3D georeferenced cloud points [15]. Tie points are generated from 3D point clouds. They, later on, produce 2,473,055 dense clouds (point density 17.2 points/m2) (see Figure 7c). After the dense cloud is generated, the next step is to generate DEM. In this study, the DEM has been produced with a resolution of 24.1 cm / pixel (see Figure 7d). The accuracy of geometric analysis can be seen in the RMS re-projection error. In this study, the value is 0.210641 (3.65088 pix). The end result of this process is Orthomosaic (see Figure 7f).
2.3 Micro data processing with processing the data based on total station (TS)
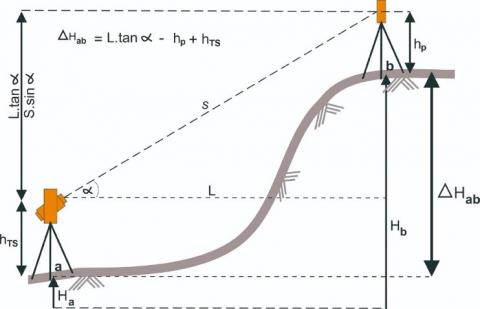
To have the detailed measurement of the situation, the researcher uses an instrument-Nikkon DTM 332 Total Station, which is aimed at mapping the micro-hydro cascade situation. Measurements with TS are illustrated in Figure 3. The mapped areas include irrigations, river, roads, yards and medium density settlements. Total Station is a combination of electronic theodolite, EDM (Electronic Distance Meter), and data collecting and processing software [16]. The measurement result obtained TS measurement are angle and distance data. The equipment of Total Station instrument used in the measurement includes 2 prisms, 2 poles, static, measuring tape, and the Nikkon DTM 332 Total Station. The researchers have a survey of reference sites, foresight, and back sight. In measuring the land, the researcher uses branching open polygon method. It is downloaded with computer and Trans-IT software. To do the calculation, the researcher uses Microsoft Excel coordinate calculation software and AutoCAD software. They are used to describe the result of long section and cross section measurement. Field measurement locations also include areas for Micro-hydro Cascade infrastructure development plan, including Intakes, Calm Ponds, Penstock Tracks, Aqueduct, Power Houses and Tailrace. The detailed measurements of topographic contours were carried out at point 17 PWF and 16 PWF. The result of height difference result of TS measurements is presented in Table 5, calculated using Eq. (7) [17].
Figure 3. Observation of height different object
ΔHab = L.tan α – hP + hTS (7)
2.4 Processing water discharge data
Determination water discharge is done in two ways: determination of water discharge with secondary data, and determination of water discharge by conducting measurement in the field. Determination of water discharge with secondary data is to determine the water discharge value based on Flow Duration Curve (FDC) using monthly water discharge data within a certain period [18]. FDC indicates the availability of water with the desired probability, so this data are important for estimating hydropower potential [19]. Meanwhile, to determine the water discharge measurements in the field, the researcher uses the Current Meter to measure the flow velocity. Water discharge calculation using Mid-Section Method assumes that the average velocity on each vertical represents the average velocity of each segment so that water discharge water is also in each segment. Then, the sum of water discharge on all segments is the final channel water discharge [20], see Eq. (8).
qn = vn [(Ln – L(n-1))/2] dn (8)
2.5 New renewable energy potential (P)
The formula used to calculate the power that can be generated is as follows:
$\mathrm{P}=\rho \times \mathrm{g} \times \mathrm{H} \times \mathrm{Q} \times \eta$ (9)
2.6 Macro data, head identification based on GIS
Indonesia has 3311 weirs and the 1729 weirs are in Yogyakarta. This city also has 1279 Irrigation Area. The selection of GIS data is focused on the potential in the Special Region of Yogyakarta [21]. Based on the GIS map from BBWS Serayu Opak, Kalibawang Irrigation Area which has a large water discharge intake is chosen. Kalibawang is designed with 7,000 liters/second water discharge intake and with Primary channel length of 25 Km.
Based on the Indonesian Topographic Maps (RBI) map from the Geospatial Information Agency, it is found that the location of the study was under a fairly steep hillside. With hilly topographical conditions, it is possible to experience grid-based electricity supply constraints, because it requires greater costs for procurement [8]. Looking at this topographic map, we can know the slope of hillside to determine the height difference roughly. Low slope cannot be used for power plant development though water availability is good [22], this is because there is not enough height difference to flow water swiftly as a turbine drive. The Kalibawang Irrigation Area has an area of 7,152 ha [23]. A prediction of height difference is presented in Table 1 was calculated by Eq. (1). Based practice on the elevation difference and channel length with the slope design of 1‰, the head height.
2.7 Head identification based on Google Earth
In this second stage, aerial photographs are identified through satellite images of Google Earth Pro 2020 to carry out tracking starting from the Irigation Area intake of Kalibawang along the 25 Km-long primary channel.
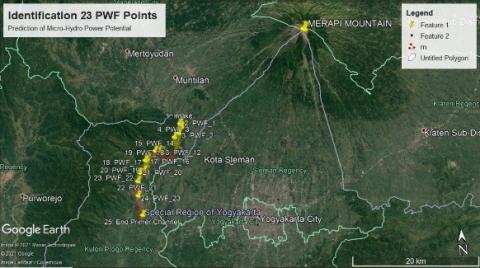
Based on Figure 4, through Google Earth satellite imagery, it is indicated that there 23 potential points. It is based on the presence of froth (white) on the Kalibawang irrigation channel as an indication of the existence of a Potential Water Flow (PWF). The indication result on Google Earth are crossed rechecking the potential head with the formula in Eq. (1). Based on prediction with Google Earth, there is 23 m of waterfall obtained, and 7 potential points are selected in the primary irrigation channel in Kalibawang Irrigation Area (Figure 5). These potential points are determined based on height consideration by using contours. Then the calculation of the height difference (head) using Eqns. (2-4) is a formula modified by the author. The results show that the three equation modifications produce the same head value (Table 2), while the head value with the equation is roughly calculated so that the value is greater.
The table of analysis result of GIS and RBI height differences is H gross (Macro), so it needs to be detailed with the next step, that is, the UAV-based topographic measurement.
2.8 Mezo data, head identification based on UAV measurement
The results of UAV measurements in the field at each potential point are presented in Figure 6, while the UAV-based high potential differences are presented in Table 3.
Table 1. Head (H) Potential based on GIS and RBI on sta 0+00 until sta 25+00
|
Sta |
X |
Y |
Length (m) |
Elevation (m) |
Head Prediction (m) |
|
Sta 0 ± 00 |
418801 |
9153063 |
0 |
168.79 |
0.86 |
|
Sta 0 ± 5.8 |
417857 |
9148926 |
5802 |
167.93 |
9.31 |
|
Sta 0 ± 6 |
417777 |
9148865 |
189 |
158.62 |
15.22 |
|
Sta 0 ± 9.8 |
415139 |
9149169 |
883 |
145.99 |
2.54 |
|
Sta 0 ± 12.9 |
413039 |
9147762 |
2889 |
143.45 |
0.00 |
|
Sta 0 ± 13.5 |
412905 |
9147702 |
599 |
143.45 |
19.03 |
|
Sta 0 ± 21 |
411358 |
9142273 |
7527 |
124.42 |
12.49 |
|
Sta 25 ± 00 |
412006 |
9138778 |
3510 |
111.93 |
1.93 |
Figure 4. Potential identification tracking PWF 23 points form Google Earth Identification
Table 2. Head (H) 7 Potential locations based on Google Earth at sta 0 + 00 to sta 25 + 00
|
A |
B |
C |
D |
E |
F |
G |
H |
I |
J |
|
1 |
Sta 6 + 000 m |
1000 |
160 |
154 |
5.00 |
5.00 |
5.00 |
PWF 7 |
Semawung mikro |
|
2 |
Sta 8 + 000 m |
1000 |
150 |
145 |
4.00 |
4.00 |
4.00 |
PWF 9 |
Njurugan |
|
3 |
Sta 9 + 000 m |
1000 |
148 |
141 |
4.00 |
4.00 |
4.00 |
PWF 12 |
Tunggak Mojo |
|
4 |
Sta 11 + 000 m |
1000 |
140 |
133 |
6.00 |
6.00 |
6.00 |
PWF 16 |
Blumbang Talang |
|
5 |
Sta 12 + 000 m |
1000 |
133 |
129 |
6.00 |
6.00 |
6.00 |
PWF 17 |
Blumbang |
|
6 |
Sta 12 + 000 m |
1000 |
133 |
129 |
3.00 |
3.00 |
3.00 |
PWF 18 |
Kedungrong |
|
7 |
Sta 19 + 000 m |
1000 |
118.5 |
116 |
1.50 |
1.50 |
1.50 |
PWF 23 |
Kama |
Description number:
Source: The result of data processing (2020)
Figure 5. Potential identification tracking 7 points PWF priority selected
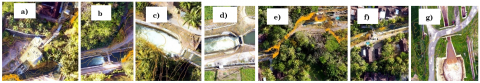
Figure 6. UAV measurement location: (a) potential 1, (b) potential 2 or PWF 7, (c) potential 3 or PWF 9, (d) potential 4 or PWF 12, (e) potential 5 (PWF 17), (f) potential 6 (PWF 18), (g) potential 7 or PWF 23
Table 3. UAV topography contour with head potential (DH)
|
No |
Potential Water Fall |
Location |
Coordinate |
∆H UAV (m) |
Information |
|
|
1 |
PWF 7 |
Semawung mikro |
417857 |
9148926 |
1.5 |
|
|
2 |
PWF 9 |
Njurugan |
417776 |
9148866 |
5 |
|
|
3 |
PWF 12 |
Tunggak Mojo |
415748 |
9148712 |
3 |
|
|
4 |
PWF 17 |
Blumbang |
413039 |
9147762 |
8 |
|
|
5 |
PWF 18 |
Kedungrong |
412905 |
9147702 |
7 |
|
|
6 |
PWF 23 |
Kamal |
411358 |
9142273 |
3.5 |
|
|
7 |
PWF 17 & PWF 18 |
Blumbang Kedungrong Cascade |
412905 |
9147702 |
15 |
New Findings combined 2 waterfall (Recommended) |
The contour data generated from UAV in the form of water level (above and below the waterfall) are used to determine the height difference (head). Point 1 has a height difference of 15 m according to the existing condition in the development of micro-hydro. PWF 7 has a height difference (∆H) 1.5 m, PWF 9 ∆H 5 m, PWF 12 ∆H 3 m, PWF 17 ∆H 7 m and PWF 18 ∆H 8 m, and PWF 23 ∆H 3.5 m. The UAV reveals that the greatest potential is the Cascade MHPP Potential by combining the PWF 17 and PWF 18 with ∆Hgross 15 m is MHPP Cascade (Figure 7). After the having the best potential location, the next step is making more detail and precise measurements using the Total Station Aircraft (TS). The combination of UAV and TS can produce DEM data with high resolution (Figure 7 a-g). [24].
2.9 Micro data, Head identification based on Total Station (TS) measurement
The measurement result with TS produce a more detailed and precise Topographic Contour (Figure 8) with a result of 12 m high potential difference.
Figure 7. The stages of processing UAV into DEM (a) flight area and camera location, (b) Tie points, (c) Dense cloud, (d) DEM with surface 2.5 D model, (e) DEM 2D, (f) Orthomosaic, (g) 3D Visualization with terrain color
Figure 8. Contour topographic measurements with TS (PWF 17 & PWF 18 Cascade Potential)
Figure 9. (a) Flow Duration Curve (FDC) potentials of irrigation MHPP in Kalibawang (Secondary Data: Q intake 11 tahun 2009-2019), (b) Instant water discharge intake with Current Meter (Primary data)
2.10 Discharge data based on FDC and CM data
Based on the above measurement, the design head on potential Cascade PWF 17 and 6 ∆H is 12 m. There is a difference in the measurement result of height difference between using UAV and TS. The results of measurement of height difference using UAVs are slightly greater when compared to the field result using TS [25]. After getting the value of ∆H, the researcher needs to get the value of P by determining the channel water discharge. Based on the Figure 9.a, the water discharge design of MHPP Cascade option 1 with 85% probability is 5 m3/s, and option 2 with a 75% probability is 5.5 m3/s with production assumption throughout the year including 1 month maintenance in a 1 year. During this study, discharge measurements have been made at the potential location of MHPP in Kalibawang Irrigation. The measurements are carried out from January 2020 to February 2020. The measurements are carried out by the using Mid-Section Area Method with the Current meter (Figure 9.b). Water discharge measurement result in that period shows that the average water discharge of the Kalibawang Irrigation Primary Channel in January 2020 is Q-moment 5.8 m3/s, February 2020 Q-moment 6 m3/s, and June 2020 Q-moment 5.9 m3/s. Based on the analysis from FDC and CM, it is obtained, from FDC a reliable water discharge with 85% probability of 5 m3/s and probability of 75% discharge (Q) 5.5 m3/s.
3.1 Classification and level study
GIS, RBI, GE and UAV analysis has led to the final result of site selection. This site, which is conducted detailed measurements, is the potential Cascade (PWF 17 and PWF 18) with TS measurement producing a Head (∆H) of 12 m (Table 4). And based on FDC and CM analysis, the FDC obtains a reliable discharge with a probability of 75%, namely Discharge (Q) 5.5 m3/s. The value of head (H), discharge (Q), and efficiency (h) in the research is the result of detailing with the stages mentioned in the methodology. Based on this value, the power that can be generated using Eq. (9) is 495 kW or 0.5 MW. Meanwhile, the research conducted by Pranoto et al at the same location, using only the geospatial method (GIS), resulted in a different amount of power. This is because discharge used in calculating the potential power is 1 m3/s, with an efficiency value of 60% [9]. The difference in the use of discharge values and efficiency with Pranoto et al’s research is because researchers not only focus on mapping micro-hydro potential points, but also calculate potential discharge using FDC with periodic discharge data, and validate discharge data using the velocity area method.
The role of each technology used to identify the best micro-hydro potential is presented in Table 5. Each technology provides a different potential head value. The DH calculation parameter in GIS + RBI technology uses elevation from topography (contour), GE technology uses the elevation and length of the irrigation channel, UAV technology uses water level elevation, and TS uses the height measured from the target object. To decide which PWF is best measured by TS requires an initial analysis through secondary data stages, namely GIS and GE, while PWF 17 and PWF 18 are the focus points because they have the largest DH value after calculating using UAV. After measuring the TS, the value of DH between the points on PWF 17 and PWF 18 is 12 m, which is the location of the micro-hydro cascade that is proposed to be built a new micro-hydro.
Table 4. DH TS measurement
|
Steam Water Flow |
Elevation |
(∆H) |
|
PWF 17 Blumbang |
142.960 - 137.330 |
5.53 |
|
PWF 18 Kedungrong |
136.900 - 131.910 |
4.99 |
|
PWF 17 and 18 Cascade |
143.960 - 131.910 |
12.050 |
Based on the graph in Figure 10, the results of research for micro-hydro are classified into 3 stages using Survey and Mapping Information and Technology, namely Macro for the initial study or preliminary study, the cost is very economical by using Google Earth and GIS, there are 23 potential points but this information in the nature of rough data with contour intervals of 5-10 m, at this stage 7 potential points are selected for the next stage. The Mezo stage uses UAVs to survey the 7 most possible potential points, surveys with UAVs minimize the risk to surveyors, especially in large and heavy irrigation canals, from 7 potential points 1 is selected the largest location for identification in detail and precision using a Total Station (TS). Measurement results with TS as a reference in analysis and planning as well as detailed drawings of engineering civil work designs Intake intake, channel, tranquilizer pond, penstock, powerhouse and tailrace, ME, namely turbines, generators, panels and electrical systems. The efficiency and effectiveness of each method for determination of micro-hydro are presented in Table 6.
Table 5. Potential head of each method (GIS, GE, UAV, TS)
|
No |
Potential Water Fall |
Location |
GIS |
GE |
UAV |
Cascade |
Information |
TS |
|
∆H (m) |
∆H (m) |
∆H (m) |
∆H (m) |
∆H (m) |
||||
|
1 |
PWF 7 |
Semarung mikro |
9.31 |
5.00 |
1.5 |
+ |
||
|
2 |
PWF 9 |
Njurugan |
15.22 |
4.00 |
5 |
+ |
||
|
3 |
PWF 12 |
Tunggak Mojo |
- |
4.00 |
3 |
+ |
||
|
4 |
PWF 16 |
Blumbang Talang |
2.54 |
6.00 |
- |
+ |
||
|
5 |
PWF 17 |
Blumbang |
- |
6.00 |
8 |
15 |
* |
12 |
|
6 |
PWF 18 |
Kedungrong |
19.03 |
3.00 |
7 |
|||
|
7 |
PWF 23 |
Kamal |
12.49 |
1.50 |
3.5 |
+ |
||
|
|
- Less potential, + Development potential, * Potential selected cascade PWF 17 and PWF 18 |
|||||||
Table 6. Classification of GIS, RBI, GE, UAV, TS, and CM for the efficient and effective determination of micro-hydro potential locations in irrigation channel
|
No |
Stages and 20 points in the identification of micro-hydro potential in irrigation channels efficiently and effectively based on Information Technology (IT): GIS, RBI, GE, UAV, TS, FDC, and CM |
Macro |
|
Mezo |
Micro |
|
|
GIS + RBI |
GE |
UAV |
TS |
FDC, CM |
||
|
A. |
Preliminary Studies |
|
|
|
|
|
|
1. |
Looking for potential data of Irrigation Areas with Large Water discharges with good Topography |
√ |
√ |
- |
- |
- |
|
2. |
Knowing the boundaries |
√ |
√ |
- |
- |
- |
|
3. |
Knowing the coordinates of potential locations and access to potential locations |
√ |
√ |
|
|
|
|
4. |
Looking for potential waterfalls in irrigation channels through satellite photo, aerial photographs, land use quickly, easily and cheaply |
- |
√ |
- |
- |
- |
|
5. |
Knowing the plans of consumers and micro-hydro energy distribution networks |
√ |
√ |
√ |
- |
- |
|
B. |
Feasibility Studies |
|
|
|
|
|
|
1. |
Looking for potential waterfalls in irrigation channels through Aerial Photography, Topographic Contour, DEM, 3D, Lan use Details |
- |
- |
√ |
- |
- |
|
2. |
Looking for Height Difference (∆H) and topographic contours in detail and precision |
- |
- |
- |
√ |
- |
|
3. |
Knowing the vast land use, land ownership, real length of penstock, excavation details and embankment |
- |
- |
- |
√ |
- |
|
4. |
Knowing the plans of consumers and micro-hydro energy distribution networks |
√ |
√ |
√ |
- |
- |
|
5. |
Knowing the size of the cross section in detail and precision |
- |
- |
- |
√ |
- |
|
6. |
Supporting preparation of initial potential study descriptions |
√ |
√ |
√ |
- |
- |
|
7. |
Choosing potential location |
√ |
√ |
√ |
- |
- |
|
C. |
Detail Engineering Desing |
|
|
|
|
|
|
1. |
Accurating measurement and topographic detail with Head (H) accurately, Potential discharge with plan probability, Energy (P) to determine the type of turbine used correctly |
- |
- |
- |
√ |
√ |
|
2. |
Planning the location of micro-hydro infrastructure precisely |
- |
- |
- |
√ |
- |
|
3. |
Planning design drawings and excavation of landfill infrastructure locations |
- |
- |
- |
√ |
- |
|
4. |
Determining the exact elevation of the water surface (Hydraulics Waterway) |
- |
- |
- |
√ |
√ |
|
5. |
Detailed Images of Intake Design, Trashrack, Carrier Channel, Settling Pool, Calming Pool, Penstock, Power House, Turbine, and Tail Race. |
- |
- |
- |
√ |
- |
|
D |
Important Supporting Data |
|
|
|
|
|
|
1. |
Water Quantity (FDC From 10 years data) |
- |
- |
- |
- |
√ |
|
2. |
Microhydro Development |
- |
- |
- |
√ |
√ |
|
3. |
Data supporting technical aspects |
√ |
√ |
√ |
√ |
- |
|
4. |
Supporting data on socio-economic aspects |
√ |
√ |
√ |
√ |
- |
|
5. |
Data supporting environmental aspects |
√ |
√ |
√ |
√ |
- |
Figure 10. Graphic Classification and Level Study of MHPP potential identification in Irrigation Channel
3.2 Turbine and power potential of micro-hydro
The type of recommended turbine depends on the water discharge characteristic and the height difference (head) [26]. In this study, the recommended turbines are determined using graphs, presented in Figure 11. Plotting on the graph shows that the cascade points are on the Francis, Kaplan, and Crossflow turbine types. Unclean water, especially cascade locations where a lot of garbage can cause very fast wear on high head Francis turbines, so Francis Turbines not suitable. While Crossflow turbines also not suitable for low-head [27]. Kaplan turbine head range 2 < H < 40 m. Kaplan turbine have range of specific speed 0.19 ≤ nQE ≤ 1.55 [28]. The PWF 17 & PWF 18 (Cascade) potential ∆H is 12 m, nQE = 0,68566, and with type flow axial and closing system gate valve. Turbine tipe selection decision and recommendation for the (Cascade) is Kaplan S type turbine. Kaplan S type turbines are more suitable and productive for low-head applications.
Figure 11. Graphic of determining the recommended type of turbine adapted from [29-32]
GIS and GE-based identification is very useful in finding potential locations based on visual waterfalls, and land use. Around those potential areas, it is found 23 potential loads. In GIS and GE (G) and head (H) potency analysis, it is not yet precise. It is still Macro. The best results which finally obtained are 7 locations to conduct the identification of the second stage based on UAV. This technology can minimize the risk during the survey. It is also more efficient and effective and very fast in the field. The UAV result knows the actual condition in the field, the situation and conditions in the field. It is very good for knowing the location of infrastructure placement, penstock pipeline, power house and tail race. In the measurement of the 7 locations it is found a very good location that is the merging of 2 waterfalls (PWF 17 Blumbang and PWF 18 Kedungrong), micro-hydro cascade with potential Head (H) 15 m. Based on the analysis result of momentary water discharge data with CM and the analysis of 10-years data, it is obtained FDC with a probability of 75% with water discharge of 5.5 m3/s. Contour and topography for the height difference from UAV result is not accurate, it is necessary to measure precisely and accurately by using a Total Station (TS) at Micro-hydro Cascade location. After measuring it the height difference is corrected to 12 m. Measurement with TS in this study is used as a reference in the construction of excavation and embankment infrastructure and micro-hydro infrastructure design. The results of measurement is with a height difference (∆H) 12 m and discharge (Q) 5.5 m3/s, the power generated (P) = 500 kW or 0.5 MW. Based on the calculation of the height difference and flow rate, the recommended type of turbine to generate new micro-hydro is Kaplan Horizontal S-Type. The findings of the three classes classification, namely Macro Class, Mezo Class and Micro Class, provide an efficient and effective choice for surveyors in selecting and identifying potentials according to the need for a macro-stage preliminary survey, identified by GE and GIS, feasibility studies with UAVs and engineering details design using TS.
The limitation of this study is only for the open channel of primary irrigation and the channel is not covered by leaf canopy. The next study direction is Potential Water Fall (PWF) as seen from aerial photos, both Google Earth and UAV aerial photos. The appearance of water foam can be measured the width and length of the foam, this information can be investigated in the future whether there is a correlation or relationship between the width and length of the water foam at each PWF with the potential energy or ∆H potential. Based on the results of the total number of ∆H on the PWF GE + formula, the ∆H is 29.5 m, while the UAV measurement is H 28 m. So that the ∆H measurement results from GE and UAV almost have the same total ∆H, so it is necessary to do further research on how to minimize the ∆H gap between GE and UAV, with research carried out on many irrigation systems.
The authors would like to express their appreciation to the Universitas Gadjah Mada (UGM), Sebelas Maret University (UNS), Jasa Tirta Energi (sub state owned enterprises), Yogyakarta Institute of Technology (ITY), Department of Energy and Mineral Resources of Yogyakarta. The department of Public Works (irrigation) Kulon Progo regency, Central River Region Serayu Opak, Indonesian Research and Training Institute, the Integrated Indonesian Micro-hydro Community (IIMC).
|
∆H Potential |
the potential head gross (m) |
|
Elv a |
the water level elevation a (msl), |
|
Elv b |
the water level elevation b (msl) |
|
L ab |
the length of irrigation a to b |
|
MHPP ∆H ab |
Micro-Hydro Power Plant the potential head gross (m) between a and b |
|
S |
Scale |
|
CFL |
the camera focus length |
|
H |
the flying height above object |
|
H1 |
the upper flying level |
|
H2 |
the lower flying level |
|
hP |
the prism height |
|
HTS |
the total station height |
|
qn |
the discharge through segment n |
|
vn |
the mean velocity in vertical n |
|
Ln |
the distance on the tape corresponding to location of vertical n |
|
Ln-1 |
the distance on the tape corresponding to location of vertical n-1 |
|
dn |
the depth of water at vertical n (at end bank water edge) |
|
P |
Power |
|
g |
Gravity |
|
Q |
Discharge |
|
Greek symbols |
|
|
a |
Angle |
|
$\rho$ |
specific weight |
|
$\eta$ |
efficiency ratio |
[1] IESR. (2019). Desentralisasi Ketenagalistrikan di Indonesia: Studi Kasus Pembangkit Listrik Energi Terbarukan Berbasis Komunitas di 2 Daerah di Indonesia (2nd ed.). Institute for Essential Services Reform. http://iesr.or.id/.
[2] Presidential Regulation of the Republic of Indonesia Number 22 of 2017 concerning the General Plan of National Energy. (2017). https://jdih.esdm.go.id/peraturan/Perpres%2022%20Tahun%202017.pdf.
[3] Ayyoub, S.A.S., Radaydeh, N.M.M. (2021). The knowledge of people about the use of renewable energy and environmental awareness in their area, Irbid governorate as a case study. International Journal of Sustainable Development and Planning, 16(2): 365-371. https://doi.org/10.18280/IJSDP.160216
[4] ESDM. (2019). Rencana Umum Ketenagalistrikan Nasional 2019-2038. https://jdih.esdm.go.id/.
[5] Roblek, V., Meško, M., Krapež, A. (2016). A complex view of industry 4.0. SAGE Open, 6(2): 1-11. https://doi.org/10.1177/2158244016653987
[6] Vaidya, S., Ambad, P., Bhosle, S. (2018). Industry 4.0 – A glimpse. Procedia Manufacturing, 20: 233-238. https://doi.org/10.1016/j.promfg.2018.02.034
[7] Rojko, A. (2017). Industry 4.0 Concept: Background and Overview. IJIM, 11(5): 77-90.
[8] Kaunda, C.S., Kimambo, C.Z., Nielsen, T.K. (2014). A technical discussion on microhydropower technology and its turbines. Renewable and Sustainable Energy Reviews, 35: 445-459. https://doi.org/10.1016/j.rser.2014.04.035
[9] Pranoto, B., Aini, S.N., Soekarno, H., Zukhrufiyati, A., Rasyid, H. Al, Lestari, S. (2018). The potential of microhydro in irrigation area (case study in serayu opak river basin). Jurnal Irigasi, 12(2): 77-86. https://www.researchgate.net/publication/323963188_Potensi_Energi_Mikrohidro_di_Daerah_Irigasi_Studi_Kasus_di_Wilayah_Sungai_Serayu_Opak.
[10] Nandyal, S., Khamitkar, P., Joshi, P. (2019). Agridrone: Automation of Agriculture using IoT. International Journal of Innovative Science and Research Technology, 4(6): 7579.
[11] Arendt, A., Ilikchyan, A., Warcup, R. (2019). An exploratory study of awareness and perceived relevance of GIS among general contractors in the USA. Journal of Information Technology in Construction, 24: 341-359.
[12] Wang, Q., Ikiugu, M.M.M., Kinoshita, I. (2014). A GIS-based approach in support of spatial planning for renewable energy: A case study of Fukushima, Japan. Sustainability, 6: 2087-2117. https://doi.org/10.3390/su6042087
[13] Murayama, Y., Estoque, R.C. (2011). Creating a digital elevation model (DEM): A GIS lecture tutorial. http://giswin.geo.tsukaba.ac.jp/.
[14] Alatas, M., Budiastuti, M.T.S., Gunawan, T., Setyono, P., Burlakovs, J., Yandri, E. (2020). The identification of micro-hydro power plants potential in irrigation areas based on unmanned air vehicle (UAV) image processing. E3S Web of Conferences, 190: 1-7. https://doi.org/10.1051/e3sconf/202019000024
[15] Uysal, M., Toprak, A.S., Polat, N. (2015). DEM generation with UAV Photogrammetry and accuracy analysis in Sahitler hill. Measurement, 73: 539-543. https://doi.org/10.1016/j.measurement.2015.06.010
[16] Shobana, M.EK.S., Dinesh Babu, D.C.E.S., Hemaraj, R.V, Isha, S. (2019). Comparison on measurement of a building using total station, ArcGIS and google earth. International Research Journal of Engineering and Tcehnology (IRJET), 6(6): 1082-1084.
[17] Basuki, S. (2018). Ilmu Ukur Tanah (Revision E). Gadjah Mada University Press
[18] Burgan, H.I., Aksoy, H. (2020). Monthly flow duration curve model for ungauged river basins. Water, 12: 1-19.
[19] Baltas, E.A. (2012). Development of a regional model for hydropower potential in western Greece. Global NEST Journal, 14(4): 442-449.
[20] Perzyna, G. (2016). Field manual-current meter streamflow measurement by wading. ECOWAS Centre for Renewable Energy and Energy Efficiency (ECREEE). http://www.ecowrex.org/sites/default/files/field_manual_current_meter_streamflow_measurement_by_wading.pdf.
[21] PUPR. (2017). Buku Informasi Statistik 2017. Kementerian PUPR. https://data.pu.go.id/sites/default/files/Informasi%20Statistik%20PUPR%20Tahun%202017_1.pdf.
[22] Sánchez, A.S., Torres, E.A., Kalid, R.A. (2015). Renewable energy generation for the rural electri fi cation of isolated communities in the Amazon Region. Renewable and Sustainable Energy Reviews, 49: 278-290. https://doi.org/10.1016/j.rser.2015.04.075
[23] Regulation of the Minister of Public Works and Public Housing of the Republic of Indonesia Number 14 / PRT / M / 2015 concerning Criteria and Determination of the Status of Irrigation Areas, (2015). https://sda.pu.go.id/assets/files/PermenPUPR14-2015.pdf.
[24] Sasak, J., Gallay, M., Kanuk, J., Hofierka, J., Minar, J. (2019). Combined use of terrestrial laser scanning and UAV photogrammetry in mapping alpine terrain. Remote Sensing, 11. https://doi.org/10.3390/rs11182154
[25] Rosca, S., Suomalainen, J., Bartholomeus, H., Herold, M. (2018). Comparing terrestrial laser scanning and unmanned aerial vehicle structure from motion to assess top of canopy structure in tropical forests. Interface Focus, 8. https://doi.org/10.1098/rsfs.2017.0038
[26] Ardizzon, G., Cavazzini, G., Pavesi, G. (2014). A new generation of small hydro and pumped-hydro power plants: Advances and future challenges. Renewable and Sustainable Energy Reviews, 31: 746-761. https://doi.org/10.1016/j.rser.2013.12.043
[27] European Union Programme. (2014). COMPARATIVE STUDY OF SMALL HYDROPOWER STATIONS (pp. 1–57). European Union. https://www.researchgate.net/profile/Ammar_Kamel/project/Small-dams-for-electric-power-production/attachment/57f40d0608aee56192d1f474/AS:413560481042432@1475611910817/download/Comparative+study.pdf.
[28] ESHA. (2004). In Guide on How to Develop a Small Hydropower PLant. European Small Hydropower Association. http://www.canyonhydro.com/images/Part_1_ESHA_Guide_on_how_to_develop_a_small_hydropower_plant.pdf.
[29] Kadier, A., Kalil, M.S., Pudukudy, M., Hasan, H.A., Mohamed, A., Hamid, A.A. (2018). Pico hydropower (PHP) development in Malaysia: Potential, present status, barriers and future perspectives. Renewable and Sustainable Energy Reviews, 81: 2796-2805. https://doi.org/10.1016/j.rser.2017.06.084
[30] Quaranta, E., Revelli, R. (2018). Gravity water wheels as a micro hydropower energy source: A review based on historic data, design methods, efficiencies and modern optimizations. Renewable and Sustainable Energy Reviews, 97: 414-427. https://doi.org/10.1016/j.rser.2018.08.033
[31] Zhou, D., Deng, Z. (2017). Ultra-low-head hydroelectric technology: A review. Renewable and Sustainable Energy Reviews, 78: 23-30. https://doi.org/10.1016/j.rser.2017.04.086
[32] Chen, J., Lu, W., Hu, Z., Lei, Y., Yang, M. (2018). Numerical studies on the performance of a drag-type vertical axis water turbine for water pipeline. Journal of Renewable and Sustainable Energy, 10. https://doi.org/10.1063/1.5027551