Hasdi Aimon | Anggi Putri Kurniadi* | Syamsul Amar
© 2021 IIETA. This article is published by IIETA and is licensed under the CC BY 4.0 license (http://creativecommons.org/licenses/by/4.0/).
OPEN ACCESS
This study aims to fill the gap of previous research in the form of developing studies between fuel oil consumption, green economic growth and environmental degradation in 6 selected Asia Pacific countries (Australia, China, India, Indonesia, South Korea and Thailand) by considering the determinants during the period 2007-2020 by using a simultaneous panel model approach. The important findings of this study are grouped into 3 analytical models. First, green economic growth, environmental degradation and cleaner energy have a negative effect on fuel oil consumption, while GDP per capita has a positive effect. Second, fuel oil consumption, environmental degradation and militarization have a negative effect on green economic growth, while technological innovation and cleaner energy have a positive effect. Third, green economic growth and cleaner energy have a negative effect on environmental degradation, while fuel oil consumption, health expenditure and poverty have a positive effect. The policy implication that can be applied is to utilize renewable energy such as biofuel oil to implement a clean development mechanism because the increasing demand for fuel oil consumption will result in CO2 emissions which are a factor causing increased environmental degradation and decreased green growth in a country.
fuel oil consumption, green economic growth, environmental degradation
Human life cannot be separated from the surrounding environment, be it the natural environment or the social environment. Along with the times, the world's population also continues to increase every year, so that the increase in energy needs is unavoidable. Currently, almost all the energy needs that humans use are obtained from the conversion of fossil energy sources, such as energy for power generation, industry and various means of transportation. Fossil fuels are formed from natural processes such as the anaerobic decomposition of the remains of organisms including phytoplankton and zooplankton that settle to the bottom of the ocean or lake in large quantities, over millions of years. In addition, fossil fuels are non-renewable resources because the process of formation takes millions of years, while reserves in nature are depleted much faster than the process of formation.
The production and use of fossil fuels raises environmental concerns. The continuous use of fossil energy will have a negative impact on the environment and the health of living things. This is because fossil fuels such as coal, oil and natural gas contain a high percentage of carbon. Carbon gas is a colorless gas which is a compound of carbon with oxygen, does not burn and is soluble in water. If the carbon gas is released into the air it will combine with oxygen and form carbon dioxide gas. Carbon dioxide is one of the greenhouse gases that increases radiation and contributes to global warming, which causes the average temperature of the earth's surface to increase.
In general, the exploitation and use of energy sources from nature to meet human needs will always have a negative impact on the environment because the use of various kinds of fossil fuels to fuel industrial and transportation equipment has made a major change in the world's climatic conditions. The use of these fuels has increased the concentration of greenhouse gases, namely carbon dioxide (CO2), methane (CH4), nitrogen oxides (NOx), sulfur dioxide (SO2) and three industrial gases containing fluorine (HFC, PFC, and SF6). This increases the amount of radiation trapped in the earth's atmosphere.
The emission of NOx and SO2 gases into the air can react with water vapor in the clouds and form nitric acid (HNO3) and sulfuric acid (H2SO4) which are strong acids. If it rains from the cloud, the rainwater is acidic, which is known as acid rain. The increase in GHG will cause the phenomenon of global warming, namely an increase in the average temperature on the earth's surface. Global warming itself will result in climate change, namely changes in climate elements such as rising temperatures on the earth's surface, increased evaporation in the air, changes in rainfall patterns and air pressure which will ultimately change the pattern of the world's climate.
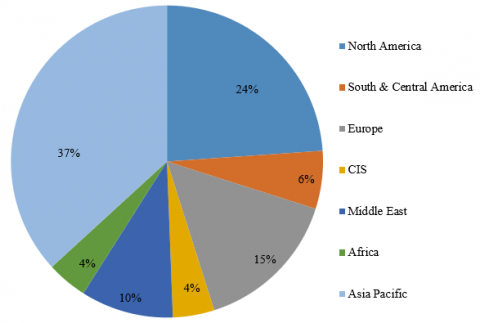
Based on the previous explanation, the current trend of public consumption in the energy sector is still dominated by fuel oil consumption as happened in the Asia Pacific group of countries, especially for China and India when compared to other groups of countries. These conditions can be seen in the Figure 1.
Based on the information in Figure 1, it can be seen that the contribution of fuel oil consumption is dominated by the Asia Pacific group of countries at 37% of the total fuel oil consumption in the world, so this proves that the Asia Pacific group of countries has the potential to increase the rate of growth of CO2 emissions due to high fuel oil consumption. has caused many problems on environmental quality and economic growth. These conditions can be seen in the Figure 2.
Figure 1. Contribution of fuel oil consumption in various groups of countries to the world in 2020. Source: [1]
Figure 2. Contribution of CO2 emissions in various groups of countries to the world in 2020. Source: [1]
Based on the information in Figure 2, it can be seen that the contribution of CO2 emissions is also dominated by the Asia Pacific group of countries with 51% of the total CO2 emissions in the world, so that Asia Pacific is a group of countries that have the potential to increase environmental degradation at the world level.
Previous researchers have analyzed this study, but there are developments in the study every year, as well as for the study that we will do. A study of energy consumption, economic growth, and CO2 emissions in Middle Eastern and North African countries during the period 1981-2005 using the cointegration test, found that in the long term energy consumption has a significant positive impact on CO2 emissions. In addition, real GDP shows a quadratic relationship with CO2 emissions for the region as a whole [2]. The same study for the case in Indonesia during the period 1971-2007, but they updated their research methodology using the Granger causality test, found contrasting results that the absence of this relationship indicates that energy conservation strategies do not produce the desired effect on reducing emissions and Indonesia should not unleash economic growth [3]. Furthermore, this study continues to be developed in the research methodology section using a simultaneous equation approach and ECM which studies the interaction of energy, environment, and economy in Iran during the 1974-2012 period. It was found that CO2 emissions per capita, GDP, energy consumption showed the strongest interactions in the system. equality in the long run. In addition, trade openness, labor force, financial development and urbanization show the most decisive effects in the short term [4]. A different study of economic growth indicators and research methodologies that analyzes the effect of energy consumption on green economic growth in China during the 1997-2016 period by using path analysis to see the direct and indirect effects on the rate of green growth given by several ratios of energy consumption and the relationship between them is explored, it is found that consumption of natural gas and other energy consumption are the two main drivers of green growth, whereas consumption of coal and oil hinders green growth [5]. Previous studies were carried out again which analyzed the effects of economic growth, energy consumption and CO2 emissions for developed, developing and MENA during the period 2001-2017 which differed from previous research in terms of research methodology, namely the application of the System generalized method of moments approach. that economic growth increases with the increase in energy consumption in developed and developing countries while in MENA countries it decreases, CO2 emissions increase in all countries due to increased energy consumption. Energy consumption is increasing in all countries but economic growth is increasing in all countries except MENA due to increased CO2 emissions. CO2 emissions are increasing while energy consumption is decreasing in developed countries and MENA but energy consumption is increasing and CO2 emissions are decreasing in developing countries due to increased economic growth [6]. After that, a green growth study was conducted again for the period 1980-2017 in Turkey using a different ARDL methodology than before, it was found that cleaner energy and technological innovation are the driving factors in promoting green growth in the long term, while militarization is detrimental to growth green economy in the long run [7]. Recent research analyzing specific indicators of oil consumption, namely fuel oil in Indonesia during the period 1988 to 2018 using a different VECM approach from the previous one, found that imports and prices of fuel oil had a significant effect on fuel consumption in Indonesia. In particular, imports and fuel prices upset the balance of fuel consumption in the short term, although, in the long run, consumption returns to balance. In addition, fuel consumption and exchange rates also have a significant effect on fuel imports in Indonesia. Specifically, the exchange rate disrupts fuel imports in the short term, then returns to equilibrium in the long run [8].
The relationship between energy, environmental degradation and economic growth has been studied extensively in the previous literature. Some empirical literature studies investigate multi-country cases using panel data and others investigate single-country cases using time series analysis. Analysis of the effect of energy consumption, urbanization and economic globalization on environmental pollution and the validity of the EKC hypothesis in Turkey for the period 1970-2010 using the ARDL approach, found that economic growth, energy consumption, urbanization rate, globalization and CO2 emissions are cointegrated [9].
Empirical investigation of the impact of energy consumption and economic growth on environmental degradation in Asia for the period 1991-2013 using cointegration tests, fully modified OLS, and panel causality, found that cointegration tests confirm the long-term relationship between environmental degradation and energy consumption and economic growth along with financial development, trade openness, capital stock, and urbanization as control variables. In addition, FMOLS results confirm that economic growth and energy consumption have a positive and significant impact on environmental degradation. In addition, panel causality through VECM verified that a two-way causal relationship was found between energy consumption and economic growth and environmental degradation [10].
A study of energy consumption, environmental degradation, economic growth and financial development in the world for the period 1990-2017 using a dynamic simultaneous equation panel approach, it was found that financial development, economic growth, energy consumption, and carbon emissions influence each other but with a high distribution of pollution, except energy consumption which reduces financial development [11].
Investigating the causal relationship between carbon dioxide emissions, energy consumption, renewable energy, population growth, and economic growth in the five ASEAN members (Indonesia, Myanmar, Malaysia, the Philippines, and Thailand) for the period 1971-2014 using the VECM approach, it was found that no there is a long-term relationship between the variables of interest in the Philippines and Thailand, but there is a relationship in Indonesia, Myanmar, and Malaysia. The EKC hypothesis was observed in Myanmar but not in Indonesia and Malaysia. Also, Granger causality among these important variables varies greatly in the selected countries. There is no Granger causality between carbon emissions, energy consumption and renewable energy consumption reported in Malaysia, the Philippines, and Thailand. Indonesia experiences a unidirectional causal effect from economic growth on renewable energy consumption in both the short and long term and from economic growth on CO2 emissions and energy consumption [12].
Studying the dynamic causal relationship between pollutant emissions, energy consumption and output for a panel of 4 Asian countries (Malaysia, Myanmar, Thailand and Vietnam) for the period 1971-2005 using a panel causality approach, it was found that the two-way energy consumption-emission causality was strong. and energy consumption-output bidirectional long-term causality, together with both strong and short-term unidirectional causality of the respective emissions and energy consumption [13].
Analysis of the impact of urbanization on environmental degradation with economic growth, trade, and energy use in Indonesia for the period 1970-2018 using the ARDL approach, it was found that energy consumption creates environmental degradation while trade reduces carbon emission levels and urbanization has no significant effect on environmental levels [14].
An investigation of energy consumption, economic growth, and environmental degradation in 35 OECD countries for the period 2000-2014 using the GMM-PVAR approach, found that economic growth and energy consumption patterns are very important for improving environmental performance. In contrast to other empirical literature, this study finds that the economic development of a country or country and consumption patterns have begun to coagulate with the set environmental performance parameters [15].
Investigating the long-term relationship and short-term causality between energy consumption, CO2 and GDP in high and low-income countries for the period 1971-2014, it was found that the three variables were interrelated. This study provides a deeper understanding of the interaction between energy consumption, environmental degradation and economic growth across various national incomes to achieve sustainable development [16].
Studying the relationship between energy consumption, economic growth, and environmental degradation in Indonesia for the period 1965-2018 using the ARDL approach, it was found that there is a cointegration relationship between energy consumption, economic growth, gross fixed capital formation, trade openness, and environmental degradation. Empirical results in the long term show that energy consumption, economic growth, and trade openness have a positive relationship with environmental degradation. However, gross fixed capital formation was found to be negatively related to environmental degradation. This implies that gross fixed capital formation plays an important role in reducing environmental degradation in Indonesia [17].
Analysis of the effect of energy consumption, globalization, and economic growth on CO2 emissions in the BRICS region (Brazil, Russian Federation, India, China, and South Africa) for the period 1989-2019 using FMOLS and DOLS approaches, it was found that energy consumption is the main source of environmental degradation. in the region. On the other hand, globalization has a negative and significant impact on carbon emissions, which has implications for improving the quality of the environment [18].
Considering the literature discussed, this study aims to fill the gap of previous research where most previous studies focused on analyzing the relationship between energy consumption, economic growth and environmental degradation without considering the exogenous variables that influence it. Meanwhile, our research replaces the concept of economic growth into green economic growth which has been ignored so far. In fact, the analysis of green economic growth is very important to determine the policy direction to achieve sustainable energy. Finally, it is necessary to do a simultaneous analysis to find out how the effect of exogenous variables on fuel oil consumption, green economic growth and environmental degradation in 6 Asia Pacific countries during the period 2007-2020 using a simultaneous panel model approach.
2.1 Data and variable
The type of data in this study is secondary data published by certain agencies. The data used is panel data with a total time series of 14 years during the period 2007 to 2020 and the number of cross sections is 6 selected Asia Pacific countries, namely Australia, China, India, Indonesia, South Korea and Thailand.
The variables in this study consisted of endogenous and exogenous variables. Endogenous variables are variables that are influenced by changes in exogenous variables, which consist of fuel oil consumption, green economic growth and environmental degradation. While exogenous variables are variables that undergo changes that affect endogenous variables, which consist of trade openness, GDP per capita, technological innovation, cleaner energy, militarization, health expenditure and poverty. However, all endogenous variables used in this study also act as exogenous variables in other equations. The relationship between variables in this study is shown in Figure 3 below.
Based on the conceptual framework of the study in Figure 3 above, the variables used in this study were measured using certain indicators which are summarized in Table 1.
Table 1. Operational definition of research variables
|
Variable |
Indicator |
Source |
|
Fuel Oil Consumption (FOC) |
Consumption of fuel oil with the unit of measurement used is the oil equivalent of one thousand barrels per day |
Internastional Energy Agency |
|
Green Economic Growth (GEG) |
Economic growth separated from negative externalities to the environment, such as depreciation of natural resources and the cost of CO2 emission damage, the unit of measurement is a percentage |
World Bank |
|
Environmental Degradation (ED) |
CO2 emissions from the consumption of fuel derived from petroleum as an energy source with the unit of measurement is kilo tons |
Internastional Energy Agency |
|
Trade Openness (TO) |
Total exports and imports of goods and services measured as a share of GDP with the unit of measurement being a percentage of GDP |
World Bank |
|
GDP Per Capita (GPC) |
The growth rate of GDP divided by the midyear population with the unit of measurement is a percentage |
World Bank |
|
Technological Innovation (TI) |
A patent application submitted through a patent cooperation agreement procedure to obtain exclusive rights to an environmentally friendly technological invention with a unit of measurement is a citizen patent application |
World Bank |
|
Cleaner Energy (CE) |
The contribution of renewable energy to the total final energy consumption with the unit of measurement is a percentage |
Internastional Energy Agency |
|
Militarization (M) |
Capital expenditure for the armed forces with the unit of measurement is a percentage of GDP |
World Bank |
|
Helath Expenditure (HE) |
Current level of health spending expressed as a percentage of GDP |
World Bank |
|
Poverty (P) |
Percentage of population living below the national poverty line with the unit of measurement is the percentage of the population |
World Bank |
Figure 3. Research conceptual framework
2.2 Analysis model
Based on the conceptual framework in Figure 5, this study has four types of analytical models, consisting of fuel oil consumption, green economic growth and environmental degradation. The econometric equations for the entire model are shown in Eqns. (1) to (3) below:
$\log \left(\mathrm{FOC}_{\mathrm{it}}\right)=\alpha_{1.0}+\alpha_{1.1} \mathrm{GEG}_{\mathrm{it}}+\alpha_{1.2} \log \left(\mathrm{ED}_{\mathrm{it}}\right)+\alpha_{1.3} \mathrm{TO}_{\mathrm{it}}+\alpha_{1.4} \mathrm{GPC}_{\mathrm{it}}+\alpha_{1.5} \mathrm{CE}_{\mathrm{it}}+\varepsilon_{1 \mathrm{it}}$ (1)
$\mathrm{GEG}_{\mathrm{it}}=\alpha_{2.0}+\alpha_{2.1} \log \left(\mathrm{FOC}_{\mathrm{it}}\right)+\alpha_{2.2} \log \left(\mathrm{ED}_{\mathrm{it}}\right)+\alpha_{2.3} \log \left(\mathrm{TI}_{\mathrm{it}}\right)+\alpha_{2.4} \mathrm{CE}_{\mathrm{it}}+\alpha_{2.5} \mathrm{M}_{\mathrm{it}}+\varepsilon_{2 \mathrm{it}}$ (2)
$\log \left(\mathrm{ED}_{\mathrm{it}}\right)=\alpha_{3.0}+\alpha_{3.1} \log \left(\mathrm{FOC}_{\mathrm{it}}\right)+\alpha_{3.2} \mathrm{GEG}_{\mathrm{it}}+\alpha_{3.4} \mathrm{CE}_{\mathrm{it}}+\alpha_{3.5} \mathrm{HE}_{\mathrm{it}}+\alpha_{3.5} \mathrm{P}_{\mathrm{it}}+\varepsilon_{3 \mathrm{it}}$ (3)
where: α is the parameter; i is the cross section; t is the time series; and ε is the error term.
2.3 Data analysis technique
This study used a simultaneous panel model approach to achieve the predetermined research objectives. The explanation of the econometric stages of the model approach included:
2.3.1 Panel analysis
Panel regression is a panel data analysis which is a combination of time series and cross sectional data consisting of:
First, the Common Effect Model (CEM) is the simplest panel data model approach because it only combines time series and cross section data. This model does not pay attention to the time or country dimensions, so it is assumed that the behavior of data in a country is the same in various time periods.
Second, the Fixed Effect Model (FEM) assumes that differences between countries can be accommodated from differences in interceptions. To estimate the data, the FEM panel uses dummy variable techniques to capture intercept differences between countries, but the slop is the same between countries.
Third, the Random Effect Model (REM) estimates panel data where the disturbance variables may be interrelated over time and between countries. In the REM model, the specific effects of each country are treated as part of the error component which is random and uncorrelated with the observed explanatory variables.
Furthermore, among the three models, it is necessary to select the most appropriate panel analysis model to be interpreted is the model was obtained through the following tests:
First, the Chow test was conducted to select whether CEM or FEM was the most appropriate model to be used. The decisions were taken by comparing the p-values of the cross-sectional chi-square at α = 0.05.
Second, the Hausman test would be carried out if the Chow test results chose FEM as the best model. Then, further testing was carried out regarding whether FEM or REM was the most appropriate model to be used. The decisions were taken by comparing the p-values of random cross-section at α = 0.05.
Third, the Langrange multiplier test would be carried out if the Hausman test results chose REM as the best model. Then, further testing was carried out regarding whether REM or CEM was the most appropriate model to be used. The decisions were taken by comparing the p-values of the cross-sectional test hypothesis for Breusch-Pagan at α = 0.05.
2.3.2 Simultaneous equation analysis
Simultaneous equation is a model that has more than one equation that is interrelated and has a causal relationship between endogenous and exogenous variables, so that a variable can be expressed as an endogenous or exogenous variable in another equation. In a system of simultaneous equations containing two or more equations, it is not possible to get the numerical value of each parameter in each equation because these equations cannot be distinguished by observation or are very similar to one another. Therefore, it is necessary to carry out an identification test using order condition shown in Eq. (4) below:
K – k ≥ m – 1 (4)
where: M is the number of endogenous variables in the model; m is the number of endogenous variables in the equation; K is the number of predetermined variables in the model; and k is the number of the predetermined variables in the equation.
If K – k = m – 1, this equation is identified. It is followed by the simultaneous equation estimation of an indirect least square (ILS) method.
If K – k > m – 1, this equation is overidentified. It is followed by the simultaneous equation estimation of a two-stage least square (2SLS) method.
If K – k < m – 1, this equation is unidentified.
The equation that can be solved using the simultaneous equation system is the equation whose results of order condition are identified and overidentified.
3.1 Panel analysis results
Prerequisites in panel analysis require selecting the most appropriate panel data model for interpretation. After performing the Chow and Hausman tests, the overall equation in this study uses FEM as the best model, the results of which are shown in Tables 2 and 3.
The information in Table 2 is that all models have prob values. cross-section chi-square is small from = 0.05, where FEM is the most appropriate model to be used in all analysis models. However, it is necessary to proceed to the Hausman test to determine the right model between FEM and REM, the results of which are shown in Table 3.
The information in Table 3 is that all models have prob values. The chi-square cross-section is small from = 0.05, where FEM is the most appropriate model to be used in all analytical models without proceeding to the Langrange multiplier test.
Table 2. Chow test results panel analysis model
|
Equation |
Prob. Cross-Section Chi-Square |
|
FOC |
0.0000 |
|
GEG |
0.0018 |
|
ED |
0.0324 |
Table 3. Hausman test results panel analysis model
|
Equation |
Prob. Cross-Section Random |
|
FOC |
0.0246 |
|
GEG |
0.0178 |
|
ED |
0.0493 |
3.2 Simultaneous equation analysis results
The prerequisite for simultaneous equation analysis requires an identification test using the order conditions shown in Eqns. (5) to (7) below:
Equation FOC $\rightarrow 7-3>3-1$
$4>2$ (overidentified) (5)
Equation GEG $\rightarrow 7-3>3-1$
$4>2$ (overidentified) (6)
Equation $\mathrm{ED} \rightarrow 7-3>3-1$
$4>2$ (overidentified) (7)
The identification test above informs that all the analytical models used in this study were estimated using the two-stage least square (TSLS) method because all equations are overidentified.
Based on the final results of the panel analysis and simultaneous equation analysis that have been carried out in accordance with the predetermined stages, the interpretation of the simultaneous panel model analysis for each analysis model is shown in Eqns. (8) to (10) below:
$\log \left(\mathrm{FOC}_{\mathrm{it}}\right)=5.90048-0.07265 \mathrm{GEG}_{\mathrm{it}}$
$(0.0000)(0.0141)$
$-0.21602 \log \left(\mathrm{ED}_{\mathrm{it}}\right)-0.00069 \mathrm{TO}_{\mathrm{it}}$
$(0.0086)(0.0918)$
$+0.08804 \mathrm{GPC}_{\mathrm{it}}-0.00546 \mathrm{CE}_{\mathrm{it}}$
$(0.0052)(0.0651)$
$+\varepsilon_{1 \mathrm{it}}$ (8)
where, the value in ( ) is p.
Eq. (8) summarizes the estimation results of the simultaneous panel model for the fuel oil consumption equation. Green economic growth, environmental degradation and GDP per capita have a significant effect on = 0.01 on fuel oil consumption. Meanwhile, trade openness and cleaner energy have a significant effect on = 0.10 on fuel oil consumption.
Green economic growth increases by 1 percent, so fuel oil consumption will decrease by 0.07265 percent. Green economic growth is economic growth that is environmentally friendly and socially inclusive. Green economic growth is achieved if the inputs used in the production process are environmentally friendly. This is due to the calculation component of green economic growth considering the cost of natural resource depreciation and the cost of CO2 emission damage, so that the increase in green economic growth does not use non-renewable energy inputs such as fuel oil consumption because it causes a reduction in the number of stock of non-renewable resources and raises costs. environmental damage to be paid. So that an increase in green economic growth will have an impact on a decrease in fuel oil consumption, which is the finding of the novelty of this research.
Environmental degradation increases by 1 percent, then fuel oil consumption will decrease by 0.21602 percent. Environmental degradation is a decrease in environmental quality due to development activities which are characterized by not taking into account environmental components so as to endanger environmental quality. Increasing environmental degradation will have implications for a decrease in the carrying capacity of the environment resulting in an imbalance in the ecosystem, so this condition requires policies to overcome environmental degradation as an effort to maintain the carrying capacity of the environment, including not using non-renewable energy such as fuel oil consumption because it causes the cost of resource depreciation. nature and the cost of CO2 emission damage, so that increasing environmental degradation will have an impact on reducing fuel oil consumption, which is consistent with the results of research by Bozkurt and Akan [19], their study examines economic growth, CO2 emissions and energy consumption relationship in Turkey by using cointegration test. For this purpose 1960-2010 periods taken and annual data of Gross Domestic Product, carbon dioxide emissions and energy consumption are used. The obtained empirical results from this paper indicated that CO2 emissions effect negatively economic growth and energy consumption.
Trade openness increases by 1 percent, so fuel oil consumption will decrease by 0.00069 percent. Trade openness facilitates the movement and exchange of goods and services between countries for both consumption and production purposes. As long as the consumption and production of tradable goods and services involves the effective use of energy. Trade openness can have a significant impact on total energy demand, especially renewable energy, so that an increase in trade openness will have an impact on decreasing fuel oil consumption, which is consistent with the results of research by Ito [20], their research hypothesizes the asymmetrical effects of both economic growth and trade openness on the energy consumption of Egypt from 1971-2014. Trade openness may support the economic growth of any country but its environmental effects due to increasing energy consumption cannot be ignored. The increasing energy consumption, as results of increasing economic growth and/or trade openness, may have environmental consequence. Therefore, they recommend the Egyptian government to diversify the energy consumption from fossil fuel sources.
GDP per capita increases 1 percent, then fuel oil consumption will decrease by 0.08804 percent. GDP per capita acts as a benchmark for the economy, especially welfare and development, so that it becomes one of the important components in the economy. If a country has a high GDP per capita rate, then the country will be seen as a prosperous country, which is consistent with the results of research by Hanif [21], their findings are based on economic theory that the higher the income, the greater the expenditure for consumption such as consumption of fuel oil, so that an increase in GDP per capita will have an impact on increasing of fuel oil consumption.
Cleaner energy increases 1 percent, then fuel oil consumption will decrease by 0.00556 percent. Cleaner energy is an effort to utilize renewable energy sources and use efficient energy technology with an energy-saving culture, which is consistent with the results of research by Qamruzzaman and Wei [22], their findings are high cleaner energy occurs if it is supported by the large contribution of renewable energy to total final energy consumption, so that an increase in cleaner energy will have an impact on reducing fuel oil consumption.
$\mathrm{GEG}_{\mathrm{it}}=4.44175-1.98408 \log \left(\mathrm{FOC}_{\mathrm{it}}\right.$
$(0.0431)(0.0342)$
$-0.60887 \log \left(\mathrm{ED}_{\mathrm{it}}\right)+1.21188 \log \left(\mathrm{TI}_{\mathrm{it}}\right)$
$(0.0178)(0.0825)$
$+0.07787 \mathrm{CE}_{\mathrm{it}}-0.64625 \mathrm{M}_{\mathrm{it}}$
$(0.0360)(0.0096)$
$+\varepsilon_{2 \mathrm{it}}$ (9)
where, the value in ( ) is p.
Eq. (9) summarizes the estimation results of the simultaneous panel model for the green economic growth equation. Militarization has a significant effect on = 0.01 on green economic growth. Furthermore, fuel oil consumption, environmental degradation and cleaner energy have a significant effect on = 0.05 on green economic growth. Meanwhile, technological innovation has a significant effect on = 0.10 on green economic growth.
Fuel oil consumption increases by 1 percent, so green economic growth will decrease by 1,98408 percent. Fuel oil is one type of non-renewable energy because it is obtained from natural resources whose formation time is up to millions of years, so if these resources are continuously used it will take a very long time to replace them. Initially, fuel oil was very abundant, so humans continued to exploit it on a large scale. Human dependence on non-renewable energy such as fuel oil is increasing when the number of private vehicles continues to increase which has implications for environmental damage, namely high air pollution. Furthermore, the green growth calculation component considers the cost of natural resource depreciation and the cost of CO2 emission damage, where fuel oil consumption will cause both types of costs, which is the finding of the novelty of this study.
Environmental degradation increases by 1 percent, then green economic growth will decrease by 0.60887 percent. Environmental degradation is a decrease in environmental quality due to development activities which are characterized by not taking into account environmental components so as to endanger environmental quality. Environmental degradation will lead to a reduction in the number of stocks of non-renewable resources and the cost of environmental damage that must be paid. Furthermore, the green growth calculation component considers the cost of natural resource depreciation and the cost of CO2 emission damage, so that environmental degradation will cause both types of costs, which is the finding of the novelty of this study.
Technological innovation increases 1 percent, then green economic growth will increase by 1,21188 percent. Technological innovation is an important foundation in reducing carbon emissions through increasing efficiency and productivity of the use of non-renewable natural resources to be used efficiently and optimally. Technological innovation is one of the driving factors in encouraging sustainable development because efficient and environmentally friendly technology can harmonize development activities and the environment simultaneously. Furthermore, the calculation component of green economic growth considers the cost of natural resource depreciation and the cost of CO2 emission damage, where technological innovation will tend to reduce both types of costs, which is consistent with the results of research by Sohag et al. [7], their study examines the role of cleaner energy, technological innovation and militarization on green economic growth under different economic conditions in the context of Turkey. To this end, they apply Autoregressive Distributed Lags (ARDL) under the assumption of symmetric and asymmetric adjustment approaches to analyse a time series data over the period 1980–2017. Their analysis demonstrates that technological innovation is driving factors in promoting green economic growth in the long-term.
Cleaner energy increases 1 percent, then green economic growth will increase by 0.07787 percent. Cleaner energy is an effort to utilize renewable energy sources and use efficient energy technology with an energy-saving culture. High cleaner energy occurs when it is supported by the large contribution of renewable energy to total final energy consumption, so that an increase in cleaner energy will have an impact on increasing green economic growth, which is consistent with the results of research by Sohag et al. [7], cleaner energy is driving factors in promoting GEG in the long-term.
Militarization increases 1 percent, then green economic growth will decrease by 0.64625 percent. Military bases require maintenance that relies on the consumption of non-renewable natural resources and relies on intensive equipment from wasting non-renewable energy that results in environmental degradation such as the greenhouse effect and carbon emissions. Furthermore, the calculation component of green economic growth considers the cost of natural resource depreciation and the cost of damaging CO2 emissions, so militarization will tend to increase both types of costs, which is consistent with the results of research by Sohag et al. [7], militarization is found to be detrimental for green economic growth in the Turkish economy in the long run.
$\log \left(\mathrm{ED}_{\mathrm{it}}\right)=-2.62222+0.47698 \log \left(\mathrm{FOC}_{\mathrm{it}}\right)$
$(0.0343)(0.0007)$
$-0.03375 \mathrm{GEG}_{\mathrm{it}}-0.02617 \mathrm{CE}_{\mathrm{it}}$
$(0.0163)(0.0092)$
$+0.089918 \mathrm{HE}_{\mathrm{it}}+0.04553 \mathrm{P}_{\mathrm{it}}$
$(0.0441)(0.0038)$
$+\varepsilon_{3 \mathrm{it}}$ (10)
where, the value in ( ) is p.
Eq. (10) summarizes the estimation results of the simultaneous panel model for the environmental degradation equation. Fuel oil consumption, cleaner energy and poverty have a significant effect on = 0.01 on environmental degradation. Furthermore, green economic growth and health expenditure have a significant effect on = 0.05 on environmental degradation.
Fuel oil consumption increases by 1 percent, then environmental degradation will increase by 0.47698 percent. Initially, non-renewable energy was very abundant, so humans continued to exploit it on a large scale. Human dependence on non-renewable energy such as fuel oil is increasing when the number of private vehicles continues to increase which has implications for increasing emissions that have the potential to cause environmental degradation. So that the increase in fuel oil consumption will have an impact on increasing environmental degradation, which is consistent with the results of research by Shahbaz et al. [23], the use of non-renewable resources emits a high quantity of CO2 into environment, leading to a greenhouse effect, to reduce CO2 emissions all countries have shifted to use renewable energy sources. The empirical results suggest that international cooperation agencies, energy organizers, governments, and associated bodies must act together in increasing renewable energy investment for low carbon growth in most of these economies.
Green economic growth increases by 1 percent, then environmental degradation will decrease by 0.03375 percent. Green economic growth is an environmentally friendly and socially inclusive economic growth that is achieved if the inputs used in the production process do not cause a reduction in the amount of stock of non-renewable resources and do not incur environmental damage costs that must be paid. This is because the components of the calculation of green economic growth consider the cost of natural resource depreciation and the cost of damaging CO2 emissions, which are the findings of the novelty of this study.
Cleaner energy increases 1 percent, then environmental degradation will decrease by 0.02617 percent. Cleaner energy is an effort to utilize renewable energy sources and the use of efficient energy technology with an energy-saving culture which has implications for the use of environmentally friendly energy and does not incur environmental damage costs that must be paid and has implications for environmental degradation, which are the findings of the novelty of this study.
Health expenditure increases by 1 percent, then environmental degradation will increase by 0.0441 percent. Reductions in health care spending through dietary changes can also reduce CO2 emissions. A healthy diet is associated with fewer non-communicable diseases and this has a positive impact on decreasing HCE per capita. The food system is linked to health care spending and has a positive impact on reducing CO2 emissions. In the absence of a rich literature, it is assumed that higher health care spending increases energy demand and can indirectly increase CO2 emissions in the long term, which is consistent with the results of a study by Apergis et al. [24], their paper investigates the long-run dynamics between health care expenditure and environmental pollution across four global income groups. The analysis uses data from 178 countries, spanning the period 1995-2017. Panel estimationsare employed with unobserved heterogeneity, temporal persistence, and cross-sectional dependence using a model with common correlated effects. Their findings indicatethat low-carbon emissions and energy efficient health care services will significantly reduce future health care expenses.
Poverty increases 1 percent, then environmental degradation will increase by 0.04553 percent. The poor are very vulnerable to changes in the pattern of use of natural resources and changes in the environment. The main problems faced by the poor are limited access to natural resources and the declining quality of the environment, both as a source of livelihood and as a support for daily life. The increase in the number of poor people also occurs with the narrowing of land ownership and the loss of livelihood sources for the poor as a result of the decline in the quality of the environment, especially forests, seas, and mining areas. The poor are considered to be very dependent on the environment and natural resources to sustain their lives so that the environment and natural resources are still being exploited without regard to their sustainability, which is consistent with the results of research by Nwagbara et al. [25], they observed that there are three discernable debaters on the trajectory between poverty, environmental degradation and sustainable development namely: those who argue that the poor (the South) is the major cause of environmental degradation as a result of high population and increased pressure on environmental resources; those who contend that the high consumption propensity of the rich (the North) is the main factor in environmental degradation; and, those who argue that both the rich and the poor, in varying capacities, contribute to the unsustainability of the environment.
Based on the analysis conducted, this study concludes that the reduction in fuel oil consumption can be done through reducing environmental degradation and increasing green economic growth and cleaner energy. Furthermore, increasing green economic growth can be done through increasing technological innovation and cleaner energy as well as reducing fuel oil consumption, environmental degradation and militarization. Finally, the reduction of environmental degradation is carried out by increasing green economic growth and cleaner energy, as well as decreasing fuel oil consumption, health expenditure and poverty.
The effect of fuel oil consumption that is currently being used is actually bad for the world's living conditions, including CO2 emissions which cause greenhouse gas levels in the atmosphere to increase, resulting in an increase in the greenhouse effect and global warming. The CO2 absorbs sunlight (infrared radiation) reflected by the earth so that the atmospheric temperature rises. This can result in increased environmental damage, climate change and sea level rise which in general has the potential to reduce green economic growth.
The policy implication that can be taken by the government to maintain environmental quality and green economic growth due to the high demand for fuel oil consumption is the need to implement a clean development mechanism, so that every country can benefit from this mechanism by developing renewable energy. The development of renewable energy besides being able to reduce CO2 emissions also has several advantages, including reducing investment costs for developing countries, transferring technology and obtaining environmentally friendly technologies. The renewable energy that has the prospect to be developed is biofuels oil, which is still difficult to implement due to high investment costs. The investment costs that must be paid by the government are expected to receive subsidies through the clean development mechanism, so that the development of renewable energy can be economical and be able to compete with the development of fuel oil.
The limitation of this research is that it does not conduct a comparative study between consumption of renewable energy, consumption of non-renewable energy, green economic growth and environmental degradation in a single conceptual research framework, so that it is not visible how the role of renewable energy consumption can substitute for renewable energy consumption in achieving sustainable energy prospects. Based on these limitations, further researchers are expected to add the variable of renewable energy consumption as an endogenous variable in the study to see its impact on non-renewable energy consumption, green economic growth and environmental degradation as well as other exogenous variables.
This study is supported by research funding from the Ministry of Research and Technology / National Agency for Research and Innovation of the Republic of Indonesia for the fiscal year 2021.
[1] BP Statistical Review of World Energy. (2020). Statistical Review of World Energy globally consistent data on world energy markets, and authoritative publications in the field of energy. https://www.bp.com/en/global/corporate/energy-economics/statistical-review-of-world-energy.html.
[2] Arouri, M.E.H., Youssef, A.B., M'henni, H., Rault, C. (2012). Energy consumption, economic growth and CO2 emissions in Middle East and North African countries. Energy Policy, 45: 342-349. https://doi.org/10.1016/j.enpol.2012.02.042
[3] Jafari, Y., Othman, J., Nor, A.H.S.M. (2012). Energy consumption, economic growth and environmental pollutants in Indonesia. Journal of Policy Modeling, 34(6): 879-889. https://doi.org/10.1016/j.jpolmod.2012.05.020
[4] Taghavee, V.M., Aloo, A.S., Shirazi, J.K. (2016). Energy, environment, and economy interactions in Iran with cointegrated and ECM simultaneous model. Procedia Economics and Finance, 36: 414-424. https://doi.org/10.1016/S2212-5671(16)30056-9
[5] Xie, H. (2018). Influences energy consumption has on green GDP growth in China. In IOP Conference Series: Earth and Environmental Science, 113(1): 012125. https://doi.org/10.1088/1755-1315/113/1/012125
[6] Muhammad, B. (2019). Energy consumption, CO2 emissions and economic growth in developed, emerging and Middle East and North Africa countries. Energy, 179: 232-245. https://doi.org/10.1016/j.energy.2019.03.126
[7] Sohag, K., Taşkın, F.D., Malik, M.N. (2019). Green economic growth, cleaner energy and militarization: Evidence from Turkey. Resources Policy, 63: 101407. https://doi.org/10.1016/j.resourpol.2019.101407
[8] Aimon, H., Dwita, S., Susanto, P. (2020). The Relationship between Consumption and Imports of Fuel Oil in Indonesia (Hubungan antara Penggunaan dan Import terhadap Minyak Bahan Api di Indonesia). Jurnal Ekonomi Malaysia, 54(2): 125-136.
[9] Destek, M.A., Ozsoy, F.N. (2015). Relationships between economic growth, energy consumption, globalization, urbanization and environmental degradation in Turkey. International Journal of Energy and Statistics, 3(4): 1550017. https://doi.org/10.1142/S2335680415500179
[10] Jamel, L., Derbali, A. (2016). Do energy consumption and economic growth lead to environmental degradation? Evidence from Asian economies. Cogent Economics & Finance, 4(1): 1170653. https://doi.org/10.1080/23322039.2016.1170653
[11] Khan, S., Peng, Z., Li, Y. (2019). Energy consumption, environmental degradation, economic growth and financial development in globe: Dynamic simultaneous equations panel analysis. Energy Reports, 5: 1089-1102. https://doi.org/10.1016/j.egyr.2019.08.004
[12] Vo, D.H., Le, Q.T.T. (2019). CO2 emissions, energy consumption, and economic growth: New evidence in the ASEAN countries. Journal of Risk and Financial Management, 12(3): 145. https://doi.org/10.3390/jrfm12030145
[13] Phrakhruopatnontakitti, P., Watthanabut, B., Jermsittiparsert, K. (2020). Energy consumption, economic growth and environmental degradation in 4 Asian Countries: Malaysia, Myanmar, Vietnam and Thailand. International Journal of Energy Economics and Policy, 10(2): 529.
[14] Budiarty, I. (2020). Effects of energy consumption, economic growth and urbanization on Indonesian environmental quality. International Journal of Energy Economics and Policy, 10(6): 580-587.
[15] Kim, D.K. (2020). Energy consumption, economic growth, and environmental degradation in OECD countries. Asian Journal of Economics and Empirical Research, 7(2): 242-250.
[16] Kushairi, S., Nordin, S., Sek, S.K. (2020). Energy consumption, environmental degradation and growth: A panel data analysis. ASM Sci. J., 13: 1-6.
[17] Anwar, N., Elfaki, K.E. (2021). Examining the relationship between energy consumption, economic growth and environmental degradation Indonesia: Do capital and trade openness matter. Int. Journal of Renewable Energy Development, 10(4): 769-778.
[18] Rahman, H.U., Zaman, U., Górecki, J. (2021). The role of energy consumption, economic growth and globalization in environmental degradation: Empirical evidence from the BRICS region. Sustainability, 13(4): 1924. https://doi.org/10.3390/su13041924
[19] Bozkurt, C., Akan, Y. (2014). Economic growth, CO2 emissions and energy consumption: the Turkish case. International Journal of Energy Economics and Policy, 4(3): 484-494.
[20] Ito, K. (2017). CO2 emissions, renewable and non-renewable energy consumption, and economic growth: Evidence from panel data for developing countries. International Economics, 151: 1-6. https://doi.org/10.1016/j.inteco.2017.02.001
[21] Hanif, I. (2017). Economics-energy-environment nexus in Latin America and the Caribbean. Energy, 141: 170-178. https://doi.org/10.1016/j.energy.2017.09.054
[22] Qamruzzaman, M., Wei, J. (2020). The asymmetric relationship between financial development, trade openness, foreign capital flows, and renewable energy consumption: Fresh evidence from panel NARDL investigation. Renewable Energy, 159: 827-842. https://doi.org/10.1016/j.renene.2020.06.069
[23] Shahbaz, M., Raghutla, C., Chittedi, K.R., Jiao, Z., Vo, X.V. (2020). The effect of renewable energy consumption on economic growth: Evidence from the renewable energy country attractive index. Energy, 207: 118162. https://doi.org/10.1016/j.energy.2020.118162
[24] Apergis, N., Bhattacharya, M., Hadhri, W. (2020). Health care expenditure and environmental pollution: A cross-country comparison across different income groups. Environmental Science and Pollution Research, 27(8): 8142-8156. https://doi.org/10.1007/s11356-019-07457-0
[25] Nwagbara, E.N., Abia, R.P., Uyang, F.A., Ejeje, J.A. (2012). Poverty, environmental degradation and sustainable development: A discourse. Global Journal of Human Social Science Research, 12(11-C).