Luis Izquierdo-Horna* | José Zevallos | Miker Damazo | Deyvis Yanayaco
© 2021 IIETA. This article is published by IIETA and is licensed under the CC BY 4.0 license (http://creativecommons.org/licenses/by/4.0/).
OPEN ACCESS
In Peru, solid waste accumulation has been constant for decades and impacts 72% of local governments, affecting 42% of the population. These numbers show new tools are required to better understand this phenomenon and develop appropriate mitigation methods. In this light, this research proposes an exploratory analysis of the study population against the accumulation of solid waste. For this, the study proposes the segmentation of a specific population through a set of social indicators grouped into three categories of analysis (i.e., sociocultural, sociodemographic, and socioeconomic) and, in turn, assess the geographic proximity between each group of people segmented according to the parameters used for this study, and the informal points of accumulation of MSW. To segment the study population, an unsupervised classification model (i.e., K-means) was used. For methodological purposes, the Puente Piedra district was chosen as a case study. The results show that the predominant population is framed between the ages of 36 to 45, with an intermediate educational level (i.e., secondary school) and an approximate monthly income of $ 300. In addition, the predominant family structure includes up to four members living in the same household. Finally, it is observed that the behavior of people who live close as neighbors is similar and is also related to the geographic location of the dumps.
machine learning, Peru, social indicators waste management
The rapid and unplanned demographic growth of the communities, added to the lack of care-for-the-environment culture, have contributed to the increase in the generation of municipal solid waste (MSW) [1] since it causes more people with this mindset to damage the environment and there are barely any tools currently to avoid this damage in the long term. According to Kaza and colleagues [2], 90% of this waste ends up in informal dumps and is later burned in the open or accumulated in public spaces, generating pollution in the environment. In Peru, the generation of MSW reaches approximately 7 million tons per year and 45% of these end up in informal dumps or as piles of garbage in public spaces affecting the environment [3], becoming one of the problems of greater relevance in this country according to the government [4, 5].
In this sense, it is necessary to understand the synergy between the natural environment and individual behavior towards the latter so that they are seen as a unit [6]. Understanding the behavior of an individual towards the natural environment implies studying their perception and learning process from the established social construct, based on personal experiences and behaviors of the social structure to which they belong [7], then this behavior is adopted by the individual if they agree with the dominant accepted social idea of it, assuming environmental attitudes that in other cultures may be classified as improper or negative [8]. The field work carried out in this study finds that the individual behavior towards the natural environment is seen as negative in general because of the lack of care-for-the environment culture. Based on this last statement, an adequate understanding of the duties and responsibilities as citizens towards nature will allow to reverse situations that damage it [9].
Within this context, social indicators are the main disseminators of information to guide political actors in decision-making [10], and there is a great variety of indicators related to environmental monitoring, however, it is difficult to have parameters that directly evaluate the relationship between social behavior and the environment itself [11]. This makes it important to select correct indicators that are easy to implement and replicate in other study areas so that it can constitute a fundamental step in the construction of a robust tool that allows direct or indirect assessment of environmental impacts [12]. Furthermore, to understand the complexity of the generation/accumulation of MSW it is necessary to consider citizen participation as a determining factor in reducing MSW production [13].
On the other hand, in an effort to understand the nexus between the accumulation/generation of MSW and the behavior of citizens, various researchers proposed strategies to try to explain and understand the reason for this phenomenon. For example, in Colombia and Mexico a nexus was determined between the financial aspect and the generation of MSW are directly proportional, that is, the higher the income, the higher the consumptions levels and therefore the greater the amount of waste is generated [14, 15]. In this regard, Alhassan and colleagues [16] argue that dwellings are one of the main sources of MSW. On the other hand, in Palestine, Iran and Africa, the MSW generation process was proposed through the economic and cultural characteristics of the study area [17-19]. In addition, Brown [20] points out that a resilient culture committed to caring for the built environment would mean a possible decrease in the generation of MSW.
However, these proposals to slow down MSW production are not being the most optimal since the amount of waste generated exceeds the management model that municipalities have for its transfer and disposal [21, 22]. These results leaded to find new ways to achieve an adequate management of MSW taking into consideration demographic, economic and cultural aspects to propose efficient solutions regarding the mitigation of MSW generation/accumulation [23, 24]. The sociodemographic component will help for the influence existing in the expansion, exploitation and use of the built environment by residents on the accumulation of MSW to be understood [12, 25]. Meanwhile, the socioeconomic component will allow the different consumption patterns associated with the monthly economic income to be understood in light of the phenomenon studied [26, 27]. Finally, the sociocultural component will associate the customs and behaviors of the sector with the level of awareness regarding the accumulation of MSW [28-30].
This project will focus on these new approaches; therefore, the project's general objective is to describe and segment a certain population through social indicators to better understand the nexus between the generation/accumulation of MSW and the behavior of the residents of the study area towards the natural environment. To do so, we developed a methodology framework that combines the three categories previously mentioned (i.e., sociodemographic, socioeconomic, and sociocultural factors) into a unique database that allows having a general vision of the current situation in the case study. Unlike previous methods, we not only put the attention on socioeconomic aspects but also put the attention on all relevant community descriptors. In addition, we consider a single dwelling as a measure of unity. Likewise, considering the need to prioritize sectors within the same community, various machine learning techniques have been used for this purpose. For example, in China they developed a regression model and structural equations to segment the behavior of residents in terms of MSW classification and its subsequent recycling through a social and individual approach [31]. Also, in Ukraine a K-means model was used to segment people based on their behavior in terms of different stimuli (e.g., sport, entertainment, etc.) [32] these studies prove that the segmentation of residents is essential to find the perception and attitudes towards the environment of each individual [33, 34].
It is important to mention that the machine learning approach as a logistic regression, artificial neuronal network, support vector machine, random forest among others, has significant benefits to forecast the MSW generation due to the characteristics of them but it requires an important number of observations and is more recommended to apply them on extensive territories (e.g., regional, and/or national scales). Also, it is possible to face some issues as overfitting, unbalanced classes, or lack of information. In this sense, the method that we propose (K-means) fits in the territory scale (i.e., district scale) chooses and works better with the information that we have collected (i.e., 148 observations).
Consequently, this project will use the K-means algorithm to segment similar behaviors by associating their characteristics, which will allow the recognition of general patterns in the study area. This unsupervised classification model was chosen because of its simplicity and effectiveness in implementation [35, 36].
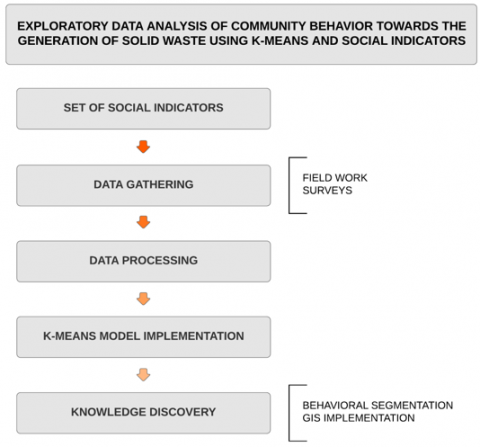
Figure 1 shows the methodological framework designed with the objective of exploring the nexus between the social behavior of residents and the generation/accumulation of MSW. This section also presents relevant information about the case study and the machine learning approach used.
Figure 1. Methodological framework
2.1 Data gathering
The lack of primary and specific information on the generation of MSW in a given community brings with it some limitations in decision-making [37], therefore, this study takes, as a starting point, the research carried out by Izquierdo-Horna colleagues, which offers a set of potentially viable social indicators to identify sectors prone to MSW accumulation [38]. The selected indicators are shown in Table 1.
Table 1. Matrix of social indicators based on Izquierdo-Horna and colleagues [38]
|
Categories |
Social indicators |
|
Sociodemographic factors |
Age |
|
Education level |
|
|
Household population density |
|
|
Land use |
|
|
Socioeconomic factors |
Consumption patterns |
|
Existence of ambulatory trading |
|
|
Monthly salary |
|
|
Sociocultural factors |
Custom |
|
MSW management awareness |
|
|
Participation in MSW management training |
Then, based on these indicators, we developed some descriptors for them (Table 2) and then developed a survey that was applied to the study area. The objective of this survey was to know the sociodemographic, socioeconomic, and sociocultural reality of the analyzed context. For an observation to be valid, the participant of the survey had to be the head of the household or, failing that, be older than 15 years of age, having as a sampling unit a household delimited by lot. The field work was carried out by the authors of this project following the recommendations of the National Institute of Statistics and Informatics (INEI) [39, 40]. Finally, to collect the greatest amount of data, a comprehensive mapping of the study area was carried out.
Table 2. Structured survey adapted from Izquierdo-Horna and colleagues [38]
|
Social indicator |
Description |
|
Age |
(4) 15 to 25 years old |
|
(3) 26 to 35 years old |
|
|
(2) 36 to 45 years old |
|
|
(1) 46 years old or more |
|
|
Education level |
(4) None |
|
(3) Primary |
|
|
(2) Secondary |
|
|
(1) Academic/technical |
|
|
Land use |
(3) Business |
|
(2) Multi-family house |
|
|
(1) Single-family house |
|
|
Household population density |
(4) 10 inhabitants or more |
|
(3) 7 to 9 inhabitants |
|
|
(2) 5 to 6 inhabitants |
|
|
(1) 1 to 4 inhabitants |
|
|
Monthly salary |
(4) S/ 3001 or more |
|
(3) S/ 2001 - S/ 3000 |
|
|
(2) S/ 1001 - S/ 2000 |
|
|
(1) S/ 0 - S/ 1000 |
|
|
Consumption patterns |
(4) Daily |
|
(3) Weekly |
|
|
(2) Fortnightly |
|
|
(1) Monthly |
|
|
Existence of ambulatory trading |
(2) Yes |
|
(1) No |
|
|
Custom |
(1) Litters in public spaces |
|
(0) Does not litter in public spaces |
|
|
MSW management awareness |
(2) No |
|
(1) Yes |
|
|
Participation in MSW management training |
(2) No |
|
(1) Yes |
2.2 Machine learning approach: K-means
The K-Means unsupervised classification algorithm was used to segment the population described above according to their social categories (i.e., sociodemographic, socioeconomic and sociocultural). This technique consists of determining “k” groups among the data [41]. For this, the “k” centroids are calculated and then each observation is grouped into the cluster that has the closest centroid. The method that we will use to define the distance to the closest centroid is the Euclidean distance [42]. This iterative process will conclude when the sum of the distances between each observation and the centroid of the cluster is minimized [43]. Due to the nature of the information, it was necessary to carry out a prior analysis of each variable (social indicator) to confirm whether said variable contributes to the segregation of the observations. As a result of this analysis, the variables considered for the study were: age, land use, population density, average monthly income and patterns of consumption. Additionally, considering the nature of the data, it was necessary to convert categorical variables into numerical variables. Finally, the “elbow” method was used to calculate the optimal number of groups. This technique consists in determining the value of "k" that achieves that an increase in "k" does not substantially improve the distances of the observations to their respective centroid [44].
2.3 Description of the case study
The Puente Piedra district (71.18 km2) is located in the northern part of the province of Lima and has a population of approximately 355 thousand inhabitants [45]. It is the sixth district with the highest accumulation points for municipal solid waste [1], generating more than 100 tons of MSW per day [46]. In addition, according to INEI [47], the population in the district of Puente Piedra is distributed among families of up to 4 members, where approximately 50% are between 18 and 44 years of age. Puente Piedra is also considered one of the four poorest districts in Lima-Peru, with a monthly income of less than \$300 [48]. For methodological purposes, this research focused on the Santa Juana de Copacabana and Frutales del Norte - Etapa I, associations both located in the village of Copacabana. The geographical location is shown in Figure 2.
Figure 2. Associations of interest: Santa Juana de Copacabana & Frutales del Norte - Puente Piedra
The information collected in the case study is made up of 148 observations obtained from the surveys carried out on each lot (i.e., Santa Juana de Copacabana Association (109) and Los Frutales del Norte I Association (39)). After data processing, it was obtained that the predominant population profile is between 36 and 45 years old with a degree of instruction equivalent to high school. They live, for the most part, in single-family houses with up to 4 inhabitants. Regarding the socioeconomic issue, monthly household income is around $300 and, at the same time, they show a pattern of daily consumption. Finally, regarding the sociocultural dimension, the participants mostly state that they are unaware of policies related to MSW and do not participate in any training on it. Figure 3. shows the results obtained, segregated according to the variable “custom”; where, “0” means that the participant waits for the garbage truck to arrive and “1” means that they do not do so or litters in public spaces.
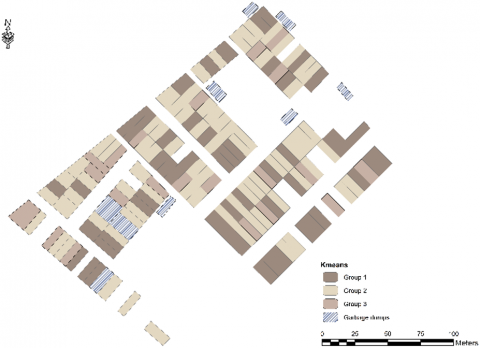
On the other hand, from the implementation of the unsupervised K-Means classification algorithm (elbow method), it was obtained that the optimal number of groups to identify was three and all of them share, for the most part, a population with an age range between 36 to 45 years old living in single-family houses, between 1 to 4 (group 1, 3) and 5 to 6 inhabitants (group 2). However, groups 1 and 2 show an approximate monthly income of \$500 and follow a daily consumption pattern. Meanwhile, group 3 shows an economic income of $300 with a biweekly consumption pattern. Finally, Figure 4. shows the spatial segmentation of the population who participated in the survey and the MSW accumulation points previously identified in the field work.
Figure 3. Composition of the chosen population segregated in the variable "custom" (0: Does not litter in public spaces; 1: Litters in public spaces)
Figure 4. Spatial segmentation of the groups identified with the K-Means algorithm and MSW accumulation points
From the results obtained, it can be observed that the study associations show not only a similar behavior around the generation of MSW, but also share a profound lack of knowledge about environmental policies that help mitigate their generation and accumulation. This can be understood by doing an analysis of the behavior of people in interaction with society, highlighting that an inherited collective cultural perspective allows establishing values that predominate in individual behavior, adopting it as their own [9, 27] also, considering the whole as a social unit, the individual behavior that is assumed can directly affect the global system [6, 8, 31].
In addition, this homogeneity in the behavior and population profile of the 3 groups previously identified with the K-means can also be attributed to the similar social characteristics of the Puente Piedra district [47, 48]. This scenario causes that the groups obtained in a delimited sector are not well defined. On the other hand, starting from the premise that social indicators allow evaluating the reality of a certain population in terms of a certain problem [49], using this tool will make it possible to develop strategic plans and facilitate decision-making by the authorities that are responsible [10].
Thus, of the three groups obtained as a result of the implementation of the K-Means, it can be observed that there is no noticeable difference between their attributes. Additionally, as the area of the study area and the collected sample are very small, it causes neighboring lots to have a spatial correlation of their attributes. On the other hand, regarding the spatial segmentation of the groups, it is observed that there is a certain closeness between the garbage dumps and the households belonging to group 2 which, according to its composition, is based on inhabitants with families made up of 5 to 6 members with an average income of $500 with a daily consumption pattern. However, a correlation between these observations cannot be asserted due to the variability associated with the reduced sample, although it confirms some of the authors' judgments (e.g., the higher the income, the family members and the frequent consumption pattern, the greater the probability of generation/accumulation of MSW).
Finally, regarding the social indicators used: age, land use, population density, monthly income and consumption pattern, they contributed a greater capacity for segmentation, unlike the other dichotomous indicators (i.e., existence of street trading, knowledge of policies related to MSW management and attendance to related training in this regard). In relation to this, the indicator "custom" was not considered within the unsupervised grouping carried out by K-Means, since it would imply redounding to the objective of this project. However, once grouping was done, the usual patterns of each group were observed. It is important to mention that, despite the fact that other researchers relate higher generation of MSW to higher economic income [14, 15] group 3 of our segmentation would be contradicting this hypothesis. This could be due to the social construct established in the community and to the informal activities that the population has been carrying out illegally [46, 50, 51]. However, the small size of group 3 (with 21 samples) creates uncertainty in the latter statements.
This research proposed to explore the behavior of a certain population based on its social indicators regarding the accumulation/generation of municipal solid waste. For this, information was collected using structured surveys. Once the information was compiled and processed, an unsupervised classification algorithm (i.e., K-Means) was used to analyze the segmentation of the population based on their social behavior regarding the generation of accumulations of solid waste located near the households that were studied. In this way, a comprehensive overview of the social, economic, and demographic situation of the studied sector is provided, along with an unsupervised classification method that allows adequate management of the available information.
From the analysis carried out, three segmentations were obtained where it can be inferred that group 1 are people with medium-high economic income (i.e., \$500 per month) who wait for the garbage truck to arrive. Group 2 are upper-middle income people who may not wait for the garbage truck or litter in public spaces. Finally, group 3, people with low incomes (i.e., \$300 a month) who do not wait for the garbage truck.
On the other hand, it is necessary to consider that the inferences obtained present a certain level of uncertainty associated with the size of the sample, the pre-processing of the categorical variables and the spatial coverage of the study area. Despite this, the segmentation into the three indicated groups represents a potential tool in solid waste management for decision makers, since targeting sectors with harmful customs to the environment can improve ─in the long term─ the decrease in the generation of garbage.
Finally, we consider that this methodology can be reproduced in different sectors within the national territory because the parameters used in this study are consistent with most of the criteria used by governmental and non-governmental organizations at the time of the preparation of national censuses. However, we recommend that, for better results, it is necessary to increase the number of observations, which gives greater relevance to the following indicators: age, land use, population density, monthly income and consumption pattern.
This project was funded by Universidad Tecnológica del Perú, within the framework of the "Research Projects I+D+i 2019" agreement. The authors would like to thank Claudia Arestegui, Jessika Eguía and anonymous reviewers for their valuable comments on the previous version of this manuscript.
[1] García, T., Tipian, P., Vásquez, L. (2019). Where does our garbage go: Recommendations to improve municipal solid waste management. Lima, 2019. http://siar.minam.gob.pe/puno/documentos/donde-va-nuestra-basura-recomendaciones-mejorar-gestion-residuos.
[2] Kaza, S., Yao, L., Bhada-Tata, P., Van Woerden, F. (2018). What a waste 2.0: a global snapshot of solid waste management to 2050. World Bank Publications.
[3] PEI. (2013). Integrated solid waste management for sustainable and inclusive development. Lima. https://www.pe.undp.org/content/dam/peru/docs/PEI%20final%202303.pdf.
[4] INEI. (2015). Peru: 2014 Environmental Statistics Yearbook. Lima. https://www.inei.gob.pe/media/MenuRecursivo/publicaciones_digitales/Est/Lib1197/libro.pdf.
[5] Orihuela, J. (2018). An analysis of the efficiency of municipal solid waste management in Peru and its determinants. Lima. https://www.inei.gob.pe/media/MenuRecursivo/investigaciones/residuos-solidos.pdf.
[6] Covarrubias Villa, F., Ojeda Sampson, A., Cruz Navarro, M. (2011). The environmental sustainability as sustainability of the capitalist regime abstract. Cienc. ergo-sum, Rev. Científica Multidiscip. Prospect., 18(1): 95-101.
[7] Serje, M. (2017). Social relations: A critical reflection on the notion of social impacts as change. Environmental Impact Assessment Review, 65: 139-146. https://doi.org/10.1016/j.eiar.2017.04.006
[8] Páramo Morales, D. (2017). Culture and human behavior. Rev. científica Pensam. y Gestión, 42: 1-5. https://rcientificas.uninorte.edu.co/index.php/pensamiento/article/view/10353.
[9] Cifuentes-Ávila, F., Díaz-Fuentes, R., Osses-Bustingorry, S. (2018). Ecology of human behavior: contradictions behind the message of environmental crisis. Acta Bioethica, 24(2): 161-165.
[10] Butt, B. (2018). Environmental indicators and governance. Current Opinion in Environmental Sustainability, 32: 84-89. https://doi.org/10.1016/j.cosust.2018.05.006
[11] Smeets, E., Weterings, R. (1999). Environmental indicators: Typology and overview. https://www.eea.europa.eu/publications/TEC25.
[12] da Silva, L., Prietto, P.D.M., Korf, E.P. (2019). Sustainability indicators for urban solid waste management in large and medium-sized worldwide cities. Journal of Cleaner Production, 237: 117802. https://doi.org/10.1016/j.jclepro.2019.117802
[13] Parekh, H., Yadav, K., Yadav, S., Shah, N. (2015). Identification and assigning weight of indicator influencing performance of municipal solid waste management using AHP. KSCE Journal of Civil Engineering, 19(1): 36-45. https://doi.org/10.1007/s12205-014-2356-3
[14] Aguilar-Virgen, Q., Armijo-de Vega, C., Taboada-González, P., Aguilar, X.M. (2010). Potential recovery of domestic solid waste disposed of in a landfill. Revista de Ingeniería, (32): 16-27.
[15] Klinger, R.A., Olaya, J., Marmolejo, L., Madera, C. (2009). A sampling plan for residentially generated solid waste quantification at urban zones of middle sized cities. Revista Facultad de Ingeniería Universidad de Antioquia, (48): 76-86.
[16] Alhassan, H., Kwakwa, P.A., Owusu-Sekyere, E. (2020). Households' source separation behaviour and solid waste disposal options in Ghana's Millennium City. Journal of Environmental Management, 259: 110055. https://doi.org/10.1016/j.jenvman.2019.110055
[17] Al-Khatib, I.A., Monou, M., Zahra, A.S.F.A., Shaheen, H.Q., Kassinos, D. (2010). Solid waste characterization, quantification and management practices in developing countries. A case study: Nablus district–Palestine. Journal of Environmental Management, 91(5): 1131-1138. https://doi.org/10.1016/j.jenvman.2010.01.003
[18] Almazán-Casali, S., Alfaro, J.F., Sikra, S. (2019). Exploring household willingness to participate in solid waste collection services in Liberia. Habitat International, 84: 57-64. https://doi.org/10.1016/j.habitatint.2019.01.001
[19] Jomehpour, M., Behzad, M. (2020). An investigation on shaping local waste management services based on public participation: A case study of Amol, Mazandaran Province, Iran. Environmental Development, 35: 100519. https://doi.org/10.1016/j.envdev.2020.100519
[20] Brown, D.P. (2015). Garbage: How population, landmass, and development interact with culture in the production of waste. Resources, Conservation and Recycling, 98: 41-54. https://doi.org/10.1016/j.resconrec.2015.02.012
[21] Awasthi, M.K., Zhao, J., Soundari, P.G., Kumar, S., Chen, H., Awasthi, S.K., Zhang, Z. (2019). Sustainable management of solid waste. In Sustainable Resource Recovery and Zero Waste Approaches, 79-99. https://doi.org/10.1016/B978-0-444-64200-4.00006-2
[22] Van Dooren, C., Janmaat, O., Snoek, J., Schrijnen, M. (2019). Measuring food waste in Dutch households: A synthesis of three studies. Waste Management, 94: 153-164. https://doi.org/10.1016/j.wasman.2019.05.025
[23] Abba, A.H., Noor, Z.Z., Aliyu, A., Medugu, N.I. (2013). Assessing sustainable municipal solid waste management factors for Johor-Bahru by analytical hierarchy process. In Advanced Materials Research, 689: 540-545. https://doi.org/10.4028/www.scientific.net/AMR.689.540
[24] Kharat, M.G., Raut, R.D., Kamble, S.S., Kamble, S.J. (2016). The application of Delphi and AHP method in environmentally conscious solid waste treatment and disposal technology selection. Management of Environmental Quality: An International Journal, 27(4): 427-440. https://doi.org/10.1108/MEQ-09-2014-0133
[25] Cifrian, E., Andres, A., Viguri, J.R. (2015). Developing a regional environmental information system based on macro-level waste indicators. Ecological Indicators, 53: 258-270. https://doi.org/10.1016/j.ecolind.2015.02.010
[26] Guzmán Chávez, M., Macías Manzanares, C.H. (2012). The management of municipal solid waste: an anthropological approach. The case of San Luis Potosí, Mexico. Estudios sociales (Hermosillo, Son.), 20(39): 235-262.
[27] Márquez González, A.R., Ramos Pantoja, M.E., Mondragón Jaimes, V.A. (2013). Citizen perception of municipal solid waste management. The Riviera Nayarit cas. Región y Soc., 25(58). http://www.scielo.org.mx/scielo.php?script=sci_arttext&pid=S1870-39252013000300004.
[28] Reichert, G.A., Mendes, C.A.B. (2014). Life cycle assessment and decision making support in integrated and sustainable municipal solid waste management. Engenharia Sanitaria e Ambiental, 19(3): 301-313. https://doi.org/10.1590/S1413-41522014019000001145
[29] Rodić, L., Wilson, D.C. (2017). Resolving governance issues to achieve priority sustainable development goals related to solid waste management in developing countries. Sustainability, 9(3): 404. https://doi.org/10.3390/su9030404
[30] Rodríguez, L. (2002). Towards Environmental Management of Solid Residues in large Latin-american Cities. Innovar, 1(20): 111-120. http://www.scielo.org.co/pdf/inno/v12n20/v12n20a08.pdf.
[31] Gan, B., Zhang, C. (2020). Influencing factors of urban residents’ garbage classification and recycling behavior driving mechanism in artificial intelligence environment. In IOP Conference Series: Earth and Environmental Science, 619(1): 012006. https://doi.org/10.1088/1755-1315/619/1/012006
[32] Boyko, N., Komarnytska, H., Kryvenchuk, Y., Malynovskyy, Y. (2019). Clustering Algorithms for Economic and Psychological Analysis of Human Behavior. In CMiGIN, 614-626.
[33] Penagos-Londoño, G.I., Rodriguez–Sanchez, C., Ruiz-Moreno, F., Torres, E. (2021). A machine learning approach to segmentation of tourists based on perceived destination sustainability and trustworthiness. Journal of Destination Marketing & Management, 19: 100532. https://doi.org/10.1016/j.jdmm.2020.100532
[34] Victoriano, R., Paez, A., Carrasco, J.A. (2020). Time, space, money, and social interaction: Using machine learning to classify people’s mobility strategies through four key dimensions. Travel Behaviour and Society, 20: 1-11. https://doi.org/10.1016/j.tbs.2020.02.004
[35] Aldhamari, A., Sudirman, R., Mahmood, N.H. (2021). Abnormal behavior detection using sparse representations through sequential generalization of k-means. Turkish Journal of Electrical Engineering & Computer Sciences, 29(1): 152-168.
[36] Sharma, N., Litoriya, R., Sharma, A. (2020). Application and analysis of k-means algorithms on a decision support framework for municipal solid waste management. In International Conference on Advanced Machine Learning Technologies and Applications, 1141: 267-276. https://doi.org/10.1007/978-981-15-3383-9_24
[37] Acuña, S., Valera, V. (2008). Indicators of waste generation and solid waste in Venezuela. Redisa, 1: 1-11. http://www.redisa.net/doc/artSim2008/gestion/A1.pdf.
[38] Izquierdo-Horna, L.U.I.S., Damazo, M., Yanayaco, D. (2020). Proposal for social indicators to improve municipal solid waste management: A peruvian case study. WIT Transactions on Ecology and the Environment, 247: 57-67.
[39] INEI. (2001). Guide to the evaluation of social indicators in household surveys. https://www.inei.gob.pe/media/MenuRecursivo/publicaciones_digitales/Est/Lib0507/Libro.pdf.
[40] INEI. (2018). Interviewer’s Manual - ENDES 2018, Instituto Nacional de Estadística e Informática. Lima, 1-488, 2018. https://proyectos.inei.gob.pe/endes/2018/documentos_2018/MANUAL_DE_LA_ENTREVISTADORA_2018_ENERO.pdf.
[41] Hartigan, J.A., Wong, M.A. (1979). Algorithm AS 136: A k-means clustering algorithm. Journal of the Royal Statistical Society, Series C (Applied Statistics), 28(1): 100-108. https://doi.org/10.2307/2346830
[42] Ceballos, G. (2007). Classification of manuscript numbers based on prototypes created using euclidean distance as a threshold. Dep. Ing. Eléctrica Univ. Chile, 1-9. https://www.studocu.com/cl/document/universidad-de-chile/analisis-de-senales/clasificacion-de-numeros-manuscritos-basados-en-pr/5480900.
[43] Dhanachandra, N., Manglem, K., Chanu, Y.J. (2015). Image segmentation using K-means clustering algorithm and subtractive clustering algorithm. Procedia Computer Science, 54: 764-771. https://doi.org/10.1016/j.procs.2015.06.090
[44] Syakur, M.A., Khotimah, B.K., Rochman, E.M.S., Satoto, B.D. (2018). Integration k-means clustering method and elbow method for identification of the best customer profile cluster. In IOP Conference Series: Materials Science and Engineering, 336(1): 012017. https://doi.org/10.1088/1757-899X/336/1/012017
[45] INEI. (2018). Peru: Growth and distribution of the total population - 2017, Lima. https://www.inei.gob.pe/media/MenuRecursivo/publicaciones_digitales/Est/Lib1673/libro.pdf.
[46] INEI. (2014). A look at Metropolitan Lima. Lima. https://www.inei.gob.pe/media/MenuRecursivo/publicaciones_digitales/Est/Lib1168/libro.pdf.
[47] INEI. (2017). National Census 2017: XII of population,VII of housing and III of indigenous communities. https://www.inei.gob.pe/media/MenuRecursivo/publicaciones_digitales/Est/Lib1539/libro.pdf.
[48] Arias, J., Oliart, S., Pachas, L., Rocha, R. (2013). Strategic planning for the district of Puente Piedra. Pontificia Universidad Católica del Perú. https://alicia.concytec.gob.pe/vufind/Record/PUCP_608b31bd6594b05dc2890c220dfd8cf5.
[49] Navarro, S., Larrubia, R. (2006). Indicators to measure situations of social vulnerability. Proposal made within the framework of a European project, Estud. Arte, Geogr. e Hist., 1(28): 485-506. https://dialnet.unirioja.es/descarga/articulo/2242454.pdf.
[50] INEI. (2019). Production and informal employment in Peru - Satellite Account of the Informal Economy 2007-2018, 1(1): Lima. https://www.inei.gob.pe/media/MenuRecursivo/publicaciones_digitales/Est/Lib1701/libro.pdf.
[51] INEI. (2020). Stratified Plans of Metropolitan Lima at Apple Level 2020. Lima. https://www.inei.gob.pe/media/MenuRecursivo/publicaciones_digitales/Est/Lib1744/libro.pdf.