Yasser ElSayed Fouda* | Deena Mohamed ElKhazendar
© 2021 IIETA. This article is published by IIETA and is licensed under the CC BY 4.0 license (http://creativecommons.org/licenses/by/4.0/).
OPEN ACCESS
Villages located today in the peri-urban area, are in continuous agglomeration. The lack of proper guidelines and monitoring systems to define, promote, regulate and manage the pattern of development in these areas, causes massive deteriorations to the environment and quality of life. In Egypt, very few states have a dedicated legal framework that addresses the need for planned development in the peri-urban areas. A Spatio-temporal model framework consisting of a set of geospatial indicators is required to regulate and direct the growth and development of these areas and prevent further spill across administrative boundaries. This article responds to the lack of a geo-spatial quantifiable criterion as a key to detect, analyze, and better govern spatial and temporal patterns of urban growth in peri-urban areas, where the results are to be represented dynamically in forms of spatial patterns evolving in time. The research aims to develop a process-wise, contextual mapping of peri-urban dynamics using GIS to detect and analyze spatial and temporal patterns of urban growth. It has been applied to one of the peri-urban areas in Egypt, in Meet Assas Village, chosen as a case study. Miscellaneous primary and secondary data sources together with the methods used for monitoring: UN Criteria (Goal 11) targets, thematic headlines, village’s problems and geo-spatial indicators were the main constitutions of the model frame work. The results show that the village is characterized by a dispersed pattern of development with the absence of basic infrastructure and services. Besides that, the study reveals, through temporal patterns, that the future and unplanned growth will continue to intensify; posing numerous threats on the environment and the quality of life. A harmonized standardized measurement framework for planning, development, and management is crucial rather than demolishing these areas.
geospatial indicators, GIS multi-criteria analysis, peri-urban areas, spatial/temporal analysis, urban development, urban growth dynamics, urban sprawl analysis
The world is rapidly urbanizing with the developing world contributing the largest percentage to this process. The process of urbanization and population growth are projected to add 2.5 billion people to the world’s urban population by 2050, with nearly 90% of the increase concentrated in Asia and Africa [1].
With spatial expansion induced by urban population growth taking place in almost every megacity, a type of specialty referred to as the “peri-urban” has emerged as a new research agenda for urban studies [2].
Peri-urban areas are generally territories affected by strong expansion processes of the city, processes that are weakly opposed by marginal agricultural activities, but where the expectations and interests of the communities are often high. Thus, they tend to have a chaotic and fragmented mix of urban and rural functions [1].
Peri-urban areas are also known for complex configurations of dynamic population growth, shifting economic activities, and a complex juxtaposition of formal and informal land conversion. They are hybrid and multifunctional spaces, which pose great challenges for governance as they often collide with non-matching administrative boundaries, widespread institutional multiplicity, and fragmentation [3].
Most recent studies for sustainable development have often focused on either cities or rural hinterlands distant from metropolitan areas, with little work on the peri-urban ones [4].
Although, many studies have given attention to the description and development of rural-urban interface from a qualitative viewpoint [4]; a geo-spatial quantifiable criterion that one might utilize to assess and audit the peri-urban dynamics and maintain its sustainable development growth does not exist. Besides that, most of these studies: Ren [5], Ramachan [6], Saribabu [7] and Maithani [8], have also given attention to urban expansion and specifically its effect on agricultural lands and land-uses; by quantifying urban sprawl and simulating urban growth, but lacking a standardized measurements framework that can sustain and manage this growth.
The research responds to the lack of a geo-spatial quantifiable criterion and aims to develop a processual, contextual mapping of multi-layered peri-urban dynamics using GIS as a key to detect, analyze, and better govern spatial and temporal patterns of urban growth that shifts overtime and space in these areas. It also aims to assess the transformation of peri-urban growth, and the evaluations of approaches to the planning and governance of the peri-urban landscape (rather than demolishing these areas), in order to steer them towards sustainable development, and prevent them from further sprawl.
In overall, the research adds an innovative approach by bridging the following knowledge gap questions:
- How to ensure an effective planned growth in peri-urban areas? - How can human activity be monitored in space and time using geo-spatial indicators? - How can we assess the spatial patterns of peri-urban dynamics? - How can we evaluate/audit urban expansions formed in Peri-Urban areas? - How can results be represented dynamically in forms of spatial patterns evolving in time?
It has been noted that all the Egyptian Cities grow in an unregulated and haphazard manner. As a result, agricultural land gets converted by the urban uses. Therefore, there is lack of proper guidelines and monitoring systems at the institution level of peri-urban area, unlike the urban areas [4].
Limited studies have given attention, specifically, to peri-urban areas in developing countries. In Egypt, there is a shortage of this kind of studies. Salem [9], one of the limited efforts, focused in his research on analyzing the driving factors of urban expansion in peri-urban areas of Greater Cairo Region lacking a standardized measurements framework that can sustain and manage growth.
Accordingly, the research will have to develop a spatio-temporal model framework that consists of a set of geo-spatial indicators and functions as a standardized measurement gauge to effectively and efficiently manage the growth and development of such areas [10].
The model framework has been applied to one of the peri-urban areas in Egypt. MeetAssas Village – Egypt has been chosen as a case study to efficiently and effectively manage its growth and development and steer it towards sustainable development. Meet Assas Village has been chosen as a case study: considring it is a peri-urban area, attempting to stop further sprawl and to preserve agricultural lands, not to mention that the selected village has various deterioration problems and available data.
The unplanned urban growth is audited during two different time lapses to emphasize the ability of the model to work on different temporal data. The two-time lapses are as follows: 1984:2002 & 2002:2019.
This paper is organised in five sections. Following this introduction, the problems are highlighted, including the nature and importance of spatio-temporal analysis using geo-spatial indicators, which can be further implemented to steer sustainable development in peri-urban areas. After that, the materials and the methods of the research are detailed; in this section, the case study, the data sources and the method used for monitoring: UN Criteria (Goal 11) targets, thematic headlines, village’s problems and geo-spatial indicators, are detailed. Lastly, the discussion and the results of the model framework; with the aid of GIS analysis, together with the conclusions are discussed.
2.1 Scholars efforts in measuring and mapping urban growth patterns
In recent decades, cities around the world have been facing the issue of urban growth as a result of population and economic growth [11]. Urban growth gradually leads to the decline of natural and rural lands, and it affects the ecosystem in general [12]. Given this situation, strategies and policies are needed to address and pre-empt this phenomenon before negative effects on the biosphere begin to increase [13].
Many mathematical and statistical methods have been used to measure urban growth patterns [14, 15]. These methods are sometimes integrated with a GIS environment and Remote Sensing (RS) data and techniques to employ them for measuring land-use changes spatially and temporally [16].
GIS and RS are being considered because of several reasons, such as the fact that RS and GIS techniques have spatial and temporal dimensions for monitoring, controlling, analyzing, evaluating, and measuring urban growth patterns and land use changes [6, 17]. In addition, these techniques can use quantitative and qualitative methods to identify the causes, impacts, and current and future trends of urban growth patterns [18].
Table 1. Different spatial statistical models for urban growth patterns
|
Author/Year |
Place |
Purpose of Study |
Technique Used |
Comment |
|
Ren et al. (2013) |
China |
Spatial expansion and sprawl |
Pearson's chi- square |
Pearson’s chi-square method is used in urban studies to reflect the probable future direction and the potential of urban expansion. Pearson’s chi-square is one of the significant quantitative methods that is used to monitor the sustainability of urban development. |
|
Ramachandra et al. (2013) |
India |
Analysis of spatial patterns of urbanization |
Shannon Entropy |
This is a powerful technique to measure the compactness and dispersion of built-up areas. In addition, Shannon entropy is used to identify the occurrence of urban growth in a certain area. |
|
Suribabu et al. (2012) |
India |
Land/use cover change detection |
Change detection techniques |
Change detection is a common method used in urban growth studies. Advantages of that method are; it provides a strong visualization of phenomena for different time periods. In addition, it can provide statistical representation to analyze, measure, and identify urban growth in specific areas. Moreover, change detection is easy to perform and understand. Furthermore, it can determine differences in land use changes between different time periods. |
|
Maithani et al. (2010) |
India |
Simulating future urban growth |
Marcov Chain & Cellular Automata |
Marcov Chain and Cellular Automata is a method used to predict urban land use changes and to simulate future urban growth. |
Source: [19], Aburas MM, Abdulla SH, Ramli MF & Ashaari ZH. 2017. Measuring and Mapping Urban Growth Patterns Using Remote Sensing and GIS Techniques, Pertanika Journal of Scholarly Research Reviews, Putra University Malaysia Press, 3:1, 55-69, EISSN: 2462-2028.
Generally, various spatial statistical models have been used in the field of land use analysis in urban regions. Ren et al. [5] applied Pearson’s chi-square statistics to analyze and evaluate the growth pattern and the overall situation of urban sprawl. Ramachandra [6] used Shannon entropy approach (Hn) to identify whether urban growth is compact or dispersed, as well as to identify if urban sprawl exists or not. Suribabu et al. [7] used statistical change detection of land use to evaluate urban growth patterns and Maithani [8] used Marcov Chain and Cellular Automata for simulating future urban growth [19].
Table 1 summarizes the overall performance of the main spatial statistical models that have been used to measure urban growth patterns.
The previous analysis has revealed that most spatial statistical studies have given attention to urban expansion and specifically its effect on agricultural lands and land use changes; by quantifying urban sprawl and simulating urban growth but lacking framework/strategies that can sustain and manage this growth.
In this context, an assessment of spatio-temporal patterns of urban growth and the factors affecting these transformations is vital to developing rational, economic, social and environmental policies to track changes in urbanization and thus sustain urban growth patterns [20].
2.2 An overview: Peri-urban areas
Peri-urban areas are in a dynamic process of continuous expansion through time, which involves both natural and human systems. Peri-urban areas (PUAs) have been commonly defined as transitional zones located between the city and the countryside which are neither strictly rural nor urban (urban and rural activities are juxtaposed) [21]. Accordingly, these areas become more urban in character, in physical, economic, and social terms [22, 23].
The urban expansion of metropolitan cities usually occurs in peri-urban areas, where the rural villages are spread. Thereafter, a merging process happens with existing villages, which creates distorted areas in terms of land tenure, land use, access to services, and other measures of social, economic and political integration [9].
There are a lot of terminologies that are used by scholars to describe the zone of peri-urban class, for example, Kombe used the term “peri-urban areas” [24], Simon used the term “peri-urban fringe” [25], McGee used the term “desakota regions” [26], while Bryant used the term “Urban Shadow” to describe the end of this zone [27].
It has been argued that differentiations in terminologies may be a result of entrenched ideologies regarding the nature and processes of urban growth dynamic system [4].
2.3 Peri-urban spatial manifestation and geo-spatial indicators
An inherent ingredient of the international debate on peri-urban development has been its spatial manifestation, and in particular its morphological and physical appearance [4].
Although, many studies have given attention to the description and development of rural-urban interface from a qualitative perspective; a geo-spatial quantifiable criterion (geo-spatial indicators) that might be utilized to assess and audit the peri-urban dynamics and maintain its sustainable development growth does not exist.
The contribution of the geo-spatial indicators is considered an important approach for translating the peri-urban complexity and for modelling its spatial dynamics [28].
Geo-spatial indicators can help stakeholders track and understand urban development over time. Also, it reveals dramatic insights on the overall, economic viability, sustainability and quality of life in these areas. This enables stakeholders and policy makers to develop and implement informed policies and to better understand the factors leading to inefficiency and inequality in urban areas, in response, to create and plan thriving areas of the future [29].
A Peri-urban area is considered to be a complex system and, consequently, its representation requires the establishment of a model [30]. A system is ‘a set of elements in dynamic interaction, organized in pursuit of a goal’ [31]. For Deprez and Bourcier (2003), one of the main objectives of indicators is in their ability to simultaneously and non-isolately take into account a complete set of parameters which are representative of a situation [28].
The Geographic Information Systems (GIS) can prove to be a suitable tool that can be further adapted to monitor and audit the urban growth patterns, as for many reasons [15]:
2.4 UN criteria (Goal 11) for spatial indicators selection
In September 2015, the United Nations Sustainable Development Summit adopted a new framework to guide development efforts between 2015 and 2030, entitled “Transforming our world: the 2030 Agenda for sustainable development”. By endorsing a stand-alone goal on human settlements (Goal 11), known as the ‘urban SDG’, – make cities and human settlements (Examples include; villages, towns, cities, market towns, farms…etc.) inclusive, safe, resilient and sustainable – the international community recognized urbanization and city growth as a transformative force for development [32, 33].
The UN-Habitat has prepared this “Monitoring Framework” as a guide to assist national and local governments in their efforts to collect, analyze, validate data and information. This “Monitoring Framework” provides the use of necessary definitions, method of computation and metadata of indicators, including spatial indicators (UN Habitat).
Villages in developing countries require monitoring systems with clear indicators, baseline data, targets and goals; if they are to successfully implement long-term sustainable development plans. Such monitoring systems must be able to track progress and identify setbacks with new approaches and techniques, preventing built-up areas spill across formal administrative boundaries and supporting the formulation of better-informed policies [34].
The UN Habitat Sustainable Development (Goal 11), consists of 7 main targets illustrated in Table 2. The (Goal 11) aims to:
Table 2. UN habitat (Goal 11) targets
|
Targets used by the study |
UN Habitat (Goal 11) |
|
Target 11.1: Housing and slums, and services |
11.1 By 2030, ensure access for all to adequate, safe and affordable housing and basic services and upgrade slums. |
|
Target 11.2: Transportation |
11.2 By 2030, provide access to safe, affordable, accessible and sustainable transport systems for all and improving road safety. |
|
Target 11.3: Planning |
11.3 By 2030, enhance inclusive and sustainable urbanization and capacity for participatory, integrated and sustainable human settlement planning and management in all countries. |
|
Target 11.4: Cultural and natural heritage |
11.4 By 2030, Strengthen efforts to protect and safeguard the world’s cultural and natural heritage. |
|
Target 11.5: (Not applicable in the study) |
11.5 By 2030, significantly reduce the number of deaths caused by disasters, including water-related disasters, with a focus on protecting the poor and people in vulnerable situations. |
|
Target 11.6: Air quality and solid waste management |
11.6 By 2030, reduce the adverse per capita environmental impact of cities, by paying special attention to air quality and municipal and other waste management. |
|
Target 11.7: Green areas and public space |
11.7 By 2030, provide universal access to safe, inclusive and accessible, green and public spaces. |
|
Target 11.a: Support positive economic dimensions |
11.a Support positive economic, social and environmental links between urban, peri-urban and rural areas by strengthening national and regional development planning. |
Source: [31], Goal 11 Make Cities and Human Settlements Inclusive, Safe, Resilient and Sustainable.
https://unstats.un.org/sdgs/files/metadata-compilation/Metadata-Goal-11.pdf
Provide safe, affordable housing, public transport and develop well planned human settlements (villages) with environmentally sustainable buildings and inclusive accessible services. It also aims to support a positive economic dimension and increased green public spaces; where cultural and national heritage is protected [32].
Targets summarized below will consequently be used to develop the geo-spatial indicators that will be used to audit and monitor the growth in peri-urban areas with the help of GIS.
3.1 Study area: Meet assas village - Egypt
In the Egyptian context, peri-urban areas have not found recognition in terms of their role and importance in rationalizing and promoting the planned growth of urban centers and making cities and villages more humane, more productive and more sustainable [4, 35].
In obscuring or inactivating the urban development policies, Egyptian Cities grow in an unplanned and haphazard manner. As a result, the agricultural land’s fringe gets converted to the urban uses in the response to the spill-over urbanization. So, there is a lack of proper guidelines at the institutional level of peri-urban area unlike the urban areas, where there are comparatively strong development control regulations, planning guidelines and monitoring systems [4].
All previous planning efforts (Master plan 1970, long term development plan 1983, first master plan 1991, update of master plan 1997, and strategic plan 2008) did not give peri-urban areas the required attention [4, 36].
It is clear from the above situation that all Egyptian Peri-Urban Areas need a harmonized and standardized measurements, enabling spatially and temporally consistent monitoring to efficiently manage and sustain their growth; therefore preventing their spill across formal administrative boundaries.
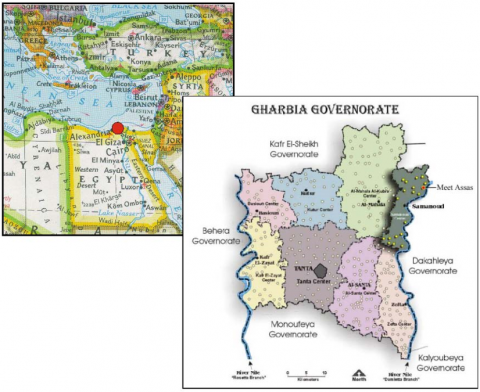
“Meet Assas Village” is one of the dependent villages for the mother Administrative Center of “Samanoud”. The city is an ancient city that is located on the Damietta Branch of the river Nile in the Delta and it is one of the eight main cities of Gharbia Governorate, as shown in Figure 1.
Figure 1. AlGharbia governorate and its eight main divisions located amidst the Nile delta at northern Egypt
“Meet Assas Village” has been chosen as a case study due to the following reasons:
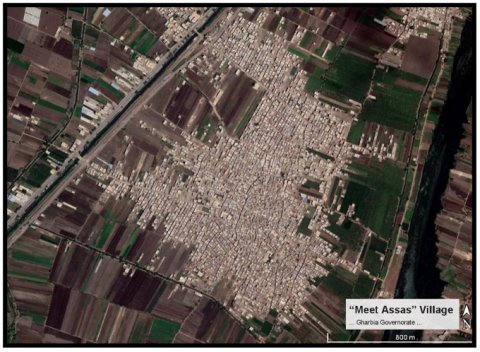
The features and characteristics of the village could be summarized below as follows, illustrated in Figure 2:
Figure 2. “Meet Assas” village satellite map
(31°00'00.3"N 31°17'33.9"E)
Source: [38], Google earth, 2021.
3.2 Meet Assas village: Data sources
Acquired data for the current situation of “Meet Assas Village” is analyzed as a first step for summarizing the main objectives for the development framework. The data represent the main pillar in the preparation of the main thematic headlines of the model framework, and accordingly the set of geo-spatial indicators could be selected. The data sources were obtained by two ways:
- Field survey of the village covering all development sectors: population and demography, environment, housing services, infra-structure, social and economy.
- Area maps (satellite maps – google earth): time lapses: 1984:2002 & 2002:2019.
- Face to face field interviews
- Direct observation (both qualitative and quantitative)
- The village’s local unit
- Tanta University Urban Planning Project (2003) - Construction and Development Executive System of the Village
- Authority of Construction and Planning (Dec. 2005)
- The Central Agency for Public Mobilization and Statistics
- The General Census of Housing and Buildings - Human Development Report; Egypt (2003) - International Labour Organization Database - Ministries of Agriculture, Electricity, and Water.
The data sources comprising statistical analysis, maps and analytical information will consequently aid in distinguishing the main problems at each sector and thus can be deployed to define the main thematic headlines of the model framework.
3.3 Meet assas village: A method for analysis
This paper reports a study that develops a model framework by which the villages (Specifically applied on Meet Assas Village) in the fringe area of a mother city can be checked for their behaviour. Also, the study helps maintain sustainable development for the growth of these areas instead of demolishing them, and taking advantage of the currently existing real estate wealth, thus defining their boundaries and preventing further sprawl.
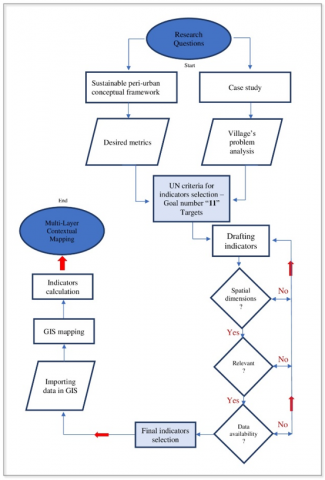
To interpret the spatial patterns of urban expansion, this study will have to employ a set of geo-spatial indicators to deal with both temporal and spatial features [39], of the designated peri-urban area. The selection of the indicators will have to follow a certain sequence as shown in Figure 3.
Figure 3. Action methodology chart for model framework
A theme-based framework is applied. Ideally, this framework will allow indicators to be selected; which reflects the dimensions of the phenomena being monitored [40].
The data retrieved from the previous sources will then be used as a base for the analysis of the village’s main development sectors (peri-urban dynamics); detailing the problems for each sector, from here the thematic headlines of the model framework are generated. The problems for each sector are summarized in Table 3.
The thematic headlines, problems and objectives are further linked to the UN targets (Goal 11 – discussed previously) in order to develop the set of spatial indicators; ready to be used in monitoring urban growth in peri- urban areas.
The research went through various numerous projects that exist worldwide to develop and apply indicators, some of them are; The Canadian Mortgage and Housing Corporation (CMHC), the United Nations Development Programme (UNDP), Eurostat, the UN Commission on Sustainable Development and the Habitat Centre of the United Nations. Further details were also established in previous published papers [40, 41].
A set of spatial indicators was then selected for each theme. Indicators have been selected for the themes based on how well they:
The spatial-indicators are then grouped according to basic categories (Thematic Headlines). Table 4 illustrates the 19 indicators that have been previously researched and compiled under the 4 themes.
Table 3. Meet Assas peri-urban dynamics, thematic headlines, and problems
|
Village’s Peri-Urban Dynamics Thematic Headlines (Development’s Sector) |
Meet Assas Village’s Problems (From data sources) |
|
1- Environmental Sector |
- Pollution of drinking water (wells – manual pumps) - Poor sewerage system - Poor solid waste management - Air pollution |
|
2- Housing and Services Sector |
- Lack of non-residential services (Medical – educational – cultural) - Lack of public open spaces - Dispersed housings causing low-density planning - Conversion of agricultural lands - Poor housing status |
|
3- Economic Sector |
- The individuals’ agricultural lands’ share is low (the possession average per individual is 0.84 Fadden) - The rise of vegetables and animal wealth production prices. |
|
4- Infrastructure |
- Transportation: Most of the village’s entrances lie on the main roads, all internal streets and roads are unpaved and dusty. - Potable water system: 30% of the village’s buildings are not connected to water. - Sewerage system: The village lacks a proper sewerage system. - Electric network system: The ratings of distributing transformers are less than the village’s consumption rate and don’t fulfil the future consumption. |
Source: [37], Urban Planning Project: The Development of Egyptian Villages, General Authority of Construction and Planning, and Tanta University, 2003.
4.1 Application of the model framework / GIS analysis
Once the model framework is developed (discussed in Table 4), the data is ready to be imported in GIS. The outcome will be able to assess and visualize the problems of unplanned urban growth.
A standardized measurement framework, enabling spatially and temporally evaluation scenarios is generated. The model framework could further be used to manage the growth and development of such areas, and thus prevents built-up areas spill across formal administrative boundaries.
It has been taken in consideration to assess the unplanned urban growth during two different time lapses to ensure the effectiveness of the model, and to emphasize the ability of the model to work on different temporal data. The two-time lapses were as follows: (1984 - 2002, 18 years) & (2002 - 2019, 17 years). The problems for the peri-urban dynamic thematic headline (B- Housing and Services) is only assessed in this study, due to the vast amount of information to be dealt with, as well as its resemblance to mimic other important urban dynamic thematic headline that would be encountered in other studies.
4.1.1 Problem 3: Lack of Services, Green Areas and Open Space
Most of the development in Meet Assas Village is haphazard and unplanned. The area suffers from lack of infrastructure and basic services (medical, educational, cultural and public green space).
Development of the village’s services, green areas and public open space is important to overcome the problem and detect areas with shortage. A set of geo-spatial indicators (access to basic health, access to basic education, access to basic cultural centers, access to public space and the percentage of green areas) can be used to monitor the shortage of services and open public spaces and green areas, and thus achieve UN targets (11.1 - Other services, 11.4 - Cultural heritage & 11.7 - Public space).
a) Indicators. Access to Basic Education, Medical Health and Cultural Services. Distance to the nearest service is considered to be an indicator for the accessibility and connectivity between the residential blocks and the existing village’s services. In order to fulfill the concept of sustainable development; 80% of the housing blocks should be accessible to that service [42].
To analyze and visualize the accessibility of residential blocks to the village’s services, a multi-buffer ring (a geo-processing tool in GIS) with: (200-300-400 meters for education services and 300-400-500 meters for medical services [43]); concentric to the existing service, is created.
Table 4. Geo-spatial indicators & UN criteria (Goal 11) compiled under 4 themes (Thematic Headlines)
|
Peri-urban dynamics Thematic Headlines |
Problems |
Objectives |
UN Targets (Goal 11) Spatial/Analysis (UN 2016) |
Geo-Spatial Indicators (Screened from previous studies (Fouda & ElKhazendar 2015 & 2019) |
Formula
(Fouda & ElKhazendar, 2015 - 2019) |
|
A Environmental Sector |
1-Pollution |
-The provision of a healthy environment. |
11.6 Target 6: Air and solid waste management |
1-Air pollution |
1-No. of housings blocks exposed to air pollution |
|
2-Agriculture and solid wastes |
-Agricultural and solid waste management. |
2-Waste management |
2-No. of housings blocks connected to a reliable waste collection service. |
||
|
B Housing and Services |
3-Lack of Services, cultural heritage, public space and green areas |
-Development of the villages’ services and public space |
11.1 Target 1: Other Services (educational + medical services)
11.4 Target 4: Cultural heritage |
3-Access to basic education 4-Access to basic health 5-Access to cultural and recreational buildings |
3-No. of residential counts 200, 300, 400 Meters multi-buffer distance with access to basic education. 4- No. of residential units 300, 400, 500 Meters multi-buffer distance with access to health services. 5- No. of residential units 300, 400, 500 Meters multi-buffer distance with access to cultural services. |
|
11.7 Target 7: Public space: (open space) |
6-Green space 7-Access to open space |
6-Green space area in meters square 7- No. of residential blocks 200, 300, 400 Meters buffer distance with access to open space. |
|||
|
4-Sprawl |
-Preservation of agricultural lands |
11.3 Target 3: Planning |
8-Land conversion |
8-Area of agricultural land converted in acres/time lapse |
|
|
-Infill Development |
9-Housing density 10-Mixed use 11-infill development |
9-No. residential units per acre. 10-Ratio of non-residential to residential land use 11-Infill development area. |
|||
|
5-Poor housing Status |
-Provision of low-cost housing and improving housing conditions |
11.1 Target 1: Housing and slums |
12- Satisfactory housing conditions. |
12-No. of informal settlements in the urban growth area. |
|
|
C Economic sector |
6-Local Economy |
-The increase of economic revenue of agricultural lands |
11.a Target a: Support positive economic dimensions |
13-Employment |
13-Area of agriculture land used for employment |
|
7-Unemployment |
-Creation of additional job opportunities |
14-Jobs/housing balance |
14-Total number of employment services/total number of housing units |
||
|
D Transportation & Basic Infrastructure Services |
8-Transport System
|
-Facilitating movement |
11.2 Target 2: Transport System |
15-Length of mass transport 16-Length of public network |
15-Total length of mass transport in Km/land km2 16- Total length of public transport in Km/land km2 |
|
9-Water-Supply and sewerage System |
-Improvement of drinking water efficiency |
11.1 Target 1: Basic infrastructure services |
17-Length of clean water supply system pipes |
17-No. of housing counts with potable water supply service |
|
|
-Getting rid of sewerages in a safe way |
18- Length of sewerage system network |
18-No. of housing counts served by waste water collection |
|||
|
10-Electrical System |
-Development of electric networks |
19- Length of electric network |
19-No. of housing counts with authorized electrical service |
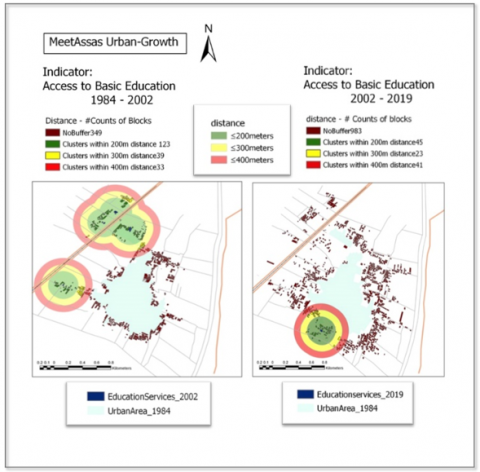
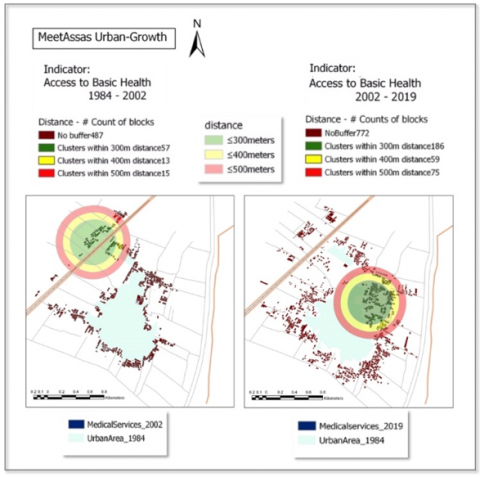
Figure 4 & Figure 5 visualize the total number of residential counts at a multi-buffer distance of (200, 300, & 400 meters) for the education services, and (300, 400, & 500 meters) for the medical services, respectively (no layer was done for the cultural service as the village has only “one” count for time lapse (2002-2019)).
It is clear from the GIS analysis that over 50% of the residential blocks are lacking accessibility to basic services during both time lapses (1984-2002 & 2002-2019). The GIS analysis and the mathematical calculations are detailed in Table 5.
Figure 4. GIS analysis: Indicator No. 3 (Access to basic Education) - Count of Residential Blocks at a multi-buffer distance (200, 300, & 400 meters) - during time lapses (1984 - 2002 - 2019)
Figure 5. GIS analysis: Indicator No. 4 (Access to basic Health) – Count of Residential Blocks at a multi-buffer distance (300, 400, & 500 meters) – during time lapses (1984 - 2002 - 2019)
b) Indicators: Green Areas and Access to Open Public Space. Parks and open spaces enrich a community’s quality of life. Access to and use of parks and open space; bring the natural environment closer to each citizen and are also a public gathering places that bring people together and build a sense of community [44]. In order to fulfill the concept of sustainable development; around 10% of the total built-up area should be green space (Indicator 6) and 80% of the housing blocks should be accessible to open public spaces (Indicator 7) [42].
Table 5. GIS analysis & mathematical calculations - indicators: Access to basic education, medical health and cultural services
|
GIS Analysis (Geo-Processing Procedures) |
|
Indicators 3,4 &5: -Step 1: Geo-processing tool: Multi-ring buffer concentric to existing services -Step 2: Geo-processing tool: Union (Multi-buffer layer + Land-use layer (Residential units selected) -Step 3: Symbology -Step 4: Counts are retrieved (GIS statistical analysis) |
|
Mathematical Calculations |
|
Standard: 80% of count of residential blocks should be accessible to services (AlShuwaikhat, 2006). Indicator 3: Education Services: Time lapse (1984 – 2002): Count of blocks with no buffer = 349 Blocks – 64% of total count. Time lapse (2002 – 2019): Count of blocks with no buffer = 983 Blocks – 90% of total count. Indicator 4: Medical Services: Time lapse (1984 – 2002): Count of blocks with no buffer = 487 Blocks – 85% of total count. Time lapse (2002 – 2019): Count of blocks with no buffer = 772 Blocks – 71% of total count. Indicator 5: Cultural Services: Not analyzed due to the lack of cultural services (only one cultural service noted (2002 – 2019)). |
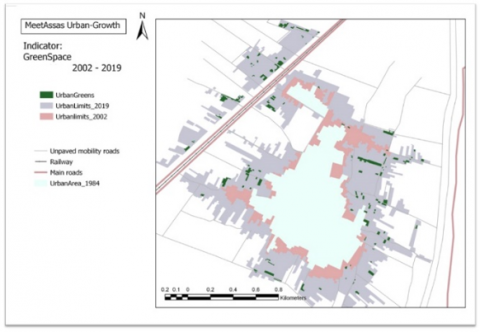
The indicator: total area of green space in square meters; is calculated using the “calculate field analysis” in GIS analysis procedures. Although the final results for the mathematical calculations for time lapse 2002 - 2019 appears to be within limits; it has been figured out, that the area of green spaces are presumably unplanned left-overs of the agricultural lands within the urban expansion.
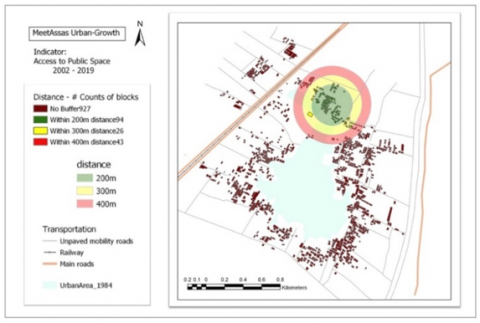
Another indicator: access to public space is also visualized by creating a multi-buffer rings that are concentric to the public space at distances of 200, 300, & 400 meters; in order to detect the total count of residential blocks accessible to these areas. It has been concluded that 15% of the total residential count is accessible to “one” open public space in time-lapse 2002 - 2019.
Figure 6 & Figure 7 show the GIS analysis for indicators (6 &7) in Meet Assas Village. These have been done for only time lapse 2002 - 2019, since no public space and no green space have been noted for time lapse 1984 - 2002. The GIS analysis and the mathematical calculations are further detailed in Table 6.
4.1.2 Problem 4: Sprawl problems
General absence of well-defined administrative boundaries for planning, development and management in peri-urban areas has led to a dispersed irrational land-use pattern. Unfortunately, the unplanned growth is causing sprawl that is leading to conversion of large-scale agricultural land into non-agricultural uses.
Table 6. GIS analysis & mathematical calculations - indicators: Green areas and access to open public space
|
GIS Analysis (Geo-Processing Procedures) |
|
Indicator 6: (Green Areas) The green space area is digitized and its area is calculated using the “Calculate field” analysis. Indicator 7: (Access to Public Space) - Step 1: Geo-processing tool: Mutli-ring buffer concentric to public spaces. - Step 2: Geo-processing tool: Union (Muti-buffer layer + Land-use layer (Residential units selected) - Step 3: Symbology - Step 4: Counts are retrieved (GIS statistical analysis) |
|
Mathematical Calculations |
|
Indicator 6: (Green Areas) Standard: 10% of total area (AlShuwaikhat, 2006) - Time lapse (1984 – 2002) has no green space Area of green space in meters square = Zero. - Time lapse (2002 – 2019): Area of green space in meters square = 15acre – (60854m2). Total area of urban expansion (2002 – 2019) = 100.69acre Percentage of green areas of total area = 15%. Indicator 7: (Access to public Space) Standard: 80% of count of residential blocks should be accessible to public space (AlShuwaikhat, 2006). - Time lapse (1984 – 2002): Zero public space (100% of total count with no buffer) - Time lapse (2002 – 2019): Count of blocks with no buffer = 927 Blocks – 85% of total count |
Figure 6. GIS analysis: Indicator No. 6 “Green Spaces” - during time lapse 2002-2019
Infill development and preservation of agricultural land are the main objectives to limit the urban sprawl. A set of geo-spatial indicators (land conversion, housing density, mixed land-use and infill development) can be used to monitor sprawl and to achieve UN target (11.3 - planning).
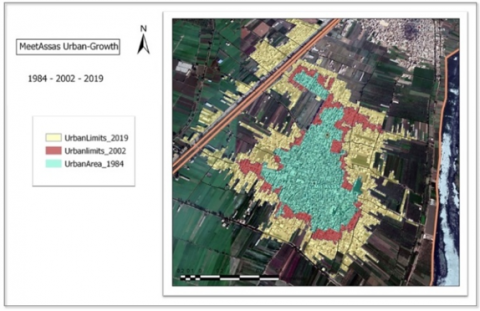
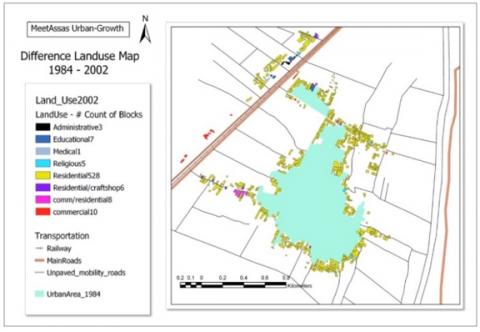
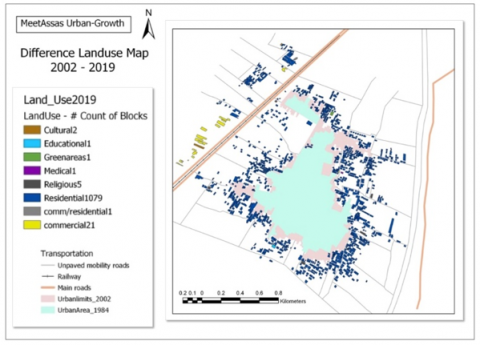
a) Indicator: Land Conversion. Satellite images (google earth maps) during two different time lapses (1984 - 2002 & 2002 - 2019) were imported in GIS. Both areas were digitized and their areas have been calculated. It has been figured out that the area of agricultural land being converted has increased more than a double during time lapse (2002 – 2019).
Sustainable development for both urban limits: (1984 - 2002) & (2002 - 2019), rather than demolishing actions, is crucial to preserve agricultural lands and prevent built-up areas further spill across governmental administrative boundaries. The GIS analysis and the mathematical calculations are detailed in Figure 8 and Table 7.
Figure 7. GIS analysis: Indicator No. 7 “Access to open public space” - during time lapse 2002-2019
Figure 8. GIS analysis: Indicator No. 8 “Land Conversion” – urban built 1984-2002-2019
Table 7. GIS analysis & mathematical calculations - indicator: Land conversion
|
GIS Analysis (Geo-Processing Procedures) |
|
Urban Built (1984 – 2002 – 2019): Both areas are digitized and their areas are calculated using the “Calculate field” analysis. |
|
Mathematical Calculations |
|
- Time lapse (1984 – 2002): Area of agricultural land converted to acre = 66.9 acres (270235 m2) - Time lapse (2002 – 2019): Area of agricultural land converted to acre = 100.69 acres (407478 m2) |
b) Indicator: Housing Density. Housing density has been shown to be a better indicator for sprawl. Higher density housing reduces the amount of green field land being consumed by urban development [43].
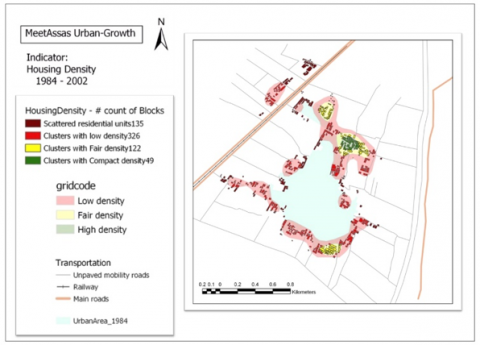
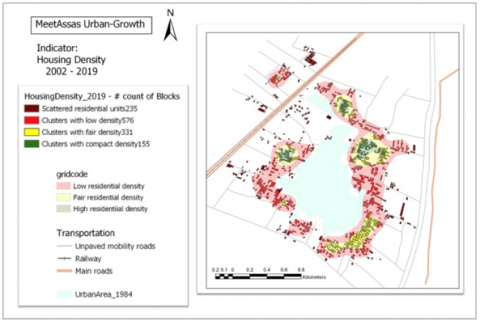
To calculate the housing densities, difference land-use maps for both time lapses (1984 – 2002) & (2002 – 2019) were digitized to figure out the total count of housing blocks in both designated areas, shown in Figures 9 and 10. It is noted that the density of dwellings per acre is far below the standard benchmark (less than 15dwellings per acre, that is 3,705 dwellings per Km2; for low-medium sized dwellings with an average 5-6 storeys rise, is considered to be low) [45].
Figure 9. GIS analysis: Indicator No. 9 “Housing Density” - housing counts - difference land use 1984-2002
Figure 10. GIS analysis: Indicator No. 9 “Housing Density” - housing counts - difference land use 2002-2019
Figure 11. GIS Analysis: Indicator No. 9 “Housing Density further analysis” - difference land use 1984-2002
Further GIS analyses were also developed to detect dispersed and low densities areas. Figures 11 and 12 visualize the housing densities during time lapses (1984 - 2002) & (2002 - 2019). The GIS statistical analysis and mathematical calculations detailed in Table 8 states that, around 21% of the clusters (GIS #count of blocks) are scattered, while 51% are categorized as low density during the time lapse of (1984 - 2002). During the time lapse of (2002 - 2019), 18% of the clusters (GIS #count of blocks) are scattered and 44% are categorized as low density.
Housing density plays an important role in prevention of urban sprawl; which could be maintained by infill development in low densities areas.
Table 8. GIS analysis & mathematical calculations - indicator: Housing density
|
GIS Analysis (Geo-Processing Procedures) |
|
GIS analysis procedures for Figure 9 & 10:
GIS analysis geo-processing steps for Figure 11 & 12:
|
|
Mathematical Calculations |
|
Standard: 15-50 Dwellings per acre (3705 – 12350 dwellings per Km2) (AlMardoud, 2016) Time lapse (1984 – 2002): Dwellings count = 528 (Retrieved from Figure 9) Urban expansion area (1984 – 2002) in Acre = 66.9acre Density= 7.89 unit/acre (1Km2 = 247acre; 1948 dwellings unit/ Km2) Time lapse (2002 – 2019): Dwellings count = 1079 (Retrieved from Figure 10) Urban expansion area (2002 – 2019) in Acre = 100.69acre Density= 10.71 unit/acre (1Km2 = 247acre; 2645 dwellings unit/ Km2) It is noted that the density of dwellings per acre is far below the standard benchmark (less than15 dwellings per acre (3705 dwellings per Km2 is considered to be very Low) Further analyses are conducted to detect areas with low densities within the urban expansion. #Counts of blocks in GIS analysis states that: - Time lapse (1984 – 2002): # Count of scattered blocks = 21% # Count of low-density blocks = 51% # Total Count = 72% - Time lapse (2002 – 2019): # Count of scattered blocks = 18% # Count of low-density blocks = 44% # Total Count = 62% |
c) Indicator: Mixed-Land Use. Mixed-land use has played an important role in solving sprawl problems. To calculate the ratio of mixed land-use, difference land-use maps for both time lapses (1984 – 2002) & (2002 – 2019) were digitized to figure out the ratio between the total counts of residential uses to non-residential uses in both designated areas. Mathematical calculations and GIS procedures for both time lapses (1984 – 2002) & (2002 – 2019) are detailed in Table 9.
It has been concluded, that the mixed land-use ratio is far below the required standards, that is: 2 (CAPMAS). More non-residential uses (medical – education - entertainment … etc.) are needed to balance the predominant number of residential units.
Figure 12. GIS analysis: Indicator No. 9 “Housing Density further analysis” - difference land use 2002-2019
Table 9. GIS analysis & mathematical calculations - indicator: Mixed-land use
|
GIS Analysis (Geo-Processing Procedures) |
|
Residential and non-residential counts are retrieved from GIS Analysis (# count of blocks) this is illustrated in Figure 9 and Figure 10. |
|
Mathematical Calculations |
|
Standard: 2 (CAPMAS) - Time lapse (1984 – 2002): Residential count = 528 (Figure 9) Non-residential count = 45 (Figure 9) Ratio = Non-residential count/Residential count = 0.08 - Time lapse (2002 – 2019): Residential count = 1079 (Figure 10) Non-residential count = 32 (Figure 10) Ratio = Non-residential count/Residential count = 0.03 |
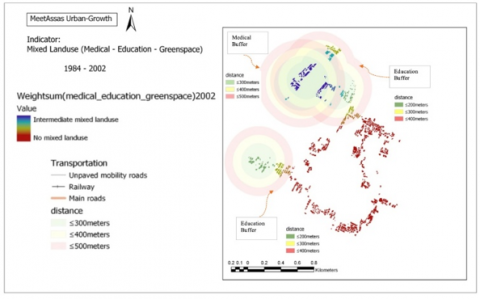
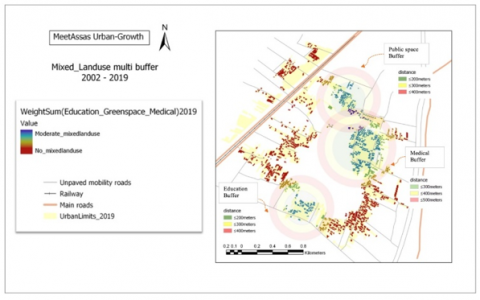
Further GIS analysis has also been developed to detect residential clusters with intermediate to no-mixing land-use. Figures 13 and 14 visualize the degree of mixed land-use during time lapses (1984 - 2002) & (2002 - 2019). A “weight sum” geo-processing tool was done to overlay the three main non-residential services allocated in the village (medical – public green space – education).
Figure 13. GIS analysis: Indicator No. 10 “Mixed Land use” - occurrence of mixed land use (Difference Land use) 1984-2002
Multi-buffer rings (previously performed) with 200, 300, & 400 meters for public green space & education services and 300, 400, & 500 meters for medical services; concentric to the acquired service, were overlaid to detect and visualize the degree of occurrence of mixed land-uses in both designated areas.
Figure 14. GIS analysis: Indicator No. 10 “Mixed Land use” - occurrence of mixed land use (Difference Land use) 2002-2019
It is noted that a few residential blocks are accessible to two different types of services, few are accessible to only one type of service and the majority of residential blocks have zero access to all services. Further GIS analyses procedures are detailed in Table 10.
To solve the problem, a mix of non-residential services are needed to cover up 80% (standard), [10], of the total “weight-sum map” (all services layers summed up together).
Table 10. GIS analysis - indicator: Mixed land-use further analysis
|
GIS Analysis (Geo-Processing Procedures) |
|
GIS analysis geo-processing steps:
|
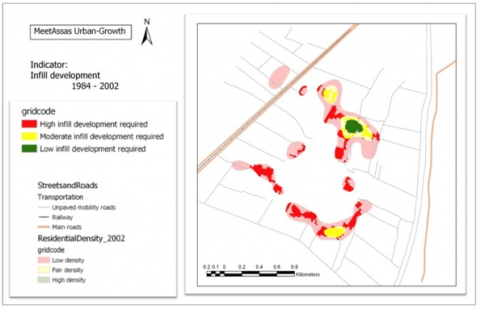
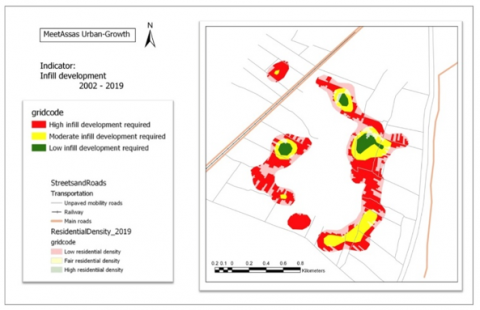
d) Indicator: Infill Development. Infill is defined as the development that is” seamlessly developed within an existing urban fabric, balancing, completing, and/or repairing surrounding sectors [43].
The indicator (infill development) will be able to monitor and detect the area of undeveloped greenfield and thus preventing further sprawl. Figure 15 and Figure 16 analyze the infill development for both designated areas. Further mathematical calculations and GIS analyses procedures are also detailed in Table 11.
It is concluded from the above GIS analysis and mathematical calculations that large areas with infill development is required, this in return will increase housing density and thus will decrease sprawl.
Figure 15. GIS analysis: Indicator No. 11 “Infill Development” - difference land use 1984-2002
Figure 16. GIS analysis: Indicator No. 11 “Infill Development” - difference land use 2002-2019
Table 11. GIS analysis & mathematical calculations - indicator: Infill development
|
GIS Analysis (Geo-Processing Procedures) |
|
|
Mathematical Calculations |
|
The vacant area acquired for high infill development could be calculated as follows: - Time lapse (1984 – 2002): (Total area for high infill development (symbolized in red)) – (Total blocks area within “high infill” area) = 33.33 – 23.74 = 9.59 hectare (95900 m2) - Time lapse (2002 – 2019): (Total area for high infill development (symbolized in red)) – (Total blocks area within “high infill” area) = 129.91 – 40.52 = 89.39 hectare (893900 m2) |
4.1.3 Problem 5: Poor housing status
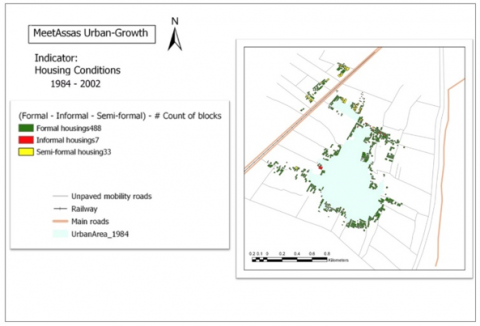
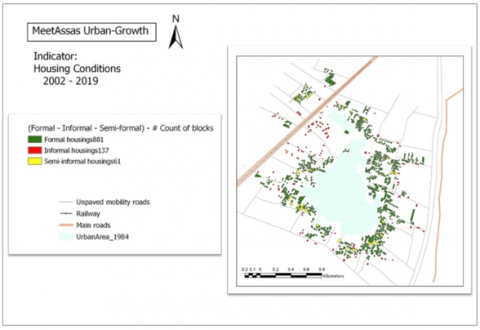
The indicator (Satisfactory housing conditions) will be able to monitor the housing status in the village and thus improve housings with poor conditions. The village’s data resources, Tanta University [37], has classified the village’s building’s status into three different categories: formal (appropriate housings conditions), semi-formal (moderate housings conditions (façades are clay-bricks lacking plaster and paint), & informal shanty housings (very poor housings conditions, that are constructed by straw or other recycled materials). Figure 17 and Figure 18 analyze the housing status for both designated areas.
Figure 17. GIS analysis: Indicator No. 12 (Housing Conditions) – difference land-use (1984 – 2002)
Figure 18. GIS analysis: Indicator No. 12 (Housing Conditions) – difference land-use (2002 – 2019)
Table 12. GIS analysis & mathematical calculations: Indicator - housings status
|
GIS Analysis (Geo-Processing Procedures) |
|
Informal, semi-formal and formal housing blocks counts are retrieved from GIS Analysis (# count of blocks). |
|
Mathematical Calculations |
|
Time lapse (1984 – 2002): Formal housing counts = 488 Informal housing counts = 7 Semi-formal housing counts = 33 Total percentage of housings that need upgrade = 8% Time lapse (2002 – 2019): Formal housing counts = 881 Informal housing counts = 136 Semi-formal housing counts = 61 Total percentage of housings that need upgrade = 18% |
Table 12 details the mathematical calculations used to compute the percentage of informal (shanty housings) and semi-formal housings that in need for upgrades. Evidently, around 8% of total housing blocks counts during (1984 - 2002) and 18% of total housing blocks counts during (2002 - 2019) need upgrades that includes; replacing shanty housings with formal ones, besides plastering & painting the façades of semi-formal housings.
4.2 Results of model application and geographic information analysis
The results of the GIS analysis applied to thematic headline: housing and services, show that the village is characterized by dispersed pattern of development with absence of basic infrastructure and services.
Low-quality development and low-quality life; prevailing in these areas led to the continuous sprawl and large-scale conversion of agricultural lands into non-agricultural uses.
A harmonized standardized measurement framework for planning, development and management based on the criteria of sustainable development, is crucial rather than demolishing these areas.
Table 13 compares between the GIS analysis results during the two different time lapses: 1984:2002 & 2002:2019. The GIS analysis results show that the village’s growth during time-lapse (2002 - 2019) is gradually increasing.
If those areas are not sustained appropriately, the future growth will continue to intensify; posing numerous threats on the environment and its quality of life.
Also, it has been figured out from the GIS analysis for both time lapses that the dispersed, unorganized and unplanned growth has resulted in many problems and thus achieving overall calculations that is far below the standardized values. To achieve sustainable development goals for those areas a set of solutions were made for each geo-spatial indicator as follows:
Table 13. Final GIS analysis for Thematic-Headline “Housing and Services” During Time-lapses “1984 – 2002” & “2002 – 2019”
|
Thematic Headline: Housing and Services |
||||
|
Geo-Spatial Indicator |
Formula/Analytic Procedure |
GIS-Analysis Results Time lapse (1984 – 2002) |
GIS-Analysis Results Time lapse (2002 – 2019) |
Problem Resolution |
|
Indicator 3: Access to basic education |
No. of residential counts at 200, 300, & 400 Meters multi-buffer distance with access to basic education. |
64% with no accessibility. |
90% with no accessibility. |
Addition of education services to cover 80% of the built-up area. |
|
Indicator 4: Access to basic health |
No. of residential units at 300, 400, & 500 Meters multi-buffer distance with access to health services. |
85% with no accessibility. |
71% with no accessibility. |
Addition of health services to cover 80% of the built-up area. |
|
Indicator 5: Access to cultural and recreational buildings |
No. of residential units at 300, 400, & 500 Meters multi-buffer distance with access to cultural services. |
No cultural services |
Only one cultural service |
Addition of cultural services to cover 80% of the built-up area. |
|
Indicator 6: Green areas |
Green space area in square meters |
Zero |
60854 $m^{2}$ (15%) of total built-up area |
Green areas should be formally planned (currently it is parts of left-over agricultural lands). Yet within limits (Standard: 10%) |
|
Indicator 7: Access to open public space |
No. of residential blocks at 200, 300, & 400 Meters. buffer area with access to open space. |
100% with no accessibility. |
85% with no accessibility. |
Addition of open spaces to cover 80% of the built-up area. |
|
Indicator 8: Land conversion |
Area of agricultural land converted in acres/time lapse ($m^{2}$ /time lapse) |
270235 $m^{2}$ |
407478 $m^{2}$ |
Sustainable development for both areas |
|
Indicator 9: Housing density |
No. of residential units per acre. (&No. of residential units/ $Km^{2}$) |
7.89< 15-50(standard) |
10.71< 15-50 (standard) |
Administration of Infill Development |
|
Indicator 10: Mixed use |
Ratio of non-residential to residential land use |
0.08< 2 (standard) |
0.03< 2 (standard) |
Mix of non-residential uses to cover 80% of the built-up area |
|
Indicator 11: Infill development |
Infill development area in meters square. |
95900 $m^{2}$ |
893900 $m^{2}$ |
Large areas of infill development required |
|
Indicator 12: Satisfactory housing conditions. |
No. of informal settlements in the urban growth area. |
8% |
18% |
Informal “Shanty” Housing needs to be removed and replaced with formal ones. Semi-formal housing’ facades need to be plastered and painted |
The research results demonstrate that Meet Assas Village, as a case study, emphasize the fact of low-quality development and low-quality life; and this consequently has led to continuous sprawl and large-scale conversion of agricultural lands into non-agricultural uses.
A harmonized standardized measurements framework for development and management based on the criteria of sustainable development is crucial rather than demolishing these areas. The GIS analysis results has proven that, if those areas are not sustained well, the future growth will continue to intensify; posing numerous threats on the environment and the quality of life.
Many studies have given attention to the description and development of rural-urban interface from a qualitative perspective, but it was concluded that a geo-spatial quantifiable criterion that one might utilize to assess and audit the peri-urban dynamics and maintain its sustainable development growth does not exist.
The research has exposed light on the (UN Criteria “Goal 11” and how it can be incorporated to develop the geo-spatial indicators of the model framework, which was further adapted to translate the peri-urban complexity and model its spatial dynamics.
It was noticed that, peri-urban areas in the Egyptian Context have not found recognition in terms of their role and importance. Inefficiency of urban planning policy, made these areas grow in an unplanned and haphazard manner. A spatio-temporal framework that functions as a standardized measurement tool was conducted to efficiently manage and sustain the growth and development of these areas and transform them into formal ones.
The framework action mode started by analysing the village’s main development sectors and detailing the problems for each one. Following the problems; a set of geo-spatial indicators were identified and incorporated with the UN Targets (Goal 11). The data sources together with the geo-spatial indicators were finally imported in GIS and a contextual mapping of multi-layered peri-urban dynamics were generated to assess and to visualize the spatial and temporal patterns of urban growth that shifts overtime and space in these areas. It was intended to erect the analysis during two different time lapses (1984 - 2002 & 2002 - 2019) for Meet Assas Village to emphasize the ability of the model to work on different temporal data.
Eventually, the model has proven its ability to check the village’s sustainable development directions on different temporal data. A set of GIS multi-criteria analysis were erected on two different time lapses and the model has efficiently succeeded in visualizing both time lapses, besides comparing and quantifying the outcome for both temporal data. This was also further summarized in the final results research table.
Additional aspects are also needed to be considered. Hence, further research is anticipated which will focus on enhancing the model framework by carrying it on more than one village and checking the village’s behaviour across the rest of the “thematic headlines”. At this early stage of the proposed norm it was intended to be carried on one village (Meet Assas) and one thematic headline (Housing and services). The main purpose is to see whether the model framework works properly and provides accurate findings.
In fact, the model has proven to add meaningful outcome and this was clear from the quantifiable geospatial framework that has been developed and erected on Meet Assas Village. The same framework generated could further be used as a guide to check other villages’ behaviours across other thematic headlines.
Although the model framework could be further extended and be applied on other countries and regions. The universality degree for application might be somehow limited due to the fact of the vast amount of data incorporated in the procedures of the analysis. The shortcomings of the model could be improved by integrating Remote Sensing and GIS together. Remote sensing can be considered as a powerful tool and supply relevant physical base data easily with speed and on repetitive basis, to support the development, measuring and monitoring of urban indicators.
Another area for further development and amendment of the model shortcomings involves overlaying and superimposing all the current set of geo-spatial indicators in a GIS environment to be able to simulate and visualize a suitability scenario prediction of a well sustained future growth within the boundaries of these areas.
Nevertheless, the model framework is considered to be useful in providing unambiguous quantifiable representation of solely spatio-temporal relationships, that was further extended to assess and audit the peri-urban dynamics and maintain its sustainable development growth.
[1] Wandl, A., Magoni, M. (2017). Sustainable planning of peri-urban areas: Introduction to the special issue. Planning Practice & Research, 32(1): 1-3. https://doi.org/10.1080/02697459.2017.1264191
[2] Sun, L., Li, C., Gwilliam, J., Jones, P. (2012). Challenges to sustainable peri-urban settlement development in China: an analysis by empirical evidence in Tianjin. Sustainability Today: WIT Transactions on Ecology and the Environment, 167: 3-14.
[3] Allen, A. (2014). Peri-urbanization and the political ecology of differential sustainability. In the Routledge Handbook on Cities of the Global South, 544-560.
[4] Salem, M. (2015). Peri-urban dynamics and land-use planning for the Greater Cairo Region in Egypt. Sustainable Development (2 Volume Set), 168: 1109.
[5] Ren, P., Gan, S., Yuan, X., Zong, H., Xie, X. (2013). Spatial expansion and sprawl quantitative analysis of mountain city built-up area. In Geo-informatics in Resource Management and Sustainable Ecosystem, 166-176. https://doi.org/10.1007/978-3-642-45025-9_19
[6] Ramachandra, T.V., Bharath, H.A., Sowmyashree, M.V. (2013). Analysis of spatial patterns of urbanisation using geoinformatics and spatial metrics. Theoretical and Empirical Researches in Urban Management, 8(4): 5-24. https://www.jstor.org/stable/24873360
[7] Suribabu, C.R., Bhaskar, J., Neelakantan, T.R. (2012). Land use/cover change detection of Tiruchirapalli City, India, using integrated remote sensing and GIS tools. Journal of the Indian Society of Remote Sensing, 40(4): 699-708. https://doi.org/10.1007/s12524-011-0196-x
[8] Maithani, S. (2010). Cellular automata based model of urban spatial growth. Journal of the Indian Society of Remote Sensing, 38(4): 604-610. https://doi.org/10.1007/s12524-010-0053-3
[9] Salem, M., Tsurusaki, N., Divigalpitiya, P., Osman, T. (2018). Driving Factors of Urban Expansion in Peri-Urban Areas of Greater Cairo Region, Real Corp 2018, Expanding Cities-Diminishing Space. https://conference.corp.at/archive/CORP2018_4.pdf.
[10] Follmann, A., Hartmann, G., Dannenberg, P. (2018). Multi-temporal transect analysis of peri-urban developments in Faridabad, India. Journal of Maps, 14(1): 17-25. https://doi.org/10.1080/17445647.2018.1424656
[11] Duranton, G., Puga, D. (2014). A Philippe and ND Steven. Handbook of Economic Growth. Chapter 5, The Growth of Cities, 781-853.
[12] Haas, J., Ban, Y. (2014). Urban growth and environmental impacts in Jing-Jin-Ji, the Yangtze, river delta and the pearl river delta. International Journal of Applied Earth Observation and Geoinformation, 30: 42-55. https://doi.org/10.1016/j.jag.2013.12.012
[13] Zhou, Q., Li, B., Chen, Y. (2011). Remote sensing change detection and process analysis of Long-Term Land Use Change and Human Impacts. Ambio, 40(7): 807-818. https://doi.org/10.1007/s13280-011-0157-1
[14] Jiang, F., Liu, S., Yuan, H., Zhang, Q. (2007). Measuring urban sprawl in Beijing with geo-spatial indices. Journal of Geographical Sciences, 17(4): 469-478. https://doi.org/10.1007/s11442-007-0469-z
[15] Sudhira, H.S., Ramachandra, T.V., Jagadish, K.S. (2004). Urban sprawl: Metrics, dynamics and modelling using GIS. International Journal of Applied Earth Observation and Geoinformation, 5(1): 29-39. https://doi.org/10.1016/j.jag.2003.08.002
[16] Punia, M., Singh, L. (2012). Entropy approach for assessment of urban growth: A case study of Jaipur, India. Journal of the Indian Society of Remote Sensing, 40(2): 231-244. https://doi.org/10.1007/s12524-011-0141-z
[17] Liu, F., Shi, L., Zhang, Z., Zhao, X. (2014). Evaluating Urban Expansion of Beijing during 1973-2013, by Using GIS and Remote Sensing. In International Conference on Geo-Informatics in Resource Management and Sustainable Ecosystem, pp. 635-642. https://doi.org/10.1007/978-3-662-45737-5_62
[18] Ramachandra, T.V., Aithal, B.H., Sanna, D.D. (2012). Insights to urban dynamics through landscape spatial pattern analysis. International Journal of Applied Earth Observation and Geoinformation, 18: 329-343. https://doi.org/10.1016/j.jag.2012.03.005
[19] Aburas, M.M., Abdullah, S.H., Ramli, M.F., Ash'aari, Z.H. (2017). Measuring and mapping urban growth patterns using remote sensing and GIS techniques. Pertanika Journal of Scholarly Research Reviews, 3(1).
[20] Subasinghe, S., Estoque, R.C., Murayama, Y. (2016). Spatiotemporal analysis of urban growth using GIS and remote sensing: A case study of the Colombo Metropolitan Area, Sri Lanka. ISPRS international Journal of Geo-information, 5(11): 197. https://doi.org/10.3390/ijgi5110197
[21] Allen, A. (2003). Environmental planning and management of the peri-urban interface: Perspectives on an emerging field. Environment and urbanization, 15(1): 135-148. https://doi.org/10.1177/095624780301500103
[22] Webster, D. (2002). On the Edge: Shaping the Future of Peri-Urban East Asia. Stanford: Stanford University Press.
[23] Woltjer, J. (2014). A global review on peri-urban development and planning. Jurnal Perencanaan Wilayah dan Kota, 25(1): 1-16.
[24] Kombe, W.J. (2005). Land use dynamics in peri-urban areas and their implications on the urban growth and form: The case of Dar EsSalaam, Tanzania. Habitat International, 29(1): 113-135. https://doi.org/10.1016/S0197-3975(03)00076-6
[25] Simon, D. (2008). Urban environments: Issues on the peri-urban fringe. Annual Review of Environment and Resources, 33: 167-185. https://doi.org/10.1146/annurev.environ.33.021407.093240
[26] McGee, T.G. (1991). Emergence of Desakota Regions in Asia: Expanding a Hypothesis, in The Extended Metropolis: Settlement Transition Is Asia, B.K. Norton Sydney Ginsburg, T. G. McGee, Editor. University of Hawaii Press.
[27] Bryant, C.R., Russwurm, L.H., McLellan, A.G. (1982). The City’s Countryside: Land and its Management in the Rural-Urban Fringe: Longman.
[28] Balestrat, M. (2009). Spatial Indicators for the Analysis of Peri-Urban Dynamics in the Languedoc Mediterranean area. Lodz, Poland. 17 p. ffhal-00566468f.
[29] World Bank. (2013). Using Geospatial Data to Track Changes in Urbanization. https://olc.worldbank.org/system/files/Using%20Geospatial%20Data%20to%20Track%20Changes%20in%20Urbanization.pdf.
[30] Joerin, F., Rondier, P. (2007). Chapitre 1. Les indicateurs et la décision territoriale. Pourquoi? Quand? Comment? In: Sénécal, Gilles (Dir.) Les indicateurs socioterritoriaux. Perspectives et renouvellement. (Translation: Chapter 1. Indicators and territorial decision. Why? When? How? In: Sénécal, Gilles (Dir.) Socioterritorial indicators. Outlook and renewal). Laval, PUL (Les Presses de l'Université de Laval): 9-36.
[31] De Rosnay, J. (1975). The macroscope, toward a global vision.
[32] UN Habitat. (2016). Goal 11 Make Cities and Human Settlements Inclusive, Safe, Resilient and Sustainable. https://unstats.un.org/sdgs/files/metadata-compilation/Metadata-Goal-11.pdf.
[33] Ndugwa, R.P. (2017). Geospatial Technologies for Monitoring the Urban Related SDGs-UN-Habitat Experiences, Nairobi Kenya. UN Habitat.
[34] Stuart, E., Samman, E., Avis, W., Berliner, T. (2015). The data revolution: Finding the missing millions. Overseas Development Institute. https://www.odi.org/sites/odi.org.uk/files/odi-assets/publications-opinion-files/9604.pdf.
[35] Bowyer, D. (2015). Measuring urban growth, urban form and accessibility as indicators of urban sprawl in Hamilton, New Zealand. Master Thesis in Geographical Information Science.
[36] Salem, M., Tsurusaki, N., Divigalpitiya, P. (2019). Analyzing the driving factors causing urban expansion in the peri-urban areas using logistic regression: A case study of the Greater Cairo region. Infrastructures, 4(1): 4. https://doi.org/10.3390/infrastructures4010004
[37] General Authority of Construction and Planning, and Tanta University. (2003). Urban Planning Project: The Development of Egyptian Villages.
[38] Google Earth. (2021). “Meet Assas” Village Satellite Map.
[39] United Nations. (2017). Experience Learned from Localization of the SDGs and Lessons Learned from Tuscany Florence. https://www.local2030.org/library/313/Localization-of-the-SDGs-Experiences-and-Lessons-learned-from-Tuscany.pdf.
[40] Fouda, Y.E., ElKhazendar, D.M. (2015). GIS based decision support system for auditing sustainable development in industrial cities – case of Borg Al-Arab city. J Arch Plan (APJ). Beirut, Lebanon: Beirut Arab University, 23(2014, 2015): 23-41. http://www.bau.edu.lb/BAUUpload/Library/Files/Architecture/Volume%2023/3.pdf.
[41] Fouda, Y.E., Elkhazendar, D.M. (2019). A criterion for modelling the ‘live-and-work’city index using sustainable development indicators. International Journal of Urban Sustainable Development, 11(1): 24-47. https://doi.org/10.1080/19463138.2018.1556161
[42] Alshuwaikhat, H.M., Aina, Y.A. (2006). GIS-based urban sustainability assessment: The case of Dammam city, Saudi Arabia. Local Environment, 11(2): 141-162. https://doi.org/10.1080/13549830600558432
[43] Sim, S. (2016). GIS Indicator on New Urbanist Communities in Southeastern US. Journal of Korean Society for Geospatial Information System, 24(2): 89-94. https://doi.org/10.7319/kogsis.2016.24.2.089
[44] Francis, M. (2006). Urban Parks as Community Places, Chuncheon G5 Symposium Talk. Korea.
[45] Campoli, J., MacLean, A. (2007). Visualizing Density. Cambridge, Mass: Lincoln Institute of Land Use Policy.