Dina Saleh* | Abeer Abd El Kawy
© 2021 IIETA. This article is published by IIETA and is licensed under the CC BY 4.0 license (http://creativecommons.org/licenses/by/4.0/).
OPEN ACCESS
The geoenvironmental risk assessment approach is one of the important approaches that provides new city planners with an important tool to cope with emerging environmental problems, such as pollution, epidemics, climate change, and flood. However, few scholars have explored the assessment of soil risk at the local level, which is common in new cities in Egypt. Ignoring the problematic soil in urban planning would present future risks for residents, undermine the effect of proposed land uses, and waste resources in plan implementation. To solve these problems, this paper carries out a risk assessment of problematic soil for the urban planning of New East Port Said City, aiming to ensure the efficiency of future land uses and the sustainability of similar new cities. The types of soil in the new city were summarized, which include soft clay soil, sabkha soil and sand dunes. With the aid of geographic information system (GIS) and remote sensing, the factors leading to the geological risk of each type of soil were detected separately. Besides, the vulnerability of proposed land uses was evaluated, and the geo-hazards of problematic soil were mapped comprehensively. On this basis, the land use plan was optimized for the new city according to the soil risks, and the land uses affected by soil risks. The research results shed new light on the application of environmental risk assessment in urban planning, and promote the risk mitigation, and sustainability of new cities.
geo-hazard, problematic soil, risk assessment, spatial, sustainable, urban land use, vulnerability
In recent decades, the world has witnessed many environmental problems resulting from natural changes, as well as urbanization effects, such as the growing settlement rate, the expanding urban societies, and the emerging land uses (e.g., industrial, service, and commercial). These phenomena attract much attention from researchers. However, the related studies mainly focus on the monitoring of these phenomena, and how they affect the natural environment. Relatively few scholars have examined the impact of environmental problems on the spatial distribution of land uses, and their negative influence on the societies’ pursuit of future goals. Among the environmental problems, the problematic soil presents a thorny issue to engineers, owing to its complex formation mechanism and the fast-changing ambient environment [1, 2].
The environmental problems change continuously, exerting a growing impact on various things, especially the urban area. Environmental risk assessment has become a necessary tool to mitigate the negative impacts of environmental problems on societies. Many international organizations, namely, the International Organization for Standardization (ISO) and the United Nations (UN) have paid attention to this tool. For example, the ISO divided risk assessment into three stages: risk identification, risk analysis, and risk evaluation. Risk identification aims to identify and describe the risk; risk analysis attempts to disclose the nature, components, sources, causes, and level of the identified risk; risk evaluation compares the results of risk analysis with the risk criteria to judge whether the expected risk level is acceptable [3].
In 2017, the UN described risk assessment as a qualitative/quantitative approach to measure environmental risks, and derive their scale and severity from the relationship between such three elements as hazard, exposure, and vulnerability. Hazard is a natural or human process/phenomena that might cause casualties, property damages, social/economic disturbances, and environmental degradation. These consequences could arise from different or the same sources, and might sometimes be sequential. Each hazard can be characterized by its impact, severity, scale, frequency, and likelihood [4]. Hazard, as a knowledge base, indicates the type of an environmental risk. Exposure refers to the state of unprotected contact with the environmental risk. Vulnerability is the magnitude of the physical/social/economic losses and damages induced by the environmental risk, and the overall risks brought by environmental problems [2, 4].
Other international evidences [5, 6] confirmed the close relationship between geo-environmental risk assessment and the sustainability of urban land use. This approach helps to clarify the objectives of urban land uses and mitigate geo-hazards by identifying risk sites, limiting development to low-exposure areas, and enabling access to safe areas for development [7]. In return, urban land use planning plays an important role in alleviating the problems created by geo-hazards. In urban planning, this reciprocal relationship can promote the sustainability of the environment, and the construction of sustainable and resilient urban societies [8, 9].
Despite the global/local interest in risk assessment, there is a deficiency in assessing the risk of problematic soil, which poses a serious threat to engineering, due to its complex formation mechanism and the fast-changing surrounding environment [10, 11]. The problematic soil may unexpectedly expand, swell, or collapse, or change in structure and strength, making the engineering structure unusable without resorting to improvement techniques [12].
By mechanics, the foundation soil can be divided into 12 types, namely, expansive/swelling soil, collapsing soil, soft clay soil, alluvial swelling soils, softened over-consolidated clay, fill soil, chemical swelling soil, weathered rocks, boulder, liquefied soil, moving sand dunes, and sabkha soil [13]. Different types of soil often overlap with each other, forming a complex soil layer. Therefore, it is difficult to identify the basic components that increase the risk of problematic soil, which could cause mudflows, land subsidence, soil expansion, and salinization [14].
The studies at the local level generally overlook the risk of problematic soil in site selection for urban development. In Egypt, the strategic urban plans for some new cities do not take account of the soil effects on urban projects. They have, at best, identified the total risks (macro-hazards) like earthquake and floor, failing to consider the partial risks (micro-hazards) that ensue. There is a severely lacking in the classification of soil types, and the evaluation of risk severity. Neither is there any suitable strategy to handle the risks before the occurrence of hazards.
For example, the urban land use plan (1979 version) for the 6th of October City was completely revised to adapt to the complex soil layers, which consists of collapsing soil, swelling soil, and fractured stones. The problematic soil pushes up the implementation cost of the land use plan by 70%, and increases the cost of utility networks and roads by 60% [15]. The planning for the 15th of May City, which has stony and swelling soils, lacks the knowledge of problematic soil at the site, because no guide session was held for the on-site soil [16]. Besides, the 10th of Ramadan City witnesses a conflict between the proposed land uses and the soil conditions: Industrial areas were planned in the southern part, which is located on collapsing soil. The conflict adds to the cost of soil treatment and road construction [17]. In the new city of Minya and Al Amal City, the sites selected for urban communities were proved unfit, due to the soil problems, which were ignored during urban planning. Similarly, the incompatibility between planned land uses and soil conditions occurred in several other new cities, namely, the new city of Rashid and the new city of Port Said. These cities face a high risk of flooding, as a result of erosion and sedimentation. Therefore, it is necessary to include soil risk assessment in new city planning, such that the planned land uses can be implemented efficiently, with little waste of money and labor [18].
The New East Port Said City is one of the various new Egyptian cities planned on problematic soil. The planned site involves three types of problematic soil, including soft clay soil, marsh soil, and sand dunes. The complex soil composition, plus the diverse geological factors, and strategic importance of the city, gives birth to diverse urban land uses in the city’s general strategy plan. This paper relies on geographic information system (GIS) and remote sensing to generate maps. The improperness of the site selection for the new city was summarized, in the light of the soil composition. About 40% (9,651 acres) of the planned area is covered by soft clay soil, 8% (2,049 acres) by marshy soil, and 52% (12,679 acres) by sand dunes [19]. The soil problems are intensified by the interaction with the changing ambient conditions, including hydraulics, hydrology, climate, and topography. Much of the planned area is under the sea level, or merely 0.5-1m above the sea level. If any storm hits the area, a large part will be submerged in water, and the wet soil will be more problematic. Therefore, this paper assesses the geological risks brought by the complex soil in the city, and evaluates the degree and severity of the risks. Besides, the most affected areas and land uses were determined, and the planned land uses were rearranged in proportion to the degrees of soil risks. The research results help to reduce the cost, maximize the benefits, and achieve the sustainable development for the new city.
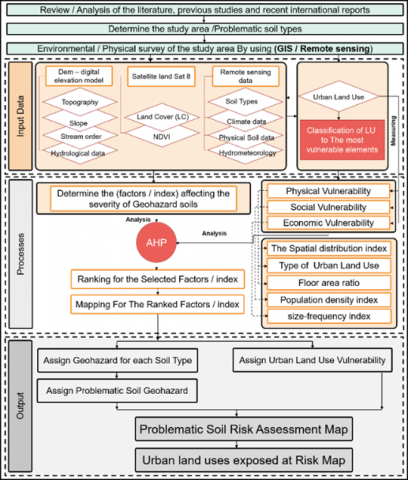
The research aims to present a methodology for applying the approach of Soil Risk Assessment in planning decisions. With the help of the literature and previous studies and recent international reports about the methods of measuring Soil Risk Assessment we are able to propose this approach.
This is to determine the extent to which the soil problem has been taken into account when selecting its location or proposing land use within it. As shown in Figure 1.
Figure 1. Methodological framework of the study
$R=H \times V$ (1)
where, R is risk; H is geo-hazard; V is vulnerability. The maps of the city were synthetized with the aid of the GIS and remote sensing.
3.1 Location and area
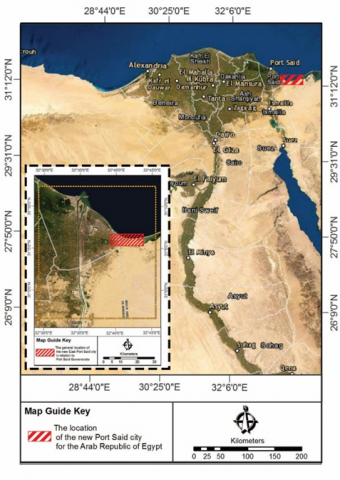
As part of the development plan for the Suez Canal region, the New East Port Said City is the first new coastal city planned to the east of the Suez Canal. Covering an area of 22,000 acres, the new city lies on the northwestern tip of the Sinai Peninsula in the northeast of Egypt. The city is bordered by a 35km-long coastline along the Mediterranean on the north, the Suez Canal Development Project and the Port Said City on the west, Lake Bardawil on the east, and 50,000 acres of agricultural area on the south. As shown in Figure 2, the city is cut through by the Peace Canal. Centering on sustainable development and clean energy, the planning for the city aims to accommodate about one million people to relieve the pressure on Port Said Governorate [20].
Figure 2. Geographical location of new east port said city
3.2 Proposed land use plan
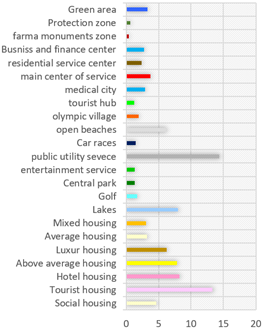
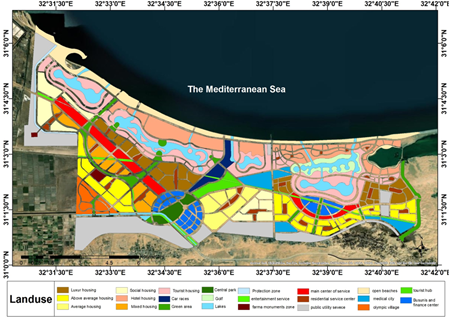
The new city is planned to have a residential area of 15,570.93 acres, and a leading global tourist city in the region. The proposed land uses of the city include international hotels, artificial islands, a fashion city, a university, green areas, a Disneyland, entertainment areas, a medical city, marina yachts, the largest seawater desalination plant in Africa, tourist resorts, an international research center, an international conference and exhibition center, an Olympic city, a golf club, an international yacht marina, Formula One race circuit, etc. (Figures 3 and 4) [20].
Figure 3. Percentage of proposed urban land use of study area
Figure 4. The Proposed urban land use plan for new east port said city
3.3 Environmental features
3.3.1 Basic geological conditions
The mud in the Port Said region mainly comes from the sediments of the Pelusiac Branch of the Nile River. During the Holocene, many sediments were formed in the area between Damietta branch and the Gulf of Al-Tina, where many branches of the Nile converge, including the Pelusiac, Tanitic and Mendesian. These branches are non-existent today, as they have faded due to silt accumulation and flood control [21].
As part of the Al-Tina Plain, the entire region of East Port Said has a heavy presence of thick muddy sediments reaching 50m below the ground. The mud has a very soft to soft texture near the ground level, which gradually changes with the growing depth [22].
During the Pleistocene, the sea level of the Mediterranean changed continuously. Due to the transgression of the sea, the Nile Delta retreated several times, leaving colossal salty mud and sediments [23]. The mud of Port Said is characterized by high salinity and alkalinity, as a result of the intrusion from Lake Al-Malaha at the bottom of the mud base of the Al-Tina Plain [24].
3.3.2 Surface soil
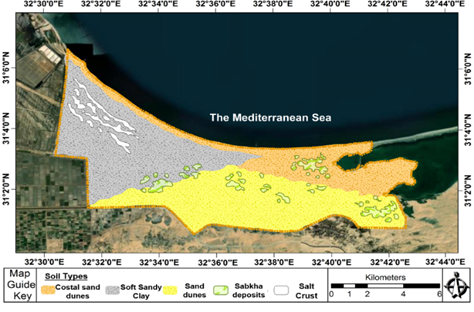
The surface soil of the study area varies from region to region (Figure 5). The new city is covered by soft clay soil in the northwest, coastal sand dunes in the north and northeast, and sand dunes in the south. Under the salt penetration from Lake Al-Milaha, which occupies about 30% of the Al-Tina Plain [25], creates a salty curst, such that a layer of sabkha soil carpets the ground.
Figure 5. The surface soil of study area
Accordingly, the soil profile of the study area is divided into three main components, which are [26].
As for the groundwater level, it is located at a depth ranging between 0.5 m to 1.5 m below the ground level. The depth of one meter below the ground level has been adopted in the academic analyses.
3.3.3 Physical and geographical features
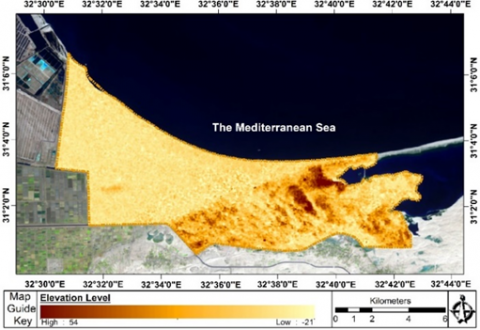
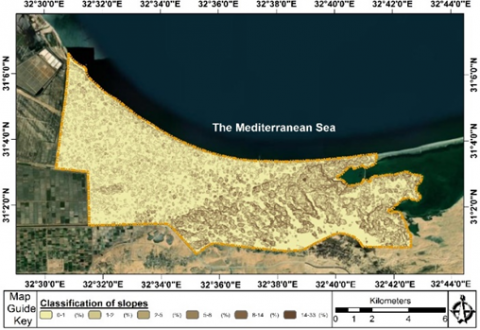
Topographically, the study area is a flat land with a wavey surface, with the presence of sand. The elevation is low, ranging between -21m and 54m [19] (Figure 6), as indicated by the digital elevation model (DEM). The satellite images of the study area were processed on ArcGIS, and imported to the DEM. The results show that the largely flat land dips to the south, and the gradient could reach up to 33% (Figure 7).
Figure 6. Topographic index of the study area
Figure 7. The slopes and tendencies Map
3.3.4 Geomorphological conditions
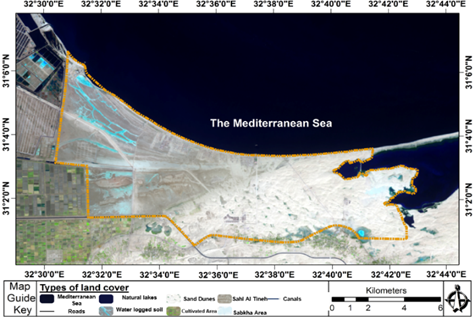
To determine the geomorphological features of the new city, the land cover of the study area was evaluated by processing the Landsat 8 Collection 1 Tier 1 and Real-Time (LCO 8-L1TP-RT) data in 2000 on GIS. It was found that the city encompasses five geomorphological units: Mobile Sand Dunes, The Costal Area, Sabkha Area, Water Logged Area, and Cultivated Area (Figure 8).
Figure 8. The land cover index of study area
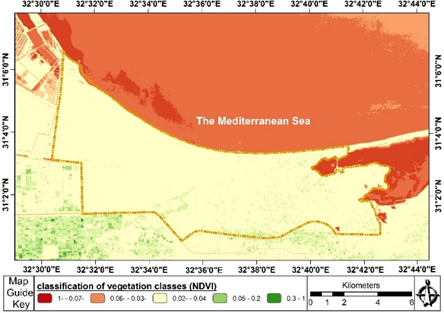
3.3.5 The vegetation cover (Normalized difference vegetation index – NDVI)
The natural plant index was mapped by processing the LCO 8-L1TP-RT data in 2020 on GIS. The NDVI was calculated by:
$N D V I=\frac{(N I R-R e d)}{(N I R+R e d)}$ (2)
where, Red and NIR are the spectral reflectance acquired in the red (visible) and near-infrared bands, respectively [27].
From west to east, the vegetation density generally decreases in the new city, but slightly increases near Lake Bardawil. From north to south, the DNVI ranges between 0.14µm and 0.26µm. The vegetation spreads to sabkha soil regions, making the soil in these regions even saltier (Figure 9).
Figure 9. Normalized difference vegetation index – NDVI
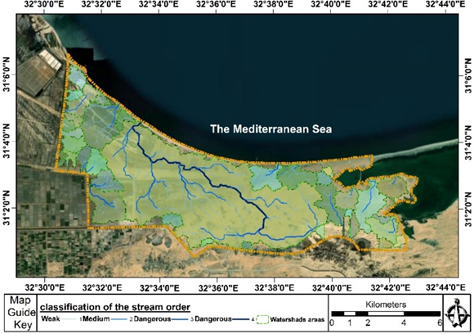
3.3.6 Hydrological conditions
Lying between the Mediterranean and Lake Bardawil, the new city has many hydraulic features. The proximity to the Red Sea brings frequent torrential rains, which threaten the geological stability of the city, especially the soft clay soil (Figure 10). One of the hydrological features is the large and extended aquifer connected to the Nile Delta reservoir in the northwest. The aquifer has a large hydraulic slope up to 50cm/km to the depressions in the east and north. The depressions drain the excess water on the surface and underground. The salinity of the soil approaches that of sabkhas, due to high evaporation rate, and the shallow depth [28].
Figure 10. Torrential rains of study area
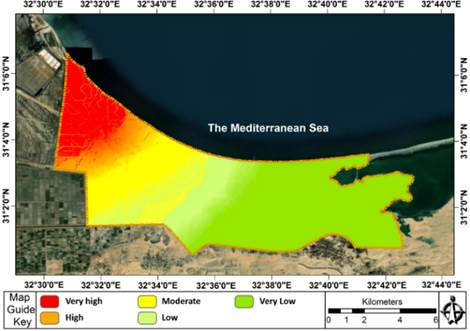
3.3.7 Normalized Differential salinity index (NDSI)
The NDSI was mapped by processing the LCO 8-L1TP-RT data in 2020 on GIS. The value of NDSI can be calculated by:
$N N D S I=\frac{(R-N I R)}{(R+N I R)}$ (3)
where, Red and NIR are the spectral reflectance acquired in the red (visible) and near-infrared bands, respectively [29] (Figure 11).
Figure 11. Normalized Differential salinity index (NDSI)
Overall, the salinity of the soil is relatively high in the northeast of the new city. In this region, the low terrain allows seawater to penetrate the soil, causing the rise of salinity. By contrast, the soil salinity is relatively low in the northwest.
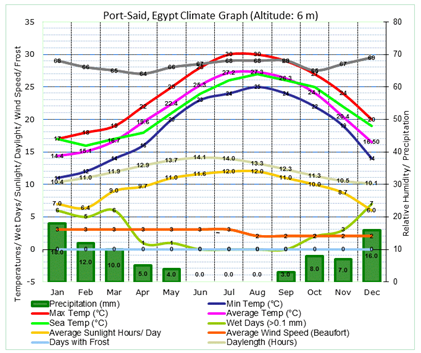
3.3.8 Climate conditions
As shown in Figure 12 [28], the temperature of the study area fluctuates between 24℃ and 28℃ throughout the year. On average, the highest and lowest temperatures stand at 30.4℃ and 11.2℃, respectively. During the summer months, the temperature ranges within 18℃ and 31℃. During the winter, the variation takes place between 7℃ and 21℃. The mean relative humidity changes from 67% to 72.5%. The mean rainfall ranges from 80mm/year to 100mm/year. Most rainfall occurs from November to the next March. The wind speed is around 17.2km/h from November to next January, and 8.1km/h from July to August. On average, the solar radiation falls in 113kWh/m2/year-175kWh/m2/year.
Figure 12. Climate data of study area
Several data were collected and analyzed in this study, which focuses on the characteristics of soil and some natural features, such as topography, slope, tendencies, Normalized difference vegetation index and Normalized Differential salinity index (NDSI). It comes through using Remote Sensing data (in digital elevation models, DEMS, Land Sat 8) with accuracy of 30meters utilized, and from Egyptian Ministry of Environment' reports. On the other side, the characteristics of land uses in the case study, such as land use planning, population density, Floor area ratio were collected from the website of New Urban Communities Authority. And all the environmental and urban characteristics were analyzed by using Geographic Information Systems and some models as shown in the following points.
4.1 AHP evaluation model
The Analytic Hierarchy Process (AHP) Model is a popular way to assess the geo-hazards/risks of the soil [30, 31]. This technique does well in normalizing and weighing the factors and indices for each type of soil:
$A=\left|\begin{array}{ccc}f_{a 1} & f_{a 2} & f_{a 3} \\ f_{a 4} & \ldots & \ldots \\ \cdots & \ldots & f_{a n}\end{array}\right|$ $B=\left|\begin{array}{ccc}f_{b 1} & f_{b 2} & f_{b 3} \\ f_{b 4} & \ldots & \ldots \\ \cdots & \ldots & f_{b n}\end{array}\right|$
$C=\left|\begin{array}{ccc}f_{c 1} & f_{c 2} & f_{c 3} \\ f_{c 4} & \ldots & \ldots \\ \ldots & \ldots & f_{c n}\end{array}\right|$ $f_{a 1}=\left|\begin{array}{ccc}i_{f a 1} & i_{f a 2} & i_{f a 3} \\ i_{f a 4} & \ldots & \ldots \\ \ldots & \cdots & i_{f a n}\end{array}\right|$ (4)
where, (A, B, C) is a type of surface soil in the new city; (f) is the geo-environmental factors affecting the soil type; (i) is a standard index used to analyze the geo-environmental factors for each type of soil.
Through weight assignment, the weight of each factor was determined under each criterion, using the pairwise comparison matrix (PCM). That is, a weight was assigned to each factor according to its importance relative to other factors. The PCM and factor weights of each soil type are given in Tables 4-6. The geometric mean, i.e., the weights multiplied by the root of their numbers, was taken for subsequent analysis [32].
$G M=\sqrt[n]{f 1 * f 2 * f 3 * . . f n}$ (5)
4.2 Geo-hazard factors/indices
The geo-hazard indices for each type of surface soil in the study area (soft clay soil, sabkha soil, and sand dunes) were determined in reference to previous studies. The geo-environmental factors contributing to the geo-hazards of the soil include geotechnical factors, geological factors, geomorphological factors, topographic factors, elevation, climate factors, hydrological factors, biological factors, and other macro hazards (e.g., torrential rain, earthquake, and flood). Under these factors, a set of indices was designed to measure the soil risk. Each index was given a weight, reflecting its impact on soil problems.
4.2.1 Geo-hazard indices of soft clay soil
The new city is an integral part of the Al-Tina Plain. The surface soil consists of very fine to cohesive clay extending to more than 50m-deep. The clay soil is penetrated by the salt from Lake Al-Malaha, which occupies about 30% of the plain [33]. The main problem of soft clay is high compressibility, and low texture (0.5kg/cm2 (50kN\m2)). The facilities and buildings on this type of soil are very vulnerable.
The gains of the soft clay are known for their creep features [34]. If the soil is improperly used for construction, subsidence will easily occur under direct external pressure. This is the most frequent geo-hazard associated with soft clay [35]. The geo-hazards could be induced by a number of factors of the ambient environment. The most prominent factors are the geotechnical factors of the soil, including moisture content along depth, clay activity, plasticity, and liquidity. Our tests on soil samples show that the moisture content of soft clay increased from 40% on the surface to 80% at the depth of 35m, and remained constant despite further increase of depth. The clay area ranged from 0.8 to 1.6 at the depth of 10m; 50% of the samples were naturally clay, and the rest are active. The plasticity increased with the depth with a slope of 1.0, i.e., ΔPI-Δz, at the depth of 15m, and ranged from 0.4 to 0.8 at greater depth. Hence, the surface soil of the new city is very soft up to the depth of 35m, and solid at greater depths (Table 1).
To evaluate the swell-shrink grade more scientifically, the following geotechnical factors could be adopted: standard absorption moisture content, free expansion rate, plasticity index, and swelling potential [36]. The soft clay is affected by several other geo-environmental factors:
(1) Geo-morphological factors
The geo-morphological factors include groundwater table, soil structure, soil color, surface texture, soil consistency, and texture groups.
(2) Geological factors
The geological factors include soil depth, soil thickness, and soil composition, which can be obtained through detailed analysis on site history and geological maps [37].
(3) Hydro-meteorological factors
Hydro-meteorological factors play an important role on soil expansion. Among them, rainfall intensity and rainfall duration are the leading causes of the damage of expansive soil [35]. The more intense and longer the rainfall, the smaller the geo-hazards of soft clay.
(4) Other factors
Hydrology source and drainage measures also affect the geo-hazards of soft clay [36].
Table 1. Geotechnical indices of soft clay soil
|
Geotechnical index |
Min |
Max |
|
Depth (m) |
10 |
35 |
|
moisture content (%) |
40 |
80 |
|
Clay activity |
0.8 |
1.6 |
|
plasticity index (PI %) |
0.4 |
0.8 |
|
Texture |
Very soft until 35 m |
|
4.2.2 Geo-hazard indices of sabkha soil
The sabkha soil in the new city is a mixture of clay and silt clusters, and evaporation deposits, which are often covered by temporary salt crusts that dissolve in the winter. The soil is mainly found in low-lying areas or depressions that are slightly below the sea level. The soil surface is generally flat and humid, with a high content of evaporite sediments [37]. This type of soil has a high presence in the study area, thanks to the proximity to the Mediterranean and Lake Al-Malaha. The salt water easily seeps into the surface soil of the area, increasing its salinity and producing widespread salty crusts. Overall, about 10% of the study area is covered by sabkha soil.
The geotechnical properties of sabkha soil were measured by dry density (tons/m3), moisture content (%), liquid limit (LL%), plasticity limit (PL%), plasticity (PI%), sand percentage (%), silt percentage (%), clay percentage (%), specific gravity (Gs), cohesion (kN/m2), and internal friction angle. After testing 14 samples of sabkha soils, it was found that the percentage of materials passing through 200-mesh sieve varied greatly from 20% to 90%, a sign of the varied proportions of fine particles (clay and silt). The liquid limit and plasticity limit are variable, indicating that the soil has a poor bearing capacity (Table 2). The sabkha clay is affected by several other geo-environmental factors:
Table 2. Geotechnical indices of sabkha soil
|
Geotechnical index |
Max |
Min |
|
Dry Density (DD) Ton/m3 |
1.88 |
1.30 |
|
Natural water content (NWC%) |
83.5 |
1 |
|
Liquid limit (LL %) |
83 |
30 |
|
Plastic Limit (PL %) |
80 |
20 |
|
plasticity index (PI %) |
39 |
Not Plasticity |
|
Sand Ratio (%) |
97 |
18 |
|
Clay Ratio (%) |
90 |
18 |
|
Silt Ratio (%) |
97 |
20 |
|
Specific Gravity (GS) |
2.82 |
2.51 |
|
Cohesion (C(KN/m2)) |
0.54 |
0 |
|
Angle of internal friction φ (degrees) |
22 |
0 |
(1) Geomorphologic factors
The geomorphologic factors include surface topography, and fault effect (fault is the main determinant of the origin sites of sabkha soil) [38].
(2) Biological factors
Natural plants greatly affect the structure and formation of the sabkha soil. Natural plants can trap sediment, and increase the elevation of sabkha surface, creating hillocks on the top. However, the high salinity could kill natural plants, leaving white salt spots on the soil surface [39].
(3) Climate factors
Temperature and other climate factors have a great bearing on the evaporation and salt concentration in the depressions. In summer, the high temperature dries up the sabkha surface. Under the capillary action, groundwater rises to the top, carrying the salts dissolved in the geological layers along the way. The repetition of this process pushes up the percentage of salts on the surface. This is a major factor for salinization of sabkhas soil, second only to seawater invasion.
The wind also plays an important role in changing the morphology of coastal sabkha soil, because the wind-driven waves transport medium and soft sediments to the edges of the sabkha soil. As the sediments gradually dry, some parts of the soil become tall and dry.
The rain is a main water source of the sabkha soil, as it creates torrential flows in the valleys. The flows carry huge amounts of sediments, creating beaches on the estuaries of these valleys. The beaches are rebuilt by marine currents, forming coastal sabkha soil [40].
(4) Hydrological factors
Both surface water and groundwater supply materials used to form the sabkha soil. In sabkha covered regions, the groundwater is usually no deeper than 1.5m. The net evaporation rate could affect the sabkha formation. In the study area, this rate is 6cm/year for the groundwater.
The permeability of sabkha soil is 124cm/year. It depends on the size and cohesion of the particles making up the soil. In general, groundwater passes through sabkha soil no faster than 10-6m/s. In the study area, this speed is about 10-5m/s, reflecting the permeability in the horizontal direction.
The marine currents facilitate the formation of sabkha soil along the coast, as they transport sediments and distribute them on the coast. The sediments carried by the marine currents are mostly soft and medium sands between 0.1mm and 0.5mm. They are transported at the speed greater than 15cm/s. However, the effect of marine currents on the formation and shaping of coastal sabkha soil is limited by the coral frames before the shoreline [40].
4.2.3 Geo-hazard Indices of sand dunes
The sand dunes bring serious geo-hazards to the study area, because they could creep along the wind towards the city. The creep of sand dunes are the leading geomorphological hazards associated with the climate, which might boost or suppress the movement [41]. The geo-hazards of sand dunes also come from the following factors:
(1) Geotechnical factors
The geotechnical factors include the scale of sand dunes, the abundance of sand supply, the size of the dominant particles, and the soil texture index [21] (Table 3).
Table 3. Geotechnical indices of sand dunes
|
Geotechnical index |
Max |
Min |
|
size of sand dunes |
1.2 mm |
0.05 mm |
|
the abundance of sand supplies to the dunes |
0.86 mm |
0 |
|
size of the dominant particles |
1 mm |
0.08 mm |
(2) Geomorphological factors
The geomorphological factors are represented by topography, height of sand dunes, elevation of land surface, slope gradient, and the main physical features of the site.
(3) Climate factors
Climate directly bears on the severity of the geo-hazards of sand encroachment. The representative factors are wind speed, wind direction, moisture content, and rainfall intensity.
4.3 Geo-hazard of problematic soil in the study area
The preceding paragraphs determine the influencing factors of problematic soil and their influencing ranges, as well as the standard geo-environmental indices of each type of soil. Then, the weight of each factor was determined with a geometric mean, using the AHP. The maps of these factors and indices were merged into a map of the risk degree for each type of soil. Next, the final maps of the three types of soil were integrated into one combined map to measure the geo-hazard of problematic soil in the study area:
$G H=A+B+C$ (6)
where, GH is the geo-hazard of problematic soil; A, B, and C is the three types of soil in the final map (Figure 13).
Figure 13. Methodological concept of Problematic Soil Geo-Hazard analysis
4.4 Urban land use vulnerability index
The factors and indices of urban land use vulnerability induced by the expected risk of problematic soil were determined by reviewing the theoretical and intellectual frameworks and global experiences. The indices extracted from previous studies were classified into three criteria:
Physical vulnerability means the vulnerability of the physical elements at risk, including the class, quality, distribution pattern, and expected degree of loss for urban land uses. This vulnerability can be measured by the type of use index, the spatial distribution index, and the structural density index [42, 43].
Social vulnerability means the potential impacts of geological risks on the target population of the study area. This vulnerability can be derived from the density, social features, and problem-solving ability of the population, using the relative density index [43, 44].
This criterion represents the extent to which the economic side of the society is affected by geological risk resulting from soil types and measuring the potential effects of risks on economic assets and processes using the spatial distribution index of the frequency of urban land use [45, 46].
Figure 14 shows the selected indices, standardized criteria, as well as the weight of each index, which reflects the degree of impact on land use, and the vulnerability values.
Figure 14. Urban land use vulnerability index
The above analysis determines the weight for every geological risk of clay soil, sabkha soil, and sand dunes, studies the effect of urban land use, and generates the relevant maps. On this basis, the hazardous places were identified, and the prevention measures were proposed.
As mentioned before, it is important to implement geological risk assessment and carry out geotechnical analysis before planning the new city. The relevant results show that the north of the study area should be excluded from the plan, because of the presence of clay soil and the proximity to the coasts. The dunes will be penetrated by seawater, causing construction failure in this part.
According to the vulnerability indices of urban land uses, it was found that the most affected land uses are roads, infrastructure, and facilities of high economic value, such as the medical city and the economic investment area. Meanwhile, the least affected land uses are open areas like green area and golf club.
5.1 Geo-hazard of soft clay soil
The geo-hazard indices of soft clay soil were weighed by the previous methods [33-36]. It was found that the indices of geotechnical factors and hydro-meteorological factors have the greatest inhibiting or promoting effect on the geo-hazard of soft clay soil. By applying the weights, the highest risk areas of soft clay soil quality were identified as the part in the far northwest of the study area. The risks decrease from west to east (Figure 15). The geo-hazard of soft clay soil is recorded in Table 4.
Figure 15. Geo-hazard of soft clay soil map
5.2 Geo-hazard of sabkha soil
Figure 16. Sabkha soil geo-hazard map
The geo-hazard indices of sabkha soil were weighed by the previous methods [37]. It was found that geotechnical factors, and climate factors (e.g., temperature, capillary action, and rainfall) are top influencing factors of the nature and risks of sabkha soil. The second important impactors include geomorphological factors like soil nature and slope, followed by biological, and hydraulic factors. By applying the weights, the highest risk areas of sabkha soil quality were identified as the central parts of the new city. The risks decrease from the southeast to the northwest (Figure 16). The geo-hazard of sabkha soil is recorded in Table 5.
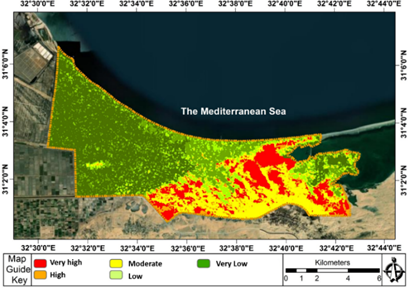
5.3 Geo-hazard of sand dunes
The geo-hazard indices of sand dunes were weighed first. It was found that the geotechnical factors are the most influential factors, which determine the dune size and particle size. Climate factors also have a major promoting effect on the geo-hazard of sand dunes. Then come the geomorphological factors and geological factors. In addition, the highest risk areas of sand dunes were identified as the northeast parts, which are close to the Mediterranean coast. Apart from the proximity to the sea, the high risks in these parts are also attributed to the fact that the wind intensity decreases from north to south (Figure 17). The geo-hazard of sand dunes is recorded in Table 6.
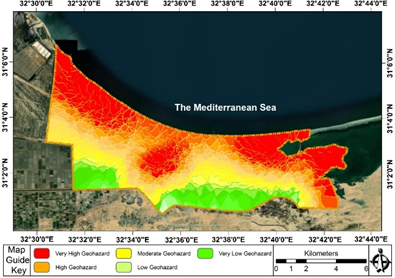
5.4 Geo-hazard of problematic soil
The final maps were compiled, and merged into one combined map to assess the geo-hazard of each type of soil forming in the planned area. The combined map shows that the most vulnerable areas to the geo-hazard of problematic soil concentrate in the north, where the various geo-environmental factors pose serious risks. The geo-environmental factors in this part include climate factors, hydraulic factors, and the transgression of the Mediterranean to the low level of ground, which saturates the soil and increases the danger. The severity of geo-hazard decreases from north to south (Figure 18).
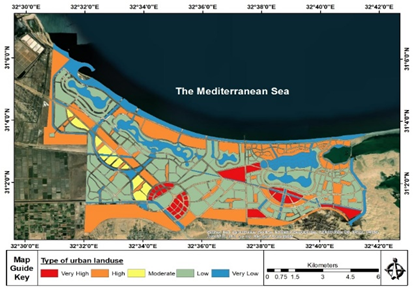
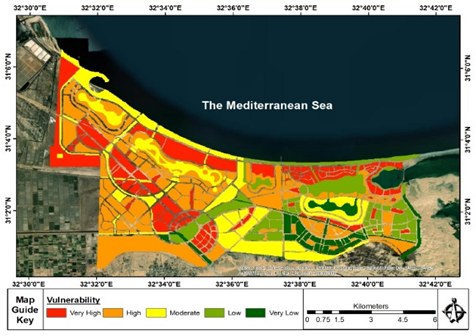
5.5 Urban land use vulnerability
According to the indices for the vulnerability of urban land uses to the geo-hazard of problematic soil, the most affected land uses are roads, infrastructure, and facilities of high economic value, such as the medical city and the economic investment area. Meanwhile, the least affected land uses include open areas like green areas, the golf club, and the lakes. The residential areas are affected to varied degrees. The vulnerability of hotel housing and mixed housing is relatively high due to the high building density, and relatively low in distinct housing areas.
Table 4. Weight analysis of soft clay soil geo-hazard
|
Weight |
Multiplication Factors |
$\boldsymbol{A} \boldsymbol{f}_{a 6}$ |
$\boldsymbol{t} \boldsymbol{f}_{a 6}$ |
$\boldsymbol{h f}_{a 5}$ |
$\boldsymbol{h} \boldsymbol{f}_{a 4}$ |
$\boldsymbol{G} \boldsymbol{f}_{a 3}$ |
$G f_{a 2}$ |
$\boldsymbol{G f}_{a \mathbf{1}}$ |
Factors |
|
3.0844 |
8192 |
4 |
4 |
4 |
2 |
8 |
8 |
1 |
$\boldsymbol{G f}_{a \mathbf{1}}$ |
|
0.5 |
0.00390625 |
0.5 |
0.5 |
0.5 |
0.25 |
1 |
1 |
0.125 |
$G f_{a 2}$ |
|
0.5 |
0.00390625 |
0.5 |
0.5 |
0.5 |
0.25 |
1 |
1 |
0.125 |
$\boldsymbol{G} \boldsymbol{f}_{a 3}$ |
|
1.296 |
8 |
2 |
2 |
1 |
1 |
4 |
1 |
0.5 |
$\boldsymbol{h} \boldsymbol{f}_{a 4}$ |
|
0.917 |
0.5 |
1 |
1 |
1 |
0.5 |
2 |
2 |
0.25 |
$\boldsymbol{h f}_{a 5}$ |
|
0.917 |
0.5 |
1 |
1 |
1 |
0.5 |
2 |
2 |
0.25 |
$\boldsymbol{t} \boldsymbol{f}_{a 6}$ |
|
0.917 |
0.5 |
1 |
1 |
1 |
0.5 |
2 |
2 |
0.25 |
$\boldsymbol{A} \boldsymbol{f}_{a 6}$ |
Table 5. Weight analysis of sabkha soil geo-hazard
|
Weight |
Multiplication Factors |
$\boldsymbol{h} \boldsymbol{f}_{b 6}$ |
$b f_{b 5}$ |
$C f_{b 4}$ |
$\boldsymbol{G} \boldsymbol{f}_{b 3}$ |
$G \boldsymbol{f}_{b 2}$ |
$\boldsymbol{G} \boldsymbol{f}_{b 1}$ |
Factors |
|
1.65 |
54 |
3 |
3 |
1.5 |
2 |
2 |
1 |
$\boldsymbol{G} \boldsymbol{f}_{b 1}$ |
|
0.98 |
0.84375 |
1.5 |
1.5 |
0.73 |
1 |
1 |
0.5 |
$G \boldsymbol{f}_{b 2}$ |
|
0.98 |
0.84375 |
1.5 |
1.5 |
0.73 |
1 |
1 |
0.5 |
$\boldsymbol{G} \boldsymbol{f}_{b 3}$ |
|
1.21 |
4.740652 |
2 |
2 |
1 |
1.33 |
1.33 |
0.67 |
$C f_{b 4}$ |
|
0.722 |
0.0740685 |
1 |
1 |
0.5 |
0.67 |
0.67 |
0.33 |
$b f_{b 5}$ |
|
0.722 |
0.0740685 |
1 |
1 |
0.5 |
0.67 |
0.67 |
0.33 |
$\boldsymbol{h} \boldsymbol{f}_{b 6}$ |
Table 6. Weight analysis of sand dunes geo-hazard
|
Weight |
Multiplication Factors |
$\boldsymbol{G f}_{c \mathbf{4}}$ |
$\boldsymbol{G f}_{c \mathbf{3}}$ |
$\boldsymbol{G f}_{c \mathbf{2}}$ |
$\boldsymbol{G f}_{c \mathbf{1}}$ |
Factors |
|
1.106 |
2.25 |
1 |
1.5 |
1.5 |
1 |
$\boldsymbol{G f}_{c \mathbf{1}}$ |
|
0.905 |
0.4489 |
0.067 |
1 |
1 |
0.67 |
$\boldsymbol{G f}_{c \mathbf{2}}$ |
|
0.905 |
0.4489 |
0.067 |
1 |
1 |
0.67 |
$\boldsymbol{G f}_{c \mathbf{3}}$ |
|
1.106 |
2.25 |
1 |
1.5 |
1.5 |
1 |
$\boldsymbol{G f}_{c \mathbf{4}}$ |
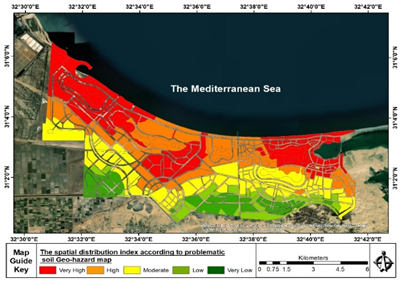
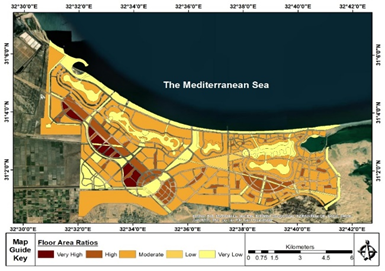
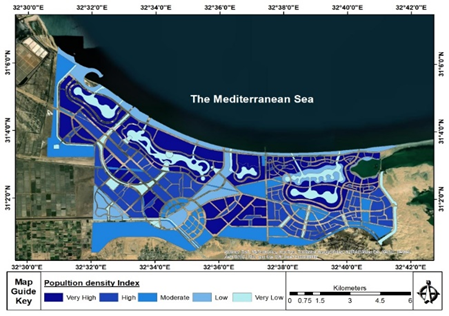
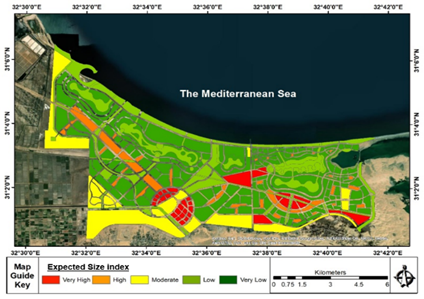
Figure 19 shows the most affected areas in the north, northeast, and northwest of the study area. Figure 20 displays the most affected land uses further in the south. The land uses were classified by the degree of geo-hazard of problematic soil. Under the geo-hazard, the medical city tends to suffer the highest potential loss, followed in turn by essential facilities, services land, commercial land, residential land, and recreational and open land. Figure 21 presents the results obtained by the floor area ratio index. Figure 22 shows the social vulnerability values measured by population density index. Figure 23 displays the economic vulnerability values measured by the Expect size index on service uses and activities. Figure 24 shows the most affected areas in the north, northeast, northwest, and further in the south. Table 7 lists the vulnerability indices and index weights.
Figure 17. Sand dunes geo-hazard map
Figure 18. Problematic soil geo-hazard map
Figure 19. The spatial distribution index according to problematic soil geo-hazard map
Figure 20. The type of use most affected by problematic soil geo-hazard map
Figure 21. Floor area ratio index
Figure 22. Population density index
Figure 23. Expected size index
Figure 24. Urban land use vulnerability map
Table 7. The vulnerability index and its weight
|
Vulnerability Index |
Economic Vulnerability |
Social Vulnerability |
Physical Vulnerability |
Sub Main Land Use |
Main Land Use |
|
0.844 |
0.32 |
0.9 |
0.9 |
Luxury Housing |
Residential Land
|
|
0.917 |
0.7 |
0.9 |
0.8 |
Above average Housing |
|
|
0.917 |
0.7 |
0.9 |
0.8 |
Average Housing |
|
|
0.867 |
0.32 |
1 |
1 |
Social Housing |
|
|
0.917 |
0.7 |
0.9 |
0.8 |
Mixed Housing |
|
|
0.917 |
0.7 |
0.9 |
0.8 |
Hotel Housing |
|
|
0.757 |
0.3 |
0.4 |
0.9 |
Tourist Housing |
|
|
0.807 |
1 |
0.6 |
0.3 |
Main Center of Services |
Services Land |
|
0.852 |
0.1 |
0.7 |
0.4 |
Residential domains Services centers |
|
|
0.645 |
0.3 |
0.2 |
0.5 |
Public Utility Services |
|
|
0.702 |
0.2 |
0.5 |
0.6 |
Entertainment Services |
|
|
0.645 |
1 |
0.1 |
0.3 |
Beach Services |
|
|
0.760 |
0.2 |
0.7 |
0.8 |
Business and Finance Center |
Business Land |
|
0.891 |
0.4 |
1 |
1 |
Medical City |
Research land |
|
0.421 |
0.1 |
0.1 |
0.1 |
Open Beaches |
Recreational Land |
|
0.630 |
0.5 |
0.1 |
0.5 |
Central Park |
|
|
0.421 |
0.1 |
0.1 |
0.1 |
Golf |
|
|
0.645 |
1 |
0.1 |
0.3 |
Olympic Village |
|
|
0.930 |
0.8 |
0.7 |
1 |
Tourist Hub |
|
|
0.630 |
0.5 |
0.5 |
0.1 |
Car races |
|
|
0.421 |
0.1 |
0.1 |
0.1 |
Lakes |
Open Land |
|
0.630 |
0.5 |
0.5 |
0.1 |
Protection Zones |
|
|
0.421 |
0.1 |
0.1 |
0.1 |
Green areas |
|
|
0.930 |
0.7 |
0.8 |
1 |
Roads |
Facilities land |
Table 8. Areas exposed to risk for each land use of study area
|
Urban Land Use |
Very High |
High |
Moderate |
Low |
Very low |
|
Luxury Housing |
260.258 |
275.896 |
2.045 |
719.072 |
238.031 |
|
Above average Housing |
123.224 |
391.069 |
416.249 |
261.587 |
226.658 |
|
average Housing |
41.281 |
6.496 |
64.927 |
187.433 |
277.775 |
|
Social Housing |
75.740 |
97.529 |
110.610 |
75.786 |
492.086 |
|
Hotel Housing |
124.316 |
449.218 |
71.085 |
160.642 |
328.498 |
|
Mixed Housing |
31.549 |
247.745 |
12.466 |
8.392 |
270.392 |
|
Tourist Housing |
213.061 |
419.182 |
169.115 |
689.585 |
921.522 |
|
Car Races |
16.715 |
160.906 |
0.000 |
86.239 |
0.00 |
|
Green area |
52.646 |
110.536 |
86.216 |
113.013 |
194.212 |
|
Central Park |
9.985 |
0.000 |
8.377 |
34.543 |
138.011 |
|
Golf |
0.000 |
0.000 |
8.539 |
219.083 |
76.302 |
|
Lakes |
147.585 |
372.316 |
42.536 |
448.915 |
438.396 |
|
Protection Zone |
0.000 |
0.000 |
0.000 |
0.000 |
111.537 |
|
Entertainment Services |
3.620 |
36.873 |
62.049 |
61.530 |
75.976 |
|
Farma Monuments Zone |
23.291 |
22.325 |
2.249 |
3.034 |
23.663 |
|
Main Center of Service |
11.449 |
179.306 |
79.059 |
112.625 |
300.342 |
|
Residential Service Center |
34.454 |
100.810 |
61.635 |
129.191 |
100.006 |
|
Public Utility Service |
30.561 |
104.571 |
485.966 |
83.704 |
948.591 |
|
Open beaches |
293.248 |
174.622 |
0.000 |
100.005 |
557.158 |
|
medical city |
44.512 |
175.153 |
0.000 |
176.567 |
128.308 |
|
Olympic village |
6.737 |
311.985 |
0.000 |
7.495 |
28.109 |
|
tourist Hub |
28.133 |
104.779 |
0.000 |
93.858 |
|
|
Business and finance center |
4.066 |
95.754 |
104.361 |
150.358 |
151.997 |
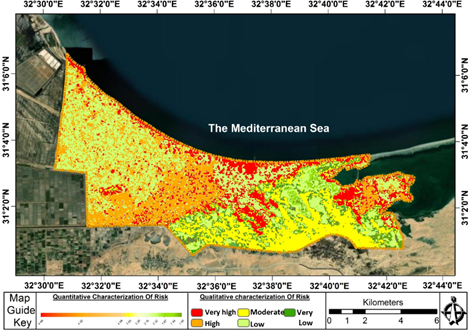
5.6 Soil risk assessment
With the aid of the GIS, a risk assessment map of problematic soil was created from the final geo-hazard map of problematic soil and the land use vulnerability map (Figure 25). It can be seen that the high-risk areas concentrate in the north, the center, and the northeast near Lake Bardawil. The risk degree is relatively low in the northwest of the study area. Next, the proposed urban land use plan for the new city was superimposed on the risk assessment map. It was found that the land uses in the plan should be rearranged to ensure sustainability.
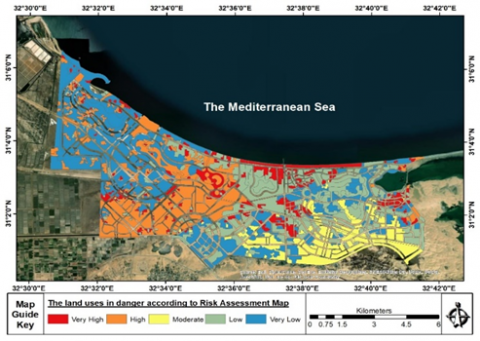
It is preferable to arrange open land uses like lakes, green areas, and golf lands in high-risk areas, and the areas of high economic value, namely, the medical city and investment areas, in low-risk areas (Figure 26).
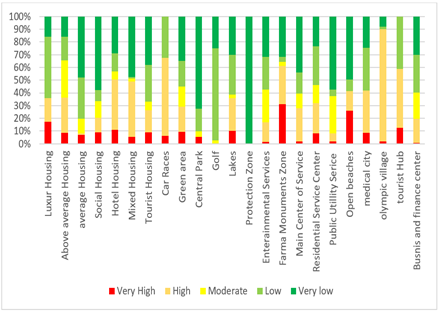
Figure 27 shows the areas exposed to risk for each land use, and Figure 28 presents the percentages of these areas, which are classified by risk severity from very low to very high. The percentage of residential uses at very high risk are above 20% of the total area exposed at risk, and the medical city exposed to risk is above 40% in the classes of high and very high risks. It can also be inferred that the 60% of Farma Monuments zone and race circuit are located in high and very high risk areas, while 80% of protection zone and golf area are located in low and very low risk areas.
Figure 29 shows percentages of total area exposed of risk in new city, and Table 8 shows areas exposed to risk for each land use of study area.
Figure 25. Problematic soil risk assessment map for study area
Figure 26. The land uses exposed to risk according to risk assessment map for study area
Figure 27. Areas exposed to risk for each land use of study area
Figure 28. Percentages of the areas exposed to risk for each land use of study area
Figure 29. Percentages of total area exposed of risk in new east port said city
This study showed that soil risk assessment is an important approach for achieving sustainable spatial suitability of urban land use in new cities, through a review of international studies and reports in this field. In addition to determining the extent to which this approach is taken into account when preparing land use plans for new Egyptian cities by selecting one case study (New East Port Said City) and using geographic information systems and Remote Sensing in the analysis process. New East Port Said City was selected in this paper because it has three types of problematic soil such as soft clay soil, sabkha soils, and sand dunes soil as well as the diversity in its proposed urban land uses.
An environmental survey for the city was done using geographic information systems, and the standard factors and indicators were determined for each soil type separately based on reviewing and analyzing of previous studies and setting relative weights using the Analytical Hierarchy Process (AHP).
Geographic information systems are the main tool to produce many maps for East Port Said City such as Problematic Soil Geo-Hazard map for each type of soil, final combined map for Problematic Soil Geo-Hazard, land use vulnerability map and Problematic Soil Risk Assessment map for East Port Said City. The main results of the study shows that there is a discrepancy between the distribution of proposed land uses in city' plan and the areas exposed to high risk high degrees. It is evidenced by the presence of some land uses in the sites of high-risk areas such as the medical city and investment areas, while the land uses of open areas, lakes, and golf lands are found in the sites of low-risk areas. Therefore, the study recommends the redistributing the proposed urban land uses of New East Port Said City according the final map of problematic soil risk assessment and indicates the importance of using the problematic soil risk assessment approach in planning decisions to ensure the sustainability and resilience of current and future land uses in new cities.
|
$G f_{a 1}$ |
Geotechnical Factors |
|
$G f_{a 2}$ |
Geomorphological factors |
|
$G f_{a 3}$ |
Geological factors |
|
hfa4 |
Hydrometeorology Factors |
|
hfa5 |
Hydrology-Hydraulic Factors |
|
tfa6 |
Topography Factors |
|
Afa6 |
Another Factors |
|
a |
Soft Clay Soil |
|
Gfb1 |
Geotechnical Factors |
|
Gfb2 |
Geomorphological factors |
|
Gfb3 |
Geological factors |
|
Cfb4 |
Climate Factors |
|
bfb4 |
Biological Factors |
|
hfb5 |
Hydrological and Hydraulical Factors |
|
b |
Sabkha Soil |
|
Gfc1 |
Geotechnical Factors |
|
Gfc2 |
Geomorphological factors |
|
Gfc3 |
Geological factors |
|
Cfc4 |
Climate Factors |
|
c |
Sand dunes soil |
[1] Blaikie, P., Cannon, T., Davis, I., Wisner, B. (1994). At Risk: Natural Hazards, People's Vulnerability and Disasters. London etc., Routledge.
[2] Aven, T. (2015). Risk assessment and risk management: Review of recent advance on their foundation, University of Stavanger, Ullandhang. European Journal of Operational Research, pp. 1-13. https://doi.org/10.1016/j.ejor.2015.12.023
[3] Standard, B., Standard, N.Z. (2009). Risk management-Principles and guidelines. BS ISO, 31000, 2009. http://www.iso.org/iso/home/standards/iso31000.htm.
[4] UN-ISDR. (2017). Terminology on Disaster risk Reduction. https://www.unisdr.org/we/inform/terminology.
[5] Abidin, H.Z., Andreas, H., Gumilar, I., Brinkman, J.J. (2015). Study on the risk and impacts of land subsidence in Jakarta. Proceedings of the International Association of Hydrological Sciences, 372: 115-120. https://doi.org/10.5194/piahs-372-115-2015
[6] Huber, S., Vernik, T., Vrscaj, B., Siebielec, G. (2012). Soil in the city, urban soil management strategy. The European Regional Development Funds (ERDF), pp. 1-25. https://www.researchgate.net/publication/280919874_Soil_in_the_City_Urban_Soil_Management_Strategy.
[7] Asian Development Bank. (2016). Reducing Disaster Risk by Managing Urban Land Use. Guidance Notes for Planners. https://www.adb.org/publications/reducing-disaster-risk-urban-land-use-guidance-notes.
[8] Tarhan, C., Deniz, D. (2013). Sustainable urban planning and risk assessment of earthquake hazards in Turkey. International Archives of the Photogrammetry, Remote Sensing and Spatial Information Sciences, pp. 113-117. https://doi.org/10.5194/isprsarchives-XL-4-W1-113-2013
[9] Abd-Elkawy, A.A.M. (2020). Types and Tools of Land Use Zoning Towards Dealing with Private Properties in Re-planning Inner Informal Areas (Case Study: Maspero Triangle–Cairo Governorate). American Scientific Research Journal for Engineering, Technology, and Sciences (ASRJETS), 74(2): 1-37.
[10] The Geotechnical Encyclopedia of Egypt. (1997). Part One, Geotechnical, Topographical, Geomorphological, Geological and Hydrological Characteristics of Egypt, Volume 1, Faculty of Engineering - Cairo University (Soil Mechanics and Foundations Research Laboratory), Ministry of Education (General Authority for Educational Buildings).
[11] International Bank for Reconstruction and Development, International Development Association or The World Bank. (2020). Road Geohazard Risk Managment, Sierra Lenon Case Study, The World Bank, pp. 1-77. www.worldbank.org.
[12] Moeez, A., Abdullah, A., Rana, A., Akram, A., Khalili, H. (2016). Problematic Soil and Ground Improvement Techniques, Fast Nuces Department of Civil Engineering Organiztion, pp. 1-38.
[13] Egyptian Code for Soil Mechanics, Design and Implementation of Foundations, Code 202-2001, Part V, Foundations on Problematic soils, 2007 edition, Ministry of Housing, Utilities and Urban Communities, National Center for Housing and Building Research.
[14] Ahmed, Q.A., Zayed, M.A. (2015). The emergence and formation of coastal marshes in northwestern Libya. Academic Research Journal, pp. 234-257.
[15] Qarqar, M.M. (1995). Update of the sixth of October city plan in light of soil studies. Scientific Journal of Civil Engineering - Al-Azhar University.
[16] Omar, D., Aly, M.S.I. (2018). Urban growth management policies. The rise of new town policy to deal with urban growth: the case of Egypt. Master of Science in Urban Planning and Policy Design, School of Architecture Urban Planning Construction Engineering, Politecnico Dimilano University, pp. 1-103. https://doi.org/10.13140/RG.2.2.15699.02086
[17] The Geotechnical Report. 15th of May City. (1978). Strategic plans of the new Egyptian cities, Egypt. 15th of May City Authority. http://www.mhuc.gov.eg/Home/Index.
[18] The Geotechnical Reports, Strategic plans of the new Egyptian cities, Ministry of Housing, Utilities and Urban Communities, Urban Projects. http://www.mhuc.gov.eg/Home/Index.
[19] Abou Samra, R.M., El-Barbary, S.M. (2018). The use of remote sensing indices for detecting environmental changes: A case study of North Sinai, Egypt. Spatial Information Research, 26(6): 679-689. https://doi.org/10.1007/s41324-018-0211-1
[20] Ministry of Housing, Utilities and Urban Communities, Urban Projects, New East Port Said City. http://admin.mhuc.gov.eg//Dynamic_Page/637361985728699299.pdf.
[21] Stanley, J.D. (2003). Nile delta margin: Failed and Fluidize deposits concentrated along distributary channels. Geomorpholgie: Relief. Processus, Environnement, 2003(4): 211-226. https://doi.org/10.3406/morfo.2003.1186
[22] Abu Al-Izz, M.S. (1971). Land forms of Egypt. The American University, Cairo/Press Cairo, UAR, 280: 281.
[23] Abdalla, H.M. (2006). An overview on the REE-mineralized alkaline granites in Egypt, with special reference to the abu khruq and gara el hamra bodies. Resource Geology, 56(3): 365-370. https://doi.org/10.1111/j.1751-3928.2006.tb00289.x
[24] Hamza, M.M., Shahien, M.M., Ibrahim, M.H. (2005). Characterization and undrained shear strength of Nile delta soft deposits using peizocone. In Proceedings of the 16th International Conference on Soil Mechanics and Geotechnical Engineering, pp. 687-691. https://doi.org/10.3233/978-1-61499-656-9-687
[25] Tawab, A., Ahmed, H. (2008). Engineering geological map of Northern Sinai Peninsula. Engineering Research Journal, pp. 68-75.
[26] El Shawaf, M. (2020). Behavior of soft soils improved utilizing vertical drains and preloading. Doctor of Philosophy thesis, Structural Engineering Department, Ain Shams University, 213-149.
[27] NASA Earth Observatory. (2000). Measuring Vegetation. https://earthobservatory.nasa.gov/features/MeasuringVegetation/measuring_vegetation_2.php.
[28] Port Said Governorate Environmental Characterization. (2007). Environmental Affairs Agency, Ministry of Environment, Arab Republic of Egypt, pp. 1-197.
[29] Khan, N.M., Rastoskuev, V.V., Sato, Y., Shiozawa, S. (2005). Assessment of hydrosaline land degradation by using a simple approach of remote sensing indicators. Agricultural Water Management, 77(1-3): 96-109. https://doi.org/10.1016/j.agwat.2004.09.038
[30] Kachouri, S., Achour, H., Abida, H., Bouaziz, S. (2015). Soil erosion hazard mapping using Analytic Hierarchy Process and logistic regression: A case study of Haffouz watershed, central Tunisia. Arabian Journal of Geosciences, 8(6): 4257-4268. https://doi.org/10.1007/s12517-014-1464-1
[31] Lyu, H.M., Shen, J.S., Arulrajah, A. (2018). Assessment of geohazards and preventative countermeasures using AHP incorporated with GIS in Lanzhou, China. Sustainability, 10(2): 304. https://doi.org/10.3390/su10020304
[32] Saaty, R.W. (1987). The analytic hierarchy process—what it is and how it is used. Mathematical Modelling, 9(3-5): 161-176. https://doi.org/10.1016/0270-0255(87)90473-8
[33] Hamed, O.M., Mansour, M., Abdel-Rahman, A.H., El-Nahhas, F.M. (2017). Geotechnical characterization of Port-Said clay. In Proc. of 19th International Conference on Soil Mechanics and Geotechnical Engineering, Seoul, South Korea, pp. 17-22.
[34] Al-Qasabi, E.A. (1999). Soil Mechanics, Dar Al-Kitab Al-Alami for Publication and Distribution. Second Edition, 1-726: 626.
[35] Pritchard, O.G., Hallett, S.H., Farewell, T.S. (2015). Probabilistic soil moisture projections to assess Great Britain’s future clay-related subsidence hazard. Climatic Change, 133(4): 635-650. https://doi.org/10.1007/s10584-015-1486-z
[36] Zhang, J., He, P., Xiao, J., Xu, F. (2018). Risk assessment model of expansive soil slope stability based on Fuzzy-AHP method and its engineering application. Geomatics, Natural Hazards and Risk, 9(1): 389-402. https://doi.org/10.1080/19475705.2018.1445664
[37] Zumrawi, M.M. (2015). Geotechnical aspects for roads on expansive soils. International Journal of Science and Research (IJSR), 438(42): 1479-1476.
[38] Abdullah, A., Abdel-Hamid, I. (2012). The geomorphological dangers of sabkha and its impact on people and their economic activities. Conference on Environmental Problems: Implications and Solutions, Faculty of Arts, Helwan University, 7: 40-25.
[39] Kheder, I.S.E. (2013). Environmental geomorphology of the eastern coastal plain of sinai between the mouth of the valley of dahab and ras muhammad “Using Geographic Information Systems”. Ph.D., Cairo University, Faculty of Arts, Department of Geography.
[40] Al-Muhaidib, A.B.I. (2002). Sabkha soils in the kingdom of saudi arabia: its properties and methods of treatment. Journal of King Abdulaziz University for Engineering Sciences, 14(2): 29-80. https://doi.org/10.4197/Eng.14-2.9
[41] Nabil, H. (2012). The role of geo-environmental factors in formulating regional development policies: A case study of the Toshka Project, Master Thesis, College of Regional and Urban Planning, Cairo University, 1-188: 95.
[42] Chien, L.K., Wu, J.P., Tseng, W.C. (2019). The study of risk assessment of soil liquefaction on land development and utilization by GIS in Taiwan. Geographic Information Systems and Science, pp. 1-19. https://doi.org/10.5772/intechopen.82417
[43] Pradhan, B., Moneir, A.A.A., Jena, R. (2018). Sand dune risk assessment in Sabha region, Libya using Landsat 8, MODIS, and Google Earth Engine images. Geomatics, Natural Hazards and Risk, 9(1): 1280-1305. https://doi.org/10.1080/19475705.2018.1518880
[44] Hasan, M.H., Rahman, M.R., Haque, A., Hossain, T. (2019). Soil salinity hazard assessment in Bangladesh coastal zone. Proceedings. International Conference on Disaster Risk Management, Dhaka, Bangladesh, pp. 517-520.
[45] Liu, J., Wang, H., Yan, X. (2015). Risk evaluation of land subsidence and its application to metro safety operation in Shanghai. Proceedings of the International Association of Hydrological Sciences, 372: 543-553. https://doi.org/10.5194/piahs-372-543-2015
[46] Adger, W.N. (2006). Vulnerability. Global Environmental Change, 16(3): 268-281. https://doi.org/10.1016/j.gloenvcha.2006.02.006