Milan Perný* | Vladimír Šály | Milan Andráš | Lukáš Valášek | Juraj Packa
© 2021 IIETA. This article is published by IIETA and is licensed under the CC BY 4.0 license (http://creativecommons.org/licenses/by/4.0/).
OPEN ACCESS
Reducing the electricity consumption is a current trend which has an economic, social and environmental impact. Measures which are outlined to increase efficiency are also supported by legislation and could be funded from the national or European funds in EU countries. In Slovakia, there are many establishments, public buildings and households built in past decades where energy is being wasted. Approximately the share one third of the consumed energy in Slovakia belongs to industry. This statistic naturally legitimizes the effort to achieve energy savings in this segment. We choose a body which is in use partially as commercial offices and partially as production facility. The matter was to identify areas with excessive energy consumption and propose appropriate measures to avoid unnecessary losses. The paper presents more aspects of building operation regarding of energy consumption, especially in relation with old buildings with more structural and operational defects and propose some ways of the improvements the energy efficiency. The work also includes experimental data and simplified economy considerations related to the proposed measures. Finally the step model is presented in order to simplify the decision making process. The model is relevant and also applicable generally for the other engineering disciplines.
electricity consumption, analysis, efficiency, losses, energy, economic return, thermography, lighting design
Like all things around, buildings have limited time duration. The time for which a building has to fulfil its basic function depends on many factors such as location, groundwater, climatic conditions, method, quality and technology procedures during construction or maintenance and reconstructions. Physical life-time and properties of the individual building elements of which the building consists is also important. Long-term use, as well as the negative effect of the above mentioned factors, lead to building defects and structural failures. Very common defect, present either from the very beginning of existence of building or as a result of ageing processes, is low or decreased thermal resistance of building envelope. In the case where its thermal properties do not meet the required thermal-physical parameters, e.g. due to the low thermal resistance of used materials, inconvenient structural composition or insufficient thickness, the walls gradually become wet until the critical point. Finally, molds begin to appear in the interior. The corrosion of load-bearing iron elements under the influence of humidity can cause even static failure. Thermal losses and ineffective energy use are among the main limitations and discomfort of such suffering building. The solution of mentioned defects and extension of the life of building require professional approach.
Energy and energy efficiency is an important factor of development and currently one of the most discussed topics. In relation to this fact energy efficiency is among strategic approaches which European Union (EU) proposes to create its policy and long-term vision of sustainability [1, 2]. More efficient process from production to consumption of energy is one of effective ways to reduce the emissions, increases the energy self-sufficiency and crucially enhances the competiveness.
Increased energy efficiency involves the whole process starting at more effective production and includes conversion, distribution and consumption of the energy and followed by acceptable savings. This process must take into account technical, economic and operational aspects as well as changes in the behavior of end-users and consumers [3]. Environmental factors related to the chain from production to consumption of energy also strongly influence the current everyday life and the future of mankind.
Categorization of the spheres of electricity consumption according to their importance is one of the measures for more efficient energy management. Equally important is the identification of the places where the energy is less effectively consumed. They are localities where the supply water is wasted, areas with high heat losses, or systems where power is uneconomically regulated, etc. There is a direct proportion between reduction of losses and reducing of operation costs. Reduction of operation costs can be also achieved by economic use and management of energy consumption [4].
Heating and air conditioning represents great portion of energy requirements. It takes more than 80% of household consumption. It is similar in office buildings. Construction errors and using of former building materials often has resulted in large energy/heat losses. So the routine step should be to identify the construction faults responsible for the heat losses. Thermal bridge could be not only the space where the thermal energy ineffectively escapes but often it results in lowering the user comfort and even threats in health damage. The heat losses are quite proportional divide into losses through roof, walls, windows and floors.
Heat transport is either by conduction, convection or radiation. The building construction faults usually results in conduction leakage of heat. Air un-tightness is also responsible for the heat loss while the air escaped by convections carries the thermal energy, as well [5]. Radiation losses are related to conduction and convection which are heating the surface envelope of the building. Thermal radiation depends on the temperature of external structures and follows Stefan-Boltzmann law. The radiated power is proportioned as T4 of the surface temperature. In order to characterize the building leakages initial database should include the information on materials, insulation type and ventilation type. Insulations are often missing on older buildings. Thermal images taken by IR camera are a common to recognize the heat losses on the building envelope [6, 7].
The Slovak Republic, together with other economically developed countries, follows the principle of sustainable development. The main task of energy policy in terms of this principle is to ensure a harmonious relationship between energetics and the environment. This goal can be achieved by increasing the efficiency of energy consumption and the conversion of individual energy sources using appropriate technologies such as improvement of conventional technologies with more efficient processes and devices. Wider use of renewable energy sources is also part of this concept [8]. The process of more efficient energy management consists of the implementation of systematic measures which results from the energy audit. Modernization of heating and air-conditioning systems, improvement of the insulation properties of buildings, implementation of renewable energy sources, etc., are effective and efficient measures to achieve significant savings [9].
Economic issues can be seen many times as barrier for complex solutions which will finally lead to energy efficiency. Because proposed solution has to be holistic taking into account all actual and future aspects [10]. There are many barriers resulting from social, economic, technical, legislative reasons which need sometimes great effort to be overcome and finally reach increased energy efficiency [11].
Selected basic measures for more efficient use of energy in chosen company will be analyzed in this paper. Aim is the efficient use of energy and reduction in the consumption of electricity.
Either newly built or old buildings are great consumers of energy and producers of greenhouse gasses. The document of European Commission Renovation Wave stated [12] that energy sector is responsible for great portion of consumed energy and building sector in EU countries produces approximately one third of EU´s emissions. The general objective is to reach zero energy or near-zero energy approach as urgently presented in EU politics and as formalized in EU directives [1, 2]. Improvement, increasing the energy efficiency of public and private buildings is extremely important regarding this context. Of course, it is easier to involve requirements of zero energy concept on newly built buildings while reaching of this aim on old ones is often complicated due to former design and constructional processes.
Heat insulating cladding of older energy wasting objects is practically very first but not the only step to increase energy efficiency and many other measures are available. That means that reconstruction should be very thoroughly reconsidered, planned and projected.
Circumstances taken into account and applicable in reconstruction process are for example following:
Increase of thermal insulation not only outer walls but roof and ground, as well.
Except of walls, roof and ground base, the energy insulating windows and doors are also important to be taken into account.
Thorough sealing of envelope of building – all outer structures. As already mentioned, great portion of thermal escape is due to poor tightness.
Sealed building on the other hand requires effective and energy efficient air supply and ventilation to keep the climate in the inner space in proper condition and healthy supplied by fresh air.
Effective heat and cooling systems. The exploitation of solar energy, either PV or solar-thermal, and heat pumps helps to reach this approach.
Effective water heating supported e.g. by solar energy exploitation and especially amenable to reason consumption of the water.
Energy efficient lighting – a broad offer of energy sparing LED lighting devices are available.
Using more energy efficient equipment and appliances.
Individual items are recognized as the reason of low energy efficiency and also the measures for its improvement. Of course all of these points should be considered in relation to economic aspects.
Within our investigation the following items were identified to increase energy efficiency as the principled measures
1. Reduction of unnecessary energy consumption or reduction of the operation of appliances for the necessary time.
2. Increase of the efficiency. This can be achieved in two ways:
a) Replacing older equipment with a modern and economical equipment, or upgrading the old equipment. The operator saves not only on energy but also on operating costs (less/possibly no repairs and maintenance). The advantage is that new devices can provide a number of new functionalities [13].
b) Improving the insulating properties of the building.
A great amount of electricity is consumed by heating and using the air condition to cool the rooms in summer. The insufficient insulation of walls, floors, ceiling, windows, prevails to large extent on energy leaks into the ambient [14].
3. Exploitation of renewable energy sources [15].
4. Energy management. Automation and intelligent metering and control can save a significant amount of energy [16].
The referenced building, which has been the matter of our investigation, built in second half of last century, is a four floors house. It is rented to different companies as offices and project engineering area with specific, e.g. robotics, equipment. The building is accessible from adjacent parking lots. The building has never been renovated and has no additional thermal insulation. Access to the floors is by staircase without lift. Picture of the building taken from the street can be seen in Figure 1.
The analysed company occupies the entire third floor. Electric feeding is three phase net. The switchgear consists of seven single-pole circuit breakers with a nominal current of 16 A (class C) and one three-pole circuit breaker with a nominal current of 32 A.
Figure 1. Selected company building
4.1 Calculation of annual energy consumption
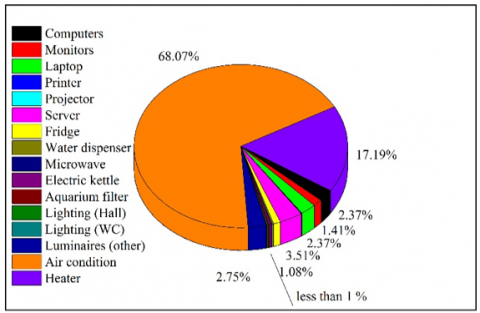
In mild climate region of Slovakia electricity consumption varies significantly depending on the seasons. Heating in winter and air conditioning in summer represent the great portion of consumed energy. The table (Table 1) provides an overview of the consumption of individual appliances in the selected cold period of four winter months (November – February). Graphical overview of winter consumption in percentage share, respecting Table 1., is shown in Figure 2.
The calculation of electricity consumption for a given period consists of the product of several variables.
CP = (Mp1 [W] x Oh [h] x Od) [Wh] (1)
CP = 103 [W] x 8 [h] x d = 696 [kWh] (2)
where, maximal power Mpt represents the total power of the appliances multiplied by the number of appliances, Oh is the number of hours during which the appliances spend electricity and Od is information about the number of days of operation of the appliances. During this period the parameter d represents the total number of days for the given period. In the calculation above, (Eq. (2)), d = 79.
Table 1. Calculation of electricity consumption in winter
|
Appliances |
Amount |
Mp1 [W] |
Mpc [W] |
Oh [h] |
Od [days] |
CP [kWh] |
|
Computer |
4 |
250 |
1000 |
8 |
79 |
696 |
|
Monitor |
23 |
26 |
598 |
8 |
79 |
416.208 |
|
Laptop |
5 |
200 |
1000 |
8 |
79 |
696 |
|
Printer |
1 |
310 |
310 |
0.5 |
79 |
13.485 |
|
Projector |
1 |
300 |
300 |
1 |
79 |
26.1 |
|
Server |
1 |
350 |
350 |
24 |
120 |
1033.2 |
|
Fridge* |
1 |
430 |
430 |
6* |
120 |
317.34 |
|
Water dispenser* |
1 |
95 |
95 |
6* |
120 |
70.11 |
|
Microwave |
1 |
800 |
800 |
0.5 |
79 |
34.8 |
|
Quickly kettle |
1 |
2150 |
2150 |
0.5 |
79 |
93.525 |
|
Aquarium filter |
1 |
20 |
20 |
24 |
120 |
59.04 |
|
Lighting (Hall) |
2 |
40 |
80 |
8 |
79 |
55.68 |
|
Lighting (toilette) |
5 |
40 |
200 |
1 |
79 |
17.4 |
|
Luminaires (other) |
64 |
40 |
2560 |
4 |
79 |
808.96 |
|
Air condition |
3 |
3520 |
10560 |
24 |
79 |
20021.8 |
|
Heater |
4 |
2000 |
8000 |
8 |
79 |
5056 |
Notes: 1. Mp1 is maximum power, Mpt total maximum power, Oh operation in hours, Od operation in days and CP Consumption per period.
Figure 2. Electricity consumption of individual appliances in winter season
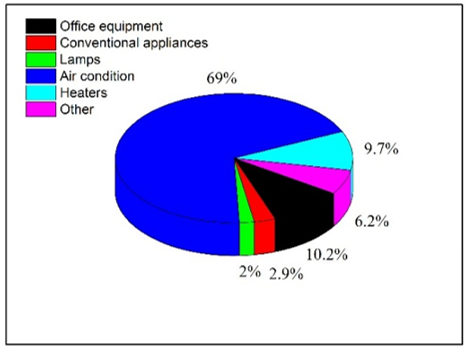
Figure 3. Electricity consumption in 2019
The same analyzes were performed for the summer and the transitional period of spring and autumn. The calculated value of the total electricity consumption in the analyzed company for the year 2019 represents 52622.08 kWh. The appliances, as can also be seen in Figure 3, have been divided into categories. Office equipment (computers, monitors, laptops, printers, projectors) contribute to total consumption amount of 10.2%. Conventional appliances such as a refrigerator, microwave, kettle and water dispenser represent 2.9% of the total consumption. Luminaires represent 2% of total consumption.
Air conditioning shares up to 69% and heaters 9.7% of the total electricity consumption. The server and the aquarium filter were included in the category of other appliances. A common feature of these two appliances is that they operate continuously all the time and their consumption cannot be influenced. The two appliances account for the remaining 6.2%. For the completeness of consumption, it was necessary to add data on the consumption of appliances in stand-by mode. The working equipment (machines) is not included because its consumption is inevitable and depends on actual exploitation.
4.2 Theoretical analysis of weekly energy consumption
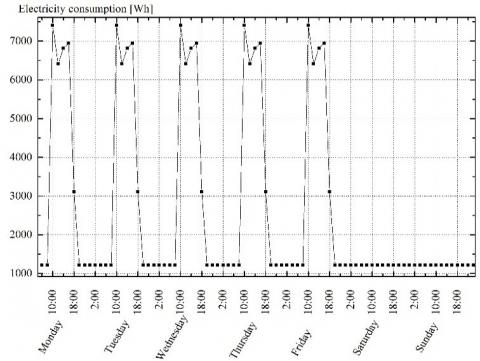
The diagram in Figure 4 shows that the largest consumption in the company is, as expected, during working hours from Monday to Friday from 8:00 to 16:00. The server, the aquarium filter and the appliances in stand-by mode consume approximately 0.6 kWh of electricity for the whole time. Consumption culminates in the morning by 8:00 to 10:00 a.m. and reaches the peak value about 3.7 kWh.
Figure 4. Typical weekly diagram of the consumption in the company
4.3 Analysis of the heat losses
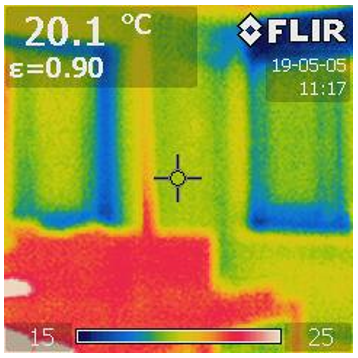
Central heating, electric heaters and air condition units are used together. Remote Central Heating System is not sufficient and must be supported to improve thermal comfort. The company annually consumes additional 25 MWh in the winter and 16.4 MWh of electricity in the summer months for additional heating and for air conditioning. In the first step these numbers could be significantly reduced by additional thermal insulation of the building walls and roof. The use of thermal infrared (IR) imaging is a common tool for inspecting and performing non-destructive testing of heat loss in the building [17]. Heat leakage analysis was performed with a FLIR i50 Infrared camera in May at an outdoor temperature Tout = 2℃ and an indoor temperature Tin = 22℃. The temperature value is that at the area with the pointer (centrally placed in Figure 5b) The emissivity ε = 0.9 represents the emissivity of the plaster.
The following Figures 5, 6 show examples of thermographic analyzes of the interiors and exterior of the building.
(a)
(b)
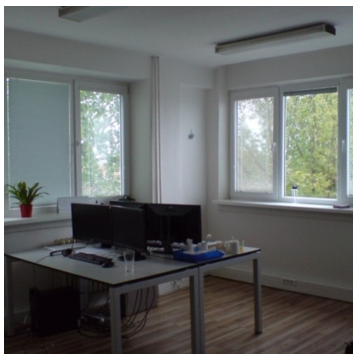
Figure 5. (a) Picture of an office, north side of a building; (b) Thermal image of the room in Figure 5a
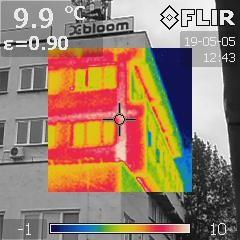
Figure 6. Thermal image of the south east corner of the building
Comparing Figures 5 and 6 it is clear that heat leakages are visible from the outside of building approximately at the same areas as from the inside. Insulation of the building would significantly improve the insulating properties of the walls. Their ability to retain heat in the winter and, conversely, to protect against overheating in the summer months would increase. Electricity consumption by air conditioning would be reduced in this way. More different insulating materials have been used for decades for building wall insulation. As a basic standard either polystyrene or mineral wool is applied with the thermal conductivity about 0.03 to 0.04 Wm-1K-1, but many other alternative insulations are commercialized. Typically, thickness of more than 10 cm is attached. The cost of insulation depends on the thickness and applied material and construction system.
The way of the profit calculation is presented e.g. in [18]. In order to improve energy efficiency of buildings and following the requirements of European Commission Directive Energy performance of buildings, Law 555/2005 on energy efficiency of buildings was adopted in Slovakia. It establishes procedures and measures to improve the energy efficiency of buildings and the competence of public administration bodies. This law is applied to new and newly reconstructed buildings. Of course except of wall insulation properties many more other aspects are taken into account in order to calculate energy efficiency and to follow energy certificate requirements.
4.4 Analysis of old and design of new lighting
Electricity consumption decrease is also possible to obtain by replacing old light sources with modern and economical low power LED luminaires. The requirements on illumination of workplaces are stated in Directive 89/654/EEC - workplace requirements where the light, preferentially natural, adequate for the protection of health at work is required. The aspects of illumination of workplaces which should be followed are defined in details in European Lighting Standard EN12464-1. An analysis of the current lighting and a new design of lighting in the company's premises was prepared and based on the standard STN EN 12464-1: 2012 [19] Light and lighting - Lighting of work places - Part 1: Indoor work places (February 2012) which follows original EN standard.
The original lighting consists of 13 lamps with conventional 40 W bulbs and 58 linear halogen bulbs, each 40 W. The total installed power of the former lighting is 2840 W. The new design includes 11 LED lamps (25 W) and 28 Downlight LED panels (30 W). The total installed power of the new luminaires is 1115 W, which represents approximately 39% of the original lighting system.
Table 2. An overview of the minimum required light intensities for selected areas in accordance with the applicable standard
|
Zone |
Em [lx] |
Note |
|
Communication spaces and corridors |
100 |
At floor level. |
|
Buffets, kitchenettes |
200 |
- |
|
Data processing, CAD workstations |
500 |
At the table level. |
|
Conference and meeting rooms |
500 |
At the table level. |
|
Dining room |
- |
Lighting should be designed to create an appropriate atmosphere. |
|
Bathrooms, toilets |
200 |
In each separate toilet, which is spatially closed. |
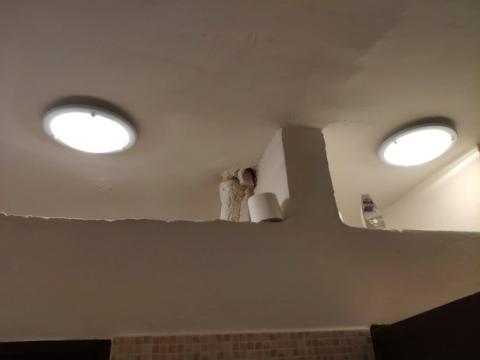
The new lighting design, which was modeled using DIALux [20], should respect as much as possible original electrical installation. The exception in our proposal was the sanitary area shown in Figure 7 where the installation arrangement was absolutely inconvenient. It was not possible to achieve the required minimum illumination of 200 lux by replacing old lamps with new ones. In these spaces, the lighting is solved in a very non-standard way.
The requirements according to the currently valid standard for the minimum illuminance Em are shown in Table 2.
The current luminaires are oriented toward the walls and the illumination in no case reaches mentioned minimum value of illumination required by technical standard. For this reason, it was necessary to make several changes in the layout of the lights in these rooms.
Figure 7. Former inefficient illumination design in sanitary area
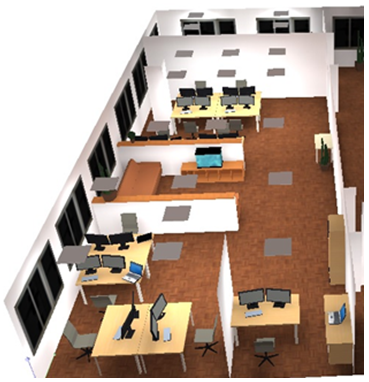
Figure 8. Gray squares are light sources in newly designed working area
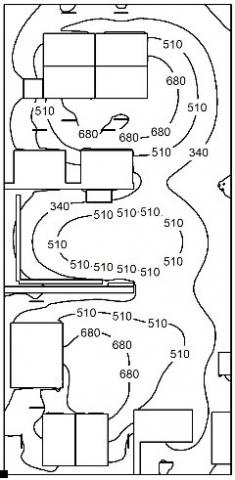
Figure 9. Ligh distribution in a connected office, isolines are at desk level
An example of interior modeling (in this case an office) in the DIALux program for a selected number of luminaires is shown in Figure 8.
An iso-line depicted in Figure 9 is generally a line or curve alongside which the illumination is constant. In this case it represents the illuminance in lux. The designed lighting meets the requirements of the above-mentioned standard on minimum interior lighting and optimal lighting distribution [21].
Retrofitting of former lighting sources on one side improves the energy balance but on the other hand also improved working comfort what is also important but harder measurable aspect. Exploitation of natural daylight and its cooperation with artificial sources is also important approach which leads to improved energy efficiency and working comfort [22].
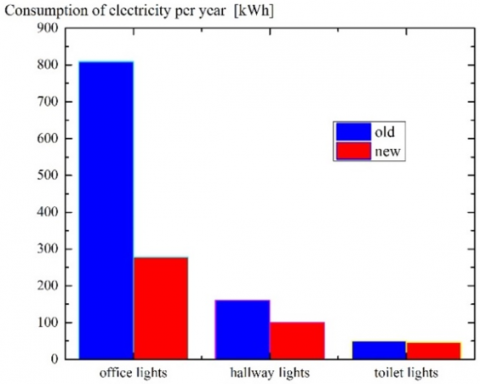
The following graph Figure 10 is used to compare the annual electricity consumption of old and new luminaires.
Figure 10. Comparison of annual electric energy consumption of lightings with former standard light sources and after replacement by LED (red column)
The electric energy tariffs in Slovakia have too parts which depend on the yearly average consumption. The prize has fixed and variable portion. The building which is subject of investigation is included into the tariff class DD3 - two-band rate. This tariff group is suitable for electricity customers who want to take advantage of the low tariff in the night – (LT) time zone, which is usually provided 12 hours a day from 20:00 to 8:00 continuously. Blocking of electrical appliances is not required. Condition for allocating the rate is tariff measurement.
5.1 Solution of standby power consumption
The consumption of stand-by mode operation is often ignored not only at home appliances but also in companies. The total annual electricity consumption of the examined appliances in stand-by mode is 701.3 kWh. 453.1 kWh is consumed in LT and 248.2 kWh in high tariff (HT). Based on these values and the current electricity prices, the cost of the “standby appliances” is estimated at 25.2 EUR per year. All amounts include VAT.
These costs can be simply reduced to zero per year by purchasing and applying sockets with a switch, usually with surge protection which increase the safety of operation. 34 sockets are needed together to cover all appliances taken into account. 70.3 EUR need to be invested to save 25.17 EUR per year by implementing this measure. Payback period is shorter than 3 years.
5.2 Solving the problem of heat leakage
Thermal images showed that there are places on the examined floor, usually concrete structure, where heat escapes. The spaces below and above the floor are heated, so heat leaks in the building are caused by poor insulation properties of the outer walls. It is possible to increase the efficiency of insulation by thermal insulation. There are many types of energy-saving solutions for building walls. The most common is exterior sandwiched insulation. As mentioned, the common insulation materials for exterior insulation are eg polystyrene, polyurethane or mineral wool [23]. Insufficient tightness and thermal properties of windows must be also taken into account and treated.
Additional heating with air condition and heaters consumes 25077.76 kWh per year. 10010.88 kWh is taken by these appliances in LT and 15066.88 kWh in HT. The cost of additional heating is therefore 1021.57 EUR per year.
By cooling the air in the summer months, the air conditioning consumes 16408.8 kWh per year, with the same amount of 8204.4 kWh in LT and HT. This represents an annual cost of 635.85 EUR.
The outer walls of the floor represent an area of approximately 192 m2. According to the indicative price list [9], it was calculated that the total price per 1 m2 of insulation, including all additional works, is 20.8 EUR. The insulation of the floor will therefore cost approximately 4000 EUR.
Assuming that it would not be necessary to use additional radiators after insulation and it would be sufficient to use the air conditioning in summer only occasionally and was estimated to 4 hours per day during working hours. There would be savings of a total 1524.5 EUR per year. Payback time of investment is less than 2 years and 8 months. However, the calculation is missrepresented by the very uneconomical use of air conditioning units (24 hours a day in winter and summer). Usually energy savings are estimated from 10 to more than 40%. Of course the result depends on the used insulating system and thickness of attached layer of insulating material (see e.g. [24]).
5.3 Light sources replacement
The original lighting with linear fluorescent and conventional lamps affects the annual electricity consumption at a rate of 1020.64 kWh and the annual cost is 49.61 EUR. The calculated consumption of new luminaires is 425.5 kWh, which is 20.68 EUR per year. The savings after replacing the lights is 28.93 EUR per year. Lighting is used only during working hours, so the price is calculated from HT. The return in this case would be more than 34 years.
The company has a great advantage in the form of sufficient daylight. Therefore, most luminaires are only used for 4 hours during the winter months. In the case of continuous lighting of the entire floor during working hours throughout the year, the return would be less than 6 years.
Some aspects of our work could be emphasized in order to generalize the process which could lead to increased energy efficiency of any building. The successful process takes into account the mutual interactions between building physics, standardized usage and technical equipment of the company [10] and results in specific algorithm.
Description of individual steps in the process of obtaining the model:
1. Basis for the creation of the refurbishing concept is the thorough recognition and detection of the actual state. The company is investigated in terms of the existing technology, building physics, organization and the energy performance. Ascertaining must be thoroughly documented.
2. The variables connected to the problem clarification, are sorted, defined and processed to enable measurability. Suitable measuring instruments and devices tools such as data logger, thermal cameras, tightness measurement equipment, electricity meter (wattmeter) have to be used.
3. Measures are selected, and afterwards the measures are conducted and documented. The data would be sorted, analyzed and compacted in their meaningfulness.
4. The methods of choice arise from the target position as well as the specific possibilities also taking into account all company-specific economic factors. Such measures can be understood, e.g. interventions in the building, organizational measures, energy and economic calculations.
5. The process finalizes in presentation and controlling of the results taking into account all the energetic and economic factors.
Real operational model is based on the correlation of theoretical model (ideas) and practical data.
Finally the process is the matter of decision when savings, distinguished e.g. as low, medium and high, are related to investment cost, also e.g. low, medium and high.
Medium-sized and small industrial enterprises account for about 37% of total final energy consumption and are regarded as the backbone of the economy, and stand out in comparison to large group companies by greater flexibility and innovation dynamics and through greater cooperation. Together with households, their consumption is more than 50%. In line with current EU and Member States policies there is an interest in taking action to reduce excess electricity consumption. This work on a specific example of a small business company illustrates where such energy losses occur and how they can be effectively eliminated. The procedure also includes simplified economic recalculations of payback of investment. The use of obsolete equipment, inefficient use of equipment and stand-by mode of appliances and poor building structure insulation were identified as the main sources of excess consumption. The financial estimations have been related to actual prices. Finally the model (algorithm) is presented, which may also be universal as successive and structured procedure and adaptation to a specific segment under investigation.
Generally, the energy structure in the administrative or industrial institutions is becoming more and more complex. This fact results from structural and technological dependencies and interactions. So the response which will lead to increased energy efficiency need to be more complex to avoid existing objective and subjective barriers and to exploit all actual opportunities. Objective is to consider the whole complexity of the problem in order to obtain the further synergy effects in which the total benefit is higher than that of the additive individual performances.
Barriers to be overcome are mainly from the regulatory, informational, institutional, market, economical or technological reasons. On the other hand, there are more supporting factors, like - cost reduction and increased profit, increased competitiveness, long-term improvement of the entrepreneurial value chain, government assistance programs, legislative support, increasing of energy taxes or low level of interest rates. Both, barriers and opportunities should be thoroughly considered to make final and qualified qualified decision.
This work was supported by the Slovak Research and Development Agency under the Contract No. APVV-19-0049, Operational Program Integrated Infrastructure for the project: International Center of Excellence for Research on Intelligent and Secure Information and Communication Technologies and Systems - II. stage, ITMS code: 313021W404, co-financed by the European Regional Development Fund and project KEGA No. 019STU-4/2018: The process of integration of mentoring and coaching into educational process at technical universities financed by the Agency of the Ministry of Education, Science, Research and Sport of the Slovak Republic.
|
Em |
light intensity [lx] |
|
T |
temperature [℃] |
|
Greek symbols |
|
|
ε |
emisivity |
|
Subscripts |
|
|
p1 |
power per appliance |
|
pt |
total power |
|
h |
hours |
|
d |
days |
|
out |
outdoor |
|
in |
indoor |
[1] Official Journal of the European Union. (2010). Energy Performance of Buildings Directive 2010/31/EU (EPBD). https://eur-lex.europa.eu/LexUriServ/LexUriServ.do?uri=OJ:L:2010:153:0013:0035:en:PDF, accessed on Feb. 2, 2021.
[2] Official Journal of the European Union. (2012). Energy Efficiency Directive 2012/27/EU. https://eur-lex.europa.eu/LexUriServ/LexUriServ.do?uri=OJ:L:2012:315:0001:0056:en:PDF, accessed on Feb. 2, 2021.
[3] Bunse, K., Vodicka, M., Schönsleben, P., Brülhart, M., Ernst, F.O. (2011) Integrating energy efficiency performance in production management – gap analysis between industrial needs and scientific literature. Journal of Cleaner Production, 19(6-7): 667-679. https://doi.org/10.1016/j.jclepro.2010.11.011
[4] Hong, G.B., Ma, C.M., Chen, H.W., Chuang, K.J., Chang, C.T., Su, T.L. (2011). Energy flow analysis in pulp and paper industry. Energy, 36(5): 3063-3068. https://doi.org/10.1016/j.energy.2011.02.051
[5] Méloisa, A.B., Moujalleda, B., Guyota, G., Leprinceb, V. (2019). Improving building envelope knowledge from analysis of 219,000 certified on-site air leakage measurements in France. Building and Environment, 159: 106145. https://doi.org/10.1016/j.buildenv.2019.05.023
[6] Barreiraa, E., Almeidaa, M.S.F. R., Moreira, M. (2017). An infrared thermography passive approach to assess the effect of leakage points in buildings. Energy and Buildings, 140: 224-235. https://doi.org/10.1016/j.enbuild.2017.02.009
[7] Hoegner, L., Stilla, U. (2009). Thermal leakage detection on building facades using infrared textures generated by mobile mapping. In: 2009 Joint Urban Remote Sensing Event, Shanghai, China, p. 1263. https://doi.org/10.1109/URS.2009.5137681
[8] SIEA. (2014). Act no. 321/2014 Coll. on Energy Efficiency and on Amendments to Certain Acts (Zákon č. 321/2014 Z.z. o energetickej efektívnosti a o zmene a doplnení niektorých zákonov). https://www.siea.sk/wp-content/uploads/files/monitorovaci_system/legislativa/zakon_321-2014_o_energetickejefektivnosti.pdf, accessed on Nov. 13, 2020.
[9] Official Journal of the European Union. (2012). Directive 2012/27/EU of the European Parliament and of the Council of 25 October 2012 on energy efficiency, amending Directives 2009/125/EC and 2010/30/EU and repealing Directives 2004/8/EC and 2006/32/EC. https://eur-lex.europa.eu/legal-content/EN/TXT/PDF/?uri=CELEX:32012L0027&from=SK, accessed on Feb. 2, 2021.
[10] Hofmann, P. (2014). Energy Efficiency and cost reducing applications in companies. Zeitschrift für interdisziplinäre ökonomische forschung, 1(1): 89-94.
[11] Cattaneo, C. (2019). Internal and external barriers to energy efficiency: Which role for policy interventions? Energy Efficiency, 12: 1293-1311. https://doi.org/10.1007/s12053-019-09775-1
[12] Renovation wave. (2020). A Renovation Wave for Europe – Greening our buildings, creating jobs, improving lives. https://ec.europa.eu/energy/topics/energy-efficiency/energy-efficient-buildings/renovation-wave_en, accessed on Feb. 2, 2021.
[13] Krones, M., Müller, E. (2014). An approach for reducing energy consumption in factories by providing suitable energy efficiency. Measures Procedia CIRP, 17: 505-510. https://doi.org/10.1016/j.procir.2014.01.045
[14] Kim, J.J., Moon, J.W. (2009). Impact of Insulation on Building Energy Consumption. Eleventh International IBPSA Conference Glasgow, Scotland. http://www.ibpsa.org/proceedings/BS2009/BS09_0674_680.pdf, accessed on Feb. 2, 2021.
[15] Gielen, D., Boshell, F., Saygin, D., Bazilian, M.D., Wagner, N., Gorini, R. (2019). The role of renewable energy in the global energy transformation. Energy Strategy Reviews, 24: 38-50. https://doi.org/10.1016/j.esr.2019.01.006
[16] Hofmann, P., Šály, V. (2016). Needs and possibilities for improving energy efficiency in small and medium-sized enterprises. In Power Engineering 2016. Renewable Energy Sources 2016: 6th International Scientific Conference. Tatranské Matliare, Slovakia.
[17] Balaras, C., Argiriou, A.A. (2002). Infrared thermography for building diagnostics. Energy and Buildings, 34(2): 171-183. https://doi.org/10.1016/S0378-7788(01)00105-0
[18] Sérgio, T., Simoes, A., Goncalves, N. Mércio, G. (2014) The impact of thermal insulation cost on the profit of energy rehabilitation of buildings. In Proc. 40th IAHS World Congress on Housing Sustainable Housing Construction, Funchal, Portugal.
[19] SUTN. (2012). Light and lighting. Lighting of work places. Part 1: Indoor work places, STN EN 12464-1:2012. https://www.sutn.sk/eshop/public/standard_detail.aspx?id=114744, accessed on Nov. 13, 2020.
[20] Dubnička, R., Lipnický, L., Barčik, M., Gašparovský, D. (2016). Comprehensive view of LED products in luminaires. 2016 Diagnostic of Electrical Machines and Insulating Systems in Electrical Engineering (DEMISEE), Papradno, Slovakia. https://doi.org/10.1109/DEMISEE.2016.7530467
[21] Tagliabuea, L.C., Buzzetti, M., Arosio, B. (2012). Energy saving through the sun: Analysis of visual comfort and energy consumption in office space. Energy, Procedia, 30: 693-703. https://doi.org/10.1016/j.egypro.2012.11.079
[22] Hyun J.H., Mehmood, M.U., Ahmed, R., Kim, Y., Dutton, S., Lim, S.H., Chun, W. (2019). An advanced lighting system combining solar and an artificial light source for constant illumination and energy saving in buildings. Energy and Buildings, 203: 109404. https://doi.org/10.1016/j.enbuild.2019.109404
[23] Zou, D., Sun, C. (2020). Environmental thermal performance of prefabricated buildings based on building wall energy-saving technology. International Journal of Sustainable Development and Planning, 15(6): 965-969. https://doi.org/10.18280/ijsdp.150621
[24] Energystar. (2020). Methodology for Estimated Energy Savings from Cost-Effective Air Sealing and Insulating. https://www.energystar.gov/campaign/seal_insulate/methodology, accessed on Nov. 13, 2020.