Walaa Ahmed Yakoub | Osama Mahmoud Abo Eleinen | Mahmoud Fouad Mahmoud | Ghada Mohammad Elrayies*
© 2021 IIETA. This article is published by IIETA and is licensed under the CC BY 4.0 license (http://creativecommons.org/licenses/by/4.0/).
OPEN ACCESS
Urbanization, together with the environmental degradation problems associated with it, is one of the most significant causes of climate change. Since environmental issues impact the stability of our planet, our cities should be ready and strive to turn green quickly. Therefore, the assessment of urban and environmental sustainability is indispensable for making informed decisions. This paper provides a comparative analysis of seven global sustainability assessment tools for urban development, such as CASBEE for Cities, Green Star Communities, the Global City Indicator, the Green City Index, ISO37120, One Planet Living, and the International Eco-City Framework. The objectives of this study are as follows: 1) to allow a better understanding of the drivers and objectives of each exercise; 2) to extract the common environmental indicators from the global urban assessment tools; 3) to measure the weights of those indicators; and then 4) to deduce the environmental indicators that are not covered sufficiently in the tools. This investigation found that many of the indicators affecting increased environmental risks have not been adequately covered and should be addressed and included. Based on the above, the paper has developed a holistic green urban meter for sustainable urban assessment by establishing a comprehensive assessment framework that could increase the quality of life in the long term.
climate change, cities sustainability, urban assessment tools, indicators
The sustainability assessment of the built environment was addressed with rating tools for buildings more than two decades ago. Sustainability assessment systems for buildings were first developed in Europe and North America before being disseminated worldwide.
Despite high demand for and attention to green buildings, such tools have been demonstrated to be insufficient in guaranteeing the sustainability of the built environment. The recent researches have discussed the importance of extending the scale of evaluation from individual buildings to include cities and societies.
Therefore, the recent introduction of community and urban design assessment systems is represented an important achievement of the sustainability assessment [1-3].
As perceiving sustainability in a holistic conception is necessary to guarantee sustainable urban development, a proper understanding of the concepts, methods of approaches, tools, and techniques used in assessing the sustainability of urban development is required [4].
Seven assessment tools were studied as examples for cities’ sustainability assessment tools (Table 1). Each model was identified based on three criteria: (1) the scale of the method as a framework, index, guide, checklist, rating tool, and indicator; (2) its coverage level at the global, international, national, and local levels; and (3) the spatial coverage (i.e., urban areas, neighborhoods, districts, and cities). Each tool was analyzed and reviewed based on its objective and indicators, the environmental aspect, and the assessment methodology, as illustrated in Table 1.
2.1 CASBEE Urban Family, CASBEE for Urban Development, and CASBEE for Cities
In Japan, CASBEE Urban Family includes only two rating systems: CASBEE-UD and CASBEE for Cities [5]. The latter was published in 2006/2007 by Japan. CASBEE for Cities, as a basic tool, differs in terms of the building groups participated in the assessment scope. CASBEE for Cities focuses on the outdoor elements and situations associated with buildings and surrounding it. The evaluation includes decisive elements of urban and regional planning rather than the internal evaluation of buildings [6-9].
2.1.1 The aim of CASBEE for Cities
CASBEE for Cities ensures consistency of environmental design concepts, including buildings and the other elements in the same project site, and this also includes the design and planning, and the project implementation period. CASBEE for Cities includes improving the integrated environmental performance inside the cities by confirming the environmental measures and impacts for a group of buildings. CASBEE for Cities is planned for cities, regardless of the other tool, CASBEE for buildings, intended for building assessment. CASBEE for Cities uses the full environmental performance assessment of a building complex on the city scale using two assessment items: the Q3 (outdoor environment of the development site) and LR3 (foreign environment) [6].
Table 1. The identification criteria of the selected assessment tools
|
|
Model |
Identification Criteria |
||
|
Typology |
Coverage level |
Spatial Coverage |
||
|
1 |
One Planet Living |
Framework |
International |
City |
|
2 |
Green Star Community |
Framework |
National, local |
Neighborhood, City |
|
3 |
International Eco-City Framework |
Guide |
International |
City |
|
4 |
CASBEE for Cities |
Rating tool |
Global, national, Local |
City |
|
5 |
Global City Indicator |
Guide |
International |
City |
|
6 |
ISO37120 |
Index |
Global |
City |
|
7 |
Green City Index |
Indicators |
Global |
City |
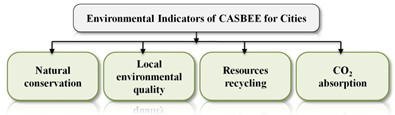
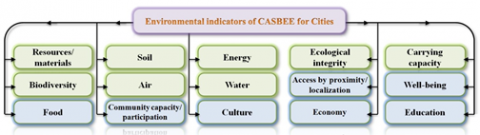
Figure 1. Environmental indicators of CASBEE for Cities [10]
2.1.2 Indicators of CASBEE for urban development
The three themes of CASBEE for Urban Development are environment (Q1), society (Q2), and economy (Q3), the main dimensions of which are listed in Table 2.
Table 2. Main dimensions of CASBEE for Cities [10]
|
Q1 |
Q2 |
Q3 |
|
Resource |
Impartially fairness |
Traffic urban structure |
|
Nature (greenery/biodiversity) |
Security/safety |
Growth potential |
|
Artificial (buildings) |
Amenity |
Efficiency rationality |
2.1.3 Environmental aspect of CASBEE for Cities
This environmental aspect forms a third of the total indicators, where it is represented in the Q1 category with four indicators: (1) natural conservation, (2) local environmental quality, (3) resources recycling, and (4) CO2 absorption (see Figure 1) [10].
2.1.4 Assessment methodology of CASBEE for Cities
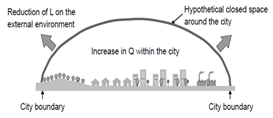
The method is basically similar to the CASBEE assessment of buildings. Environmental quality is divided by environmental load reduction, resulting in so-called built-environment efficiency (BEE). Environmental quality comprises “natural environment (microclimates and ecosystems),” “service functions of the urban area,” and “contribution to the local community (history, culture, scenery, and revitalization),” each with four to six subcategories and two to four indicators underpinning them. Environmental load reduction is substantiated by “environmental impact on microclimates, facade, and landscape,” “social infrastructures,” and “management of the local environment,” again containing four to six subcategories with concrete indicators. In terms of scoring criteria, CASBEE for Cities has two main indicators in assessment: QUD or the environmental quality of urban development, which contains three indicators (QUD1/environment, QUD2/society, and QUD3/economy), and LUD or the environmental load of urban development, as shown in Figures 2 and 3 [10]. The major themes of LUD include “CO2 emissions from the traffic sector, the building sector, and absorption in the green sector” [4]. CASBEE for cities rating benchmarks are shown in Table 3.
Figure 2. Main indicators of CASBEE for Cities assessment [10]
Figure 3. Assessment objects of CASBEE for Cities [10]
The results of the assessment are represented in different ways in the assessment results sheet: block overview, CO2 emissions charts, radar charts, bar charts, consideration in planning, and consistency in upper-level planning.
Table 3. CASBEE for cities rating benchmarks [10]
|
Poor |
C |
* |
|
Fairly poor |
B− |
** |
|
Good |
B+ |
*** |
|
Very good |
A |
**** |
|
Excellent |
S |
***** |
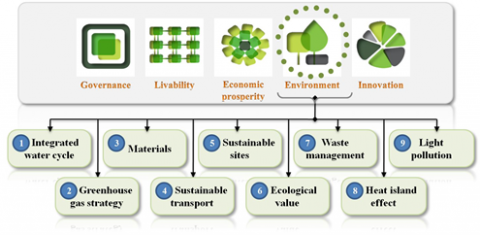
2.2 Green Star Communities
In Australia, the Green Star Communities framework was launched in 2012. It assesses the planning, design, and construction of large-scale development projects at the precinct, neighborhood, and/or community scale. Green Star Communities rates projects at such scales against the following categories: Livability, economic prosperity, environment, design, governance, and innovation [11]. It helps decision makers and urban planners with sustainable outcomes in the earliest stages: site selection, concept planning, detailed planning, design, and site works.
2.2.1 The aim of Green Star Communities
The framework seeks to ensure that communities are on a clear path to achieving the following [11]:
2.2.2 Indicators of Green Star Communities
After extensive consultation with industry stakeholders from social planners to agronomists, the Green Star Communities national framework and rating tool were developed. The rating tool establishes benchmarks for assessing the projects according to a framework, which consists of five principles (see Figure 4). These principles shape and define the sustainable community in Australia [11], which form the vision and definition for a sustainable community in Australia.
2.2.3 Environmental aspect of Green Star Communities
Although the Green Star Communities rating tool does not rate buildings, it acknowledges that best-practice buildings can contribute to making a community healthier and more sustainable. Through the Env-6 “Green Buildings” credit, the Green Star Communities rating tool rewards community development projects that include certified environmentally sustainable buildings, such as buildings that achieve the “Green Star — Design,” “Green Star — As Built,” or “Green Star — Performance” ratings [11].
2.2.4 Assessment methodology of Green Star Communities
The Green Star Communities rating tool classifies the “plan of development” for the community and the plan of implementation through the design and construction stages. The rating tool can be applied to many different types of communities, from industrial or commercial zones to residential or mixed-use developments and infill as well as brownfield and greenfield development projects that include a minimum of four buildings [11].
Table 4. Benchmarks of Green Star Communities [11]
|
Rating |
Weighted Points Score |
Category |
|
0 star |
0–9 |
Assessed |
|
1 star |
10–19 |
Minimum Practice |
|
2 stars |
20–29 |
Average Practice |
|
3 stars |
30–44 |
Good Practice |
|
4 stars |
45–59 |
Best Practice |
|
5 stars |
60–75 |
Australian Excellence |
|
6 stars |
+75 |
World Leadership |
The project assessed by Green Star Communities achieves the approved classification starting with one Star (with a weighted point score ranges from 10_19 as it categorized as Minimum Practice), before that the project is “Assessed" (with 0_9 points) (see Table 4).
Figure 4. The five categories of the Green Star Communities rating system and the environmental indicators [11, 12]
Consequently, the scorecard, which is an interactive file, must be used by projects seeking Green Star certification. This scorecard represents a registration tool to the projects to follow up their claims of the Green Star points.
2.3 Global City Indicator
The Global City Indicators Facility (GCIF) has developed and implemented a standardized global indicator set that allows for performance evaluation on an international scale (Global Cities Institute, 2007). The tool covers all sides of urban life, giving a special importance to social and economic measures of sustainability. While it does not measure pollution or air quality and little mention is made of renewable energy sources, the tool is well-established, and hundreds of cities are already GCIF members. A notable strength of the GCIF system is that it is easy to implement [13]. GCIF indicators have become an invaluable tool for the exchange of reliable information and learning among cities. The GCIF has developed into a growing global network of over 250 cities reporting on this standard across Latin America, Africa, Asia, the Middle East, Europe, and North America [14].
2.3.1 The aim of the Global City Indicator
The Global City Indicator focuses on cities with populations over one hundred thousand. This standardized system of global city indicators allows for global comparability of city performance and knowledge sharing. The Global City Indicator’s database provides cities with a free web-based system to enter city data, track progress over time, and facilitate capacity building and knowledge sharing.
2.3.2 Indicators of the Global City Indicator
The Indicators for Sustainability report [15] from Sustainable Cities International took a different approach to the development of an indicator set compared to the other frameworks mentioned thus far. It started with case studies of several global cities of different sizes. From this information, they chose indicators that were common to several cities and easy to understand and implement and that covered multiple related sustainability goals. The result is a set of core, flexible, easy-to-implement core indicators for cities, regardless of size or location. The indicators cover a wide range of sustainability goals. Little weight is given to indicators of health and governance; however, the report itself incorporates the indicator list into an easy-to-use Toolkit for Cities. This includes guidelines for evaluating the needs of a specific city and establishing baseline targets as well as best practices gleaned from case studies. Structured themes are organized into two broad categories: city services and quality of life (see Figure 5).
2.3.3 Environmental aspect of the Global City Indicator
The environmental aspect of the Global City Indicator is highlighted in Table 5 among tool indicators. Those aspects are represented in wastewater, energy, solid waste, and water among city-services themes and represented in the environment among quality-of-life themes.
2.3.4 Assessment methodology of the Global City Indicator
The Global City Indicators Program process includes monitoring, reporting, validating and adjusting the indicators. This is accomplished through a dynamic website (www.cityindicators.org) that allows participating cities around the world to standardize their set of indicators, analyze their results, and share best practices on quality of life and service delivery. Cities enter required data per the template on the website (numerator and denominator space prescribed), and the website automatically compiles indicators ensuring data quality.
2.4 Green City Index
The Green City Index, developed by the German technology enterprise Siemens, focuses on the environmental dimension [16]. The considered aspects are CO2, energy, buildings, transport, water, waste, land use, air quality, and environmental management, each of which are determined by quantitative and qualitative indicators. The aspect of energy, for example, is substantiated by the indicators energy consumption, energy intensity, share of renewable energy, and support of clean energy. The latter, as a qualitative indicator, shall be evaluated by Economist Intelligence Unit6 analysts, such as other qualitative indicators of the Green City Index. The focus of the Green City Index lies on environmental issues while neglecting economic and social aspects that should be part of an assessment of urban sustainability [17].
2.4.1 Aim of the Green City Index
The Green City Index measures the environmental performance of major cities and their commitment to reducing their environmental impact. The cities were chosen with a view to representing major countries and include capital cities or leading business capitals selected on the basis of size, geographical spread, and data availability. In cases where a significant lack of data relating to a city was evident, the comparison of major cities in Europe, Asia, Africa, and the Americas in terms of their environmental performance and policies aided the understanding of the strengths and weaknesses of each city and its performance against its peers.
Figure 5. Main categories of the Global City Indicators [13]
Table 5. Themes of the Global City Indicators [15, 18]
|
City-Services Themes |
Quality-of-Life Themes |
|
|
*The environmental aspect
2.4.2 Indicators of the Green City Index
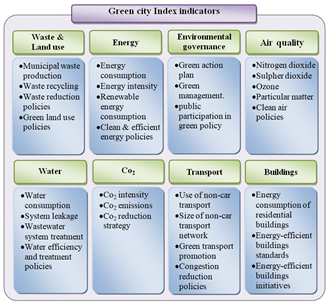
The Green City Index includes approximately thirty indicators within eight to nine categories depending on the region. Its categories cover CO2 emissions, energy, buildings, land use, transport, water and sanitation, waste management, air quality, and environmental governance [16].
2.4.3 Environmental aspect of the Green City Index
An expert panel developed a set of thirty indicators to compare cities: sixteen quantitative indicators and fourteen qualitative indicators. The set of indicators comprehensively covers all major areas of urban environmental sustainability, giving a significance importance on energy and carbon dioxide emissions. Nevertheless, little attention is given to measures of happiness, health, and quality of life. The indicators are divided into quantitative indicators, which measure the city’s current performance, and qualitative indicators, which cover the aspirations and commitments of a city to sustainable practices [19]. These include land use, energy, environmental governance, air quality, sanitation, water, transport, waste, and CO2 [16] (see Figure 6).
2.4.4 Assessment methodology of the Green City Index
The Green City Index aims to closely follow their structure. However, to be applicable in different areas throughout the world, its methodology has been adapted to accommodate variations in data quality and availability as well as environmental challenges specific to the region. The index records cities across eight categories: 1) energy and carbon dioxide, 2) land use, 3) transportation, 4) waste, 5) water, 6) sanitation, 7) air quality, and 8) environmental management, and it consists of twenty-five individual indicators. Twelve of the indicators are based on quantitative data and aim to measure how a city currently performs—for example, its level of CO2 emissions from electricity consumption, the proportion of the population living in informal settlements, the level of waste production, and access to sanitation. The remaining thirteen indicators are qualitative assessments of each city’s policies, regulations, and ambitions. The set of indicators is designed to use publicly available data (with a notable exception of CO2 emissions that are not well reported in many European cities), and each indicator is normalized to allow comparison among cities. This indicator system was not purposed for widespread use but could easily be adapted to evaluate other cities.
Figure 6. Indicators of the Green City Index system [16]
2.5 International Eco-City Framework
Ecocity Builders and its network of partner consultants are working to establish the International Eco-city standards (IES) so that participating cities can evaluate their environmental status in conjunction with a global network of local governments and specialist experts committed to the entire system improvement process [20].
2.5.1 Aim of the International Eco-City Framework
The International Eco-City Framework and Standards initiative seeks to provide an innovative vision for an ecologically restorative human civilization and amplify all efforts toward greater ecological and social health. Additionally, it seeks to unite people around a way of living that provides the best possible cities for people to live in while enhancing, not destroying, the biosphere. This entails a practical methodology for assessing and guiding progress toward the goal of the IES, which is to provide support and criteria by which cities can adopt measures that would enable them to successfully move toward becoming eco-cities. This approach provides a network, tools, and a methodology for cities to assess their performance relative to the IES [20].
2.5.2 Indicators of the International Eco-City Framework
The International Eco-City Framework provides a way to visualize eco-city assessment along fifteen dimensions coded for natural capital, social capital, and financial capital (Figure 7) [20].
2.5.3 Environmental aspect of the International Eco-City Framework
These environmental indicators are highlighted in green in Figure 7.
Figure 7. Indicators of the International Eco-City Framework (the environmental indicators are indicated in green) [21]
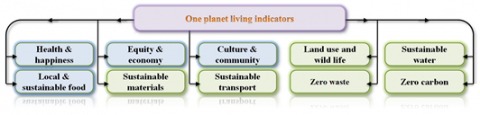
Figure 8. Two headlines including the ten indicators in One Planet Living (the environmental indicators are in green) [23, 24]
2.5.4 Assessment methodology of the International Eco-City Framework
The International Eco-City Framework was designed for a wide range of users and charts a city’s steps forward—from existing conditions to “threshold” eco-city status and beyond. The framework helps people see how their city is doing on a range of important measures, charted from “unhealthy” through multiple levels of “greener city,” “eco-city,” and the whole-earth level, “Gaia” [21]. Although this framework provides a much grounded high-level structure, it doesn’t go as far as to specify benchmarks or even design indicators.
2.6 One Planet Living
We only have one Planet Earth, but as a global society, we’re living as if we have several planets and consume the earth in ways that cannot be sustained. A lot of things have to change, but if we work together, we can enjoy just as much comfort, more security, and better health while living lives that are enriching, fulfilling, and sustainable [22].
2.6.1 Aim of One Planet Living
One Planet Living aims for all humankind to lead happy and healthy lives within the environmental limits of our planet through an easy and attractive process. This simple framework enables everyone, from the general public to professionals, to collaborate on a sustainability strategy, drawing on everyone’s insights, skills, and experience. It is based on ten guiding principles of sustainability that can be used to create holistic, joined-up solutions.
Therefore, the objectives of One Planet Living are as follows: (1) to promote sustainable living by making it easy to share and reduce the consumption of natural materials; (2) to carefully consider every material and product and select it for its positive social and environmental benefits or for reducing its negative impact; and (3) to promote materials and products that are not toxic to humans or wildlife at any stage in their lifecycle, from the raw material stage to the manufacturing, use, and end-of-life stages.
2.6.2 Indicators of One Planet Living
One Planet Living uses two main indicators to sustainably live on planet Earth: (1) the ecological footprint, a method for calculating a wide range of our demands on land and sea; and (2) the carbon footprint obtained from science of climate. These indicators measure greenhouse gases including CO2 released from burning fossil fuels and practices used in agriculture.
2.6.3 Environmental aspect of One Planet Living
The environmental indicators of this community are represented in green in Figure 8.
2.6.4 Methodology of assessment in One Planet Living
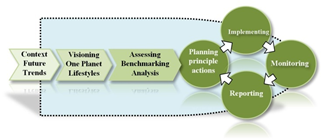
The methodology of One Planet Living revolves around putting a plan into action and monitoring its progress, as shown in Figure 9, by defining targets that can be set as tangible measures of progress to be achieved in a specific time and linked to relevant indicators. Moreover, this enables community groups that want to create a “shared vision” for a more sustainable future that everyone in the local area can work toward.
Figure 9. Methodology of assessment in One Planet Living [23]
2.7 ISO37120
Officially, these data standards are known as ISO37120, the result of a collaboration with the International Organization for Standardization, the Geneva-based agency that develops global standards on products, processes, and services. As dozens of cities pilot the new ISO framework for cities, two more standards are under development on “smart” cities and urban resilience. ISO37120:2014 is the first ISO standard for city indices. It is developed as part of an integrated set of sustainable development standards in societies. ISO37120, published in 2014, defines over a hundred city indicators to be used globally by cities to measure and compare their performance. They cover seventeen themes, including education, environment, health, safety, finance, and shelter. This is a standard with a set of indicators assessing the performance of cities’ service delivery and quality of life to provide a holistic and integrated approach to sustainable development and resilience. The Reference Framework for European Sustainable Cities (RFSC) is a free-of-charge web tool for European local authorities designed to help cities and urban territories promote and improve their integrated urban development actions [18, 25].
2.7.1 Aim of ISO37120
This section defines the environmental theme indicators listed in ISO37120. Any city, municipality or local government that wishes to measure its performance in a verifiable and comparable way can use the ISO37120 standards on city indicators (ISO37120:2014). And that is applied regardless of size, location or level of development:
2.7.2 Indicators of ISO37120
The ISO37120 tool has defined more than 250,000 indicators, focusing on the following mentioned items in Table 6. The indicators of ISO37120 are categorized as “core” (mandatory), “profile” (descriptive), and “supporting” (voluntary). The International Eco-City Framework groups the headings of the indicators according to “Urban Design,” “Bio-Geo Physical Features,” “Socio-Cultural Features,” and “Ecological Imperatives” [25].
Table 6. Main Indicators of ISO37120
|
Indicators of ISO 37120 |
|
|
|
|
|
|
|
|
|
|
|
|
|
|
|
|
|
|
|
|
|
|
|
|
|
|
|
|
|
|
|
|
2.7.3 Environmental aspect of ISO37120
ISO37120 addresses different indicators belonging to the environmental [18] (see Figure 10).
2.7.4 Assessment methodology of ISO37120
The main methodology centers on the resilience and smartness of cities. On resilience, the framework started gathering suggestions. The ISO37120 definitions and methodologies were mapped of all 20,500 indicators to all cities of the SDGs, and the mapping was presented to the United Nations Sustainable Statistics Division. ISO37120 can assess cities’ performance and then measure progress overtime, using the benchmarks indicated in Figure 11 (five levels).
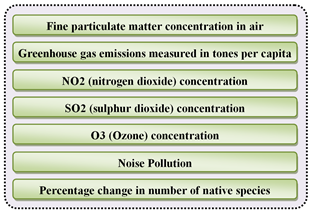
Figure 10. Environmental indicators of ISO37120
Figure 11. Benchmarks of ISO37120 [26]
3.1 A comprehensive review of the main features of the environmental assessment tools
The quantitative comparison of the seven reviewed sustainability assessment tools’ types of criteria and indicators can assist users and tool developers in identifying shared knowledge and directions for future research and development. The sustainability assessment tools of urban development were mainly compared according to the environmental indicators (see Table 7). The comparison includes a description of the assessment tools in the context of the major indicators, the developer, the year issued, the aim, the count of sub-indicators, and the used benchmarks for each tool.
3.2 Share of mandatory indicators
The greater the number of mandatory criteria imposed on the evaluator during the assessment process, the more efficient and effective the evaluation. All the assessment tools include mandatory indicators except for CASBEE for Cities and the International Eco-City Framework, which appeared as optional indicators only without any mandatory limitations. ISO37120 is indicated as the most efficient and effective tool, where the share of mandatory indicators is 100%, followed by the Green City Index with 53.3% (see Table 8).
Table 7. A review of the main features of the evaluated assessment tools [6, 10, 12, 17, 18, 25, 27-30]
|
|
1. Green Star Community |
2. ISO37120 |
3. CASBEE for Cities |
|
Created by |
Green Building Council of Australia (GBCA), |
World Council on City Data (WCCD), USA |
Japan Sustainable Building Consortium (JSBC) and Japan Green Building Council (JaGBC), Japan |
|
Year |
2012 |
2014 |
2011 |
|
Factors
|
Governance Design Livability Economic prosperity Environment Innovation |
Energy Environment Solid waste Transport Urban planning Sanitation Water |
Q (urban planning, air, water, waste, carbon) L (CO2 from energy and non-energy sources) |
|
Aim |
Provide independent verification that a community project is sustainable |
Sustainable development of urban communities |
Assess built environment in terms of Q&L within BEE |
|
No. of Secondary Factors |
32 |
25,000 |
80 |
|
Classification |
National, local |
Global |
Global, national, local |
|
Assessment Method |
By an interactive scorecard that must be used by projects seeking Green Star certification. The scorecard provides a project scoring tool to keep track of the claims of their Green Star points. |
Assess cities’ performance and measure progress overtime |
BEE= score of Q/score of L |
|
Rating Classification |
1–3 stars 4 stars 5 stars 6 stars |
Aspirational (35–40 indicators) Bronze (46–95 indicators) Silver (60–75 indicators) Gold (76–90 indicators) Platinum (91–100 indicators) |
Poor (C)* Fairly poor (B−)** Good (B+)*** Very good (A)**** Excellent (S)***** |
Table 7. A review of the main features of the evaluated assessment tools [6, 10, 12, 17, 18, 25, 27-30] (continued)
|
|
4. Global City Indicator |
5. Green City Index |
6. International Eco-City Framework |
7. One Planet living |
|
Created by |
World Bank, USA |
Siemens, Germany |
Eco-City Builders, USA |
WWF, Switzerland |
|
Year |
2008 |
2009 |
2020 |
2014 |
|
Factors
|
City services: governance, health, education, recreation, energy, water, transportation, fire and emergency response, finance, safety, wastewater, solid waste, urban planning Quality of life: environment, shelter, civic participation, culture, social equity, culture, economy, technology and innovation |
Energy and CO2 Land use Transport Waste Water Sanitation Air quality Environmental management |
Urban planning Clean air Pure water Material and resources management Soil |
Zero waste Zero CO2 Sustainable transport Sustainable material Local food Sustainable water |
|
Aim |
Provide a stable set of city indicators with a globally standardized methodology that enables global comparability of knowledge sharing and city performance |
Measure the environmental performance of major cities and their commitment to reducing their environmental impact |
Unite people around a way of living on the planet that provides the best possible cities for people to live in while enhancing the quality of life |
Defined targets that can be set as tangible measures of progress. They will be achieved in a specific time and linked to a relevant indicator. |
|
No. of Secondary Factors |
115 |
30 |
15 |
69 |
|
Classification |
International |
Global |
International |
International |
|
Assessment Method |
The indicator themes are organized into two main categories. |
Certain categories of indicators can compare and assess cities in terms of their policies and environmental performance. |
Assess how the city is doing on a range of important measures, charted from “unhealthy” through multiple levels, ending with “Gaia” |
Going beyond vague definitions of sustainable development through quantitative and qualitative performance measures called common international targets |
|
Rating Classification |
Not issued |
Not issued |
Unhealthy Green city Eco-city Gaia level |
Evaluation of environmental development projects |
Table 8. Share percentage of mandatory indicators of the assessment tools [8, 31, 32]
|
Assessment Tool |
M |
T |
SMI |
|
CASBEE for Cities |
|
|
|
|
Green Star Communities |
|
|
|
|
Global City Indicator |
|
|
|
|
Green City Index |
|
|
|
|
ISO37120 |
|
|
|
|
International Eco-City Framework |
|
|
|
|
One Planet Living |
|
|
|
(M) = Total number of mandatory indicators, (T) = Total number of indicators in the tool, (SMI) = Share of mandatory indicators = M/T×100
3.3 Deficiency of urban sustainability assessment tools
Table 9 shows the merits and limitations of each studied urban assessment tool. Almost all the merits revolved around addressing the environmental load on the city, focusing on core indicators and basic services and improving decision-making processes. Hence, the prominent disadvantages are the non-standardization of indicators and such indicators being qualitative.ISO37120 is the best tool of all the studied tools in terms of improving the decision-making process for city managers, while the Global City Indicator and One Planet Living lack the non-standardization of indicators.
3.4 Common categories and sub-indicators among assessment tools
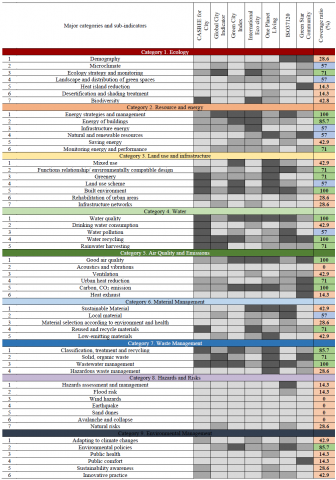
By using EFA and CFA analysis, the common factors among the main and sub-indices of the seven assessment tools can be extracted in the form of a major categories and sub-indicators matrix, as shown in Table 10. Each sub-indicator is experienced for each tool with respect to its application: fully applicable (dark gray), semi-applicable (gray), and not applicable (light gray). Both categories (resources and energy and water) are almost fully applicable; on the contrary, the category of hazards and risks is almost non-applicable.
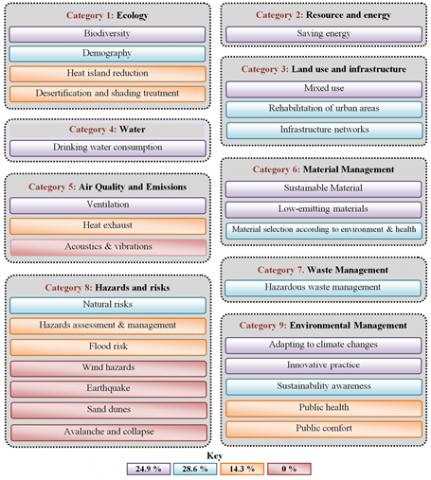
Also, this investigation represents an evaluation of each tool where it shows the deficiencies in some important sub-indicators that are highly recommended by this paper to be covered in the environmental assessment. For example, no coverage of the effect of the urban heat island exists in CASBEE for Cities, the Global City Indicator, the Green City Index, the International Eco-City Framework, One Planet Living, and ISO37120. The desertification and shading treatment are not covered enough in all tools, with the exception of One Planet Living. The percentages of the attainment of the coverage ratio among the seven studied tools are represented in Table 10. Red indicates that this indicator has not been completely achieved or has a weak percentage, which means that it is highly recommended. Blue indicates that the indicator is applied at an average rate (about 57%), which also indicates that it is recommended. Green indicates that the indicator has been covered at a large percentage among the tools (see Table 10 and Figure 12).
The sub-indicators highlighted in red in the “coverage ratio among tools (%) “column in Table 10 is detailed in Figure 12. From this figure, we can deduce that hazards and risks category have deficiencies in several indicators: wind hazards, earthquake, sand dunes, and avalanche and collapse. Acoustics and vibrations also have not been covered at all among the seven tools. At a little higher degree of coverage, sub-indicators represented in hazards assessment and management, flood risk, heat exhaust, heat island reduction, desertification and shading treatment, public health, and public comfort are represented in a low percentage among the global tools. Many of these sub-indices are of considerable importance because they reflect many contemporary environmental challenges. These sub-indicators are involved in the developed green meter.
Table 9. Merits and deficiency features of the studied assessment tools
|
Assessment Tool |
Merits |
Deficiency Features |
|
CASBEE for Cities |
Addresses the environmental load on the city along with the indoor quality of city |
No considerations for energy resources and footprint calculations |
|
Global City Indicator |
Simple metrics: Focuses on core indicators and basic services |
Nonstandard indicators to be suitable for the conditions of almost all global cities |
|
Green City Index |
Adapts methodology to accommodate variations in data quality and availability as well as environmental challenges specific to the region |
Half of its indicators being qualitative assessments |
|
International Eco-City Framework |
Provides support and criteria by which cities can adopt measures that would enable them to successfully move toward becoming eco-cities |
Provides a very grounded high-level structure yet does not go as far as to specify benchmarks or even design indicators |
|
One Planet Living |
Links the science of ecological foot printing to a simple framework of principles |
Standardized data may not correspond to the data provided by the statistical bureau |
|
ISO37120 |
Entails more effective governance and delivery of services and informed decision making for policymakers and city managers |
Exaggerated number of assessment criteria |
|
Green Star Community |
Involves rating tool credits that change over time as best-practice changes (e.g., storm water criteria) |
Subdivision standards that set excessive block lengths and road corridor widths, reduce pedestrian access, and specify other site layout provisions that reduce walkability and accessibility |
Table 10. Matrix of the main indicators and sub-indicators among the studied assessment tools
Figure 12. Sub-indicators highly recommended by the developed urban meter (The percentages refer to the extent of their application among the studied tools)
Seven global assessment tools have been selected for a critical review of their characteristics, organizations, components, processes, and procedures. The reviewed tools are widely used for assessing the sustainability of urban development in different regions of the world. The assessment tools for urban sustainability have become an important part of the sustainability plan as they can enable urban communities to become green and eco-friendly. The aim of the review is to highlight the environmental aspect of the studied assessment tools in terms of aim, organizational structure, indicators, environmental aspect, assessment methodology, sub-indicator count, and benchmarks. This paper introduces an overview of the most popular models used in the assessment and evaluation of urban communities. CASBEE for Cities, Green Star Communities, the Global City Indicator, the Green City Index, ISO37120, One Planet Living, and the International Eco-City Framework have been analyzed to compare the existence and impact of the sustainability assessment criteria addressed in the seven systems. While most of the models have addressed the comprehensive aspects of development—social, economic, and environmental—this paper finds that the evaluation of the environmental aspects of the urban community is considered the basis for the stability of urbanization in facing climate change throughout that stage.
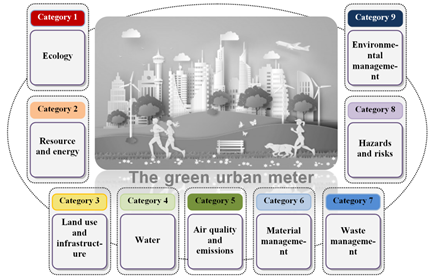
This investigation found that while the assessment tools show a wide coverage of environmental context, disparities are apparent in the scope of the topics that have been covered by the indicators and sub-indicators included in the global sustainability assessment tools. Therefore, many indicators affect the increase of environmental risks and should be addressed. The assessment criteria and certification methods of the mentioned assessment tools have been identified and assigned to nine eco-friendly city criteria: ecology, resources and energy, land use and infrastructure, water quality, air quality and emissions, material management, waste management, hazards and risks, and environmental management (see Figure 13).
Figure 13. The main indicators of the developed green urban meter
[1] Berardi, U. (2013). Sustainability assessment of urban communities through rating systems. Environment, Development and Sustainability, 15(6): 1573-1591. https://doi.org/10.1007/s10668-013-9462-0
[2] Turcu, C. (2013). Re-thinking sustainability indicators: Local perspectives of urban sustainability. Journal of Environmental Planning and Management, 56(5): 695-719. https://doi.org/10.1080/09640568.2012.698984
[3] Matthews, N.E., Stamford, L., Shapira, P. (2019). Aligning sustainability assessment with responsible research and innovation: Towards a framework for Constructive Sustainability Assessment. Sustainable Production and Consumption, 20: 58-73. https://doi.org/10.1016/j.spc.2019.05.002
[4] Kaur, H., Garg, P. (2019). Urban sustainability assessment tools: A review. Journal of Cleaner Production, 210: 146-158. https://doi.org/10.1016/j.jclepro.2018.11.009
[5] Ayik, C., Ayatac, H., Sertyesilisik, B. (2017). A gap analysis on urban sustainability studies and urban sustainability assessment tools. Archit Res., 7(1): 1-15. https://doi.org/10.5923/j.arch.20170701.01
[6] Lin, K.W., Shih, C.M. (2018). The comparative analysis of neighborhood sustainability assessment tool. Environment and Planning B: Urban Analytics and City Science, 45(1): 90-105. https://doi.org/10.1177/0265813516667299
[7] Haapio, A. (2012). Towards sustainable urban communities. Environmental Impact Assessment Review, 32(1): 165-169. https://doi.org/10.1016/j.eiar.2011.08.002
[8] Sharifi, A., Murayama, A. (2013). A critical review of seven selected neighborhood sustainability assessment tools. Environmental Impact Assessment Review, 38:73-87. https://doi.org/10.1016/j.eiar.2012.06.006
[9] JSBC, IBEC. CASBEE 2020. http://www.ibec.or.jp/CASBEE/english/, accessed on Apr. 11, 2020.
[10] JSBC. (2006). CASBEE Technical Manual 2006 Edition: CASBEE for City. Institute for Building Environment and Energy Conservation, Tokyo.
[11] GBCA. Guide for Local Government: Green Building Council of Australia. https://new.gbca.org.au/green-star/rating-system/communities/, accessed on Nov. 20, 2017.
[12] Australia GBC. (2011). Green Star Communities National Framework. Green Building Council of Australia, Sydney.
[13] Bhada, P., Hoornweg, D. (2009). The global city indicators program: A more credible voice for cities. Directions in Urban Development: World Bank, Washington, DC. https://openknowledge.worldbank.org/handle/10986/10244, accessed on Feb. 22, 2020.
[14] McCarney, P. (2009). City indicators on climate change: Implications for policy leverage and governance. In: Hoornweg D, Freire M, Lee MJ, Bhada-Tata P, Yuen B, editors. Cities and Climate Change. 2: World Bank, Washington, DC, pp. 1-18.
[15] Dekker, S., Jacob, J., Klassen, E., Miller, H., Thielen, S., Their, W.W. (2012). Indicators for Sustainability. Sustainable Cities International. https://ec.europa.eu/environment/integration/research/newsalert/pdf/indicators_for_sustainable_cities_IR12_en.pdf.
[16] Seimens. (2012). The Green City Index Munich, Germany: Siemens AG, Munich, Germany. https://apps.espon.eu/etms/rankings/2012_European_Green_City_Index_sum_report.pdf.
[17] Govindarajan, V. (2014). A critique of the European Green City Index. Journal of Environmental Planning and Management, 57(3): 317-328. https://doi.org/10.1080/09640568.2012.741520
[18] Dahleh, D., Fox, M.S. (2016). An environmental ontology for global city indicators (ISO 37120). PolisGnosis Project: Representing and Analysing City Indicators. https://doi.org/10.13140/RG.2.2.10776.21769
[19] Li, Y., Gang, X. (2012). A Report on Some Urban Sustainability Indicators Practiced in the World 2012 [cited 2018 12/8]. https://www.cpij.or.jp/com/ac/reports/11-1_20.pdf, accessed on Aug. 12, 2020.
[20] Moore, J., Miller, K., Register, R., Campbell, S. (2017). International Ecocity Standards: Oakland, CA: Ecocity Builders. www.ecocitystandards.org, accessed on Jul. 31, 2018.
[21] Ecocity Builders. International Ecocity Framework and Standards USA2011. http://www.ecocitybuilders.org/whatwe-do/ecocity-standards, accessed on May 2, 2018.
[22] BDG. (2016). One Planet Goals and Guidance for Communities and Destinations. United Kingdom: Bioregional Development Group. https://oneplanet.com/documents/guides-guidances/Goals-and-Guidance-for-Communities-Jan-2017.pdf.
[23] BDG. (2014). One Planet Living: Bioregional Development Group. https://www.bioregional.com/oneplanetliving/, accessed on Feb. 25, 2018.
[24] Desai, P. (2010). One Planet Communities: A real-life guide to sustainable living: Chichester, John Wiley & Sons Ltd.
[25] ISO37120. Sustainable Development of Communities – Indicators for City Services and Quality of Life. International Organization for Standardization, 2014.
[26] WCCD. World Council on City Data 2018. www.dataforcities.org/, accessed on Dec. 8, 2018.
[27] Ali-Toudert, F. (2007). Towards urban sustainability: Trends and challenges of building environmental assessment methods. Sustainable Building (SB 07), Sustainable Construction, Materials and Practices Lisbon, Portugal: Central Europa towards Sustainable Building (CESB 07), Prague.
[28] Castanheira, G., Bragança, L. (2014). The evolution of the sustainability assessment tool: From buildings to the built environment. The Scientific World Journal, 2014: 1-10. https://doi.org/10.1155/2014/491791
[29] Tam, V.W., Karimipour, H., Le, K.N., Wang, J. (2018). Green neighbourhood: Review on the international assessment systems. Renewable and Sustainable Energy Reviews, 82: 689-699. https://doi.org/10.1016/j.rser.2017.09.083
[30] Chipanga, R. (2015). Sustainable urban development and its impact on facilities management: The case of the city of Doha, Qatar. University of Cape Town.
[31] Guimarães, E.T., Barbosa, J.A.S.D., Bragança, L., editors. (2016). Critical overview of urban sustainability assessment tools. SBE16 Brazil & Portugal-Sustainable Urban Communities Towards a Nearly Zero Impact Built Environment.
[32] Ameen, R.F.M., Mourshed, M., Li, H. (2015). A critical review of environmental assessment tools for sustainable urban design. Environmental Impact Assessment Review, 55: 110-125. https://doi.org/10.1016/j.eiar.2015.07.006