Lindamullage D.C.H.N. Kalpana* | Chethika Abenayake | Amila Jayasinghe | Pelpola K.S. Mahanama | Niroshan Sanjaya
© 2021 IIETA. This article is published by IIETA and is licensed under the CC BY 4.0 license (http://creativecommons.org/licenses/by/4.0/).
OPEN ACCESS
The configuration of urban areas depicts the pattern of urban agglomeration that drives a country’s economy. Since the era of the early-industrial revolution, many scholars have been continuingly attempted to recognize the pattern of urban agglomeration in cities and regions. Nevertheless, such efforts had been in completed in capturing the complex nature of the agglomerations in modern cities. In such context, this study proposes a novel modeling approach to capture the pattern of urban agglomeration of a given region. In the proposed model, which is named as the intersection based clustered network model (iCN Model), the centrality of the road network is considered as the primary indicator in capturing the urban agglomeration pattern. The model was developed on the basis of the percolation theory and fractal geometry. The model distinguishes the agglomerated urban clusters and measures the self-similarity of the clusters of urban agglomeration. The results revealed that the urban agglomeration pattern derived from the iCN model corresponds with the satellite imagery derived the urban agglomeration pattern with an acceptable level of accuracy (> 71% of KAPPA) and it is proposed to be applied in spatial planning and transport planning practice.
spatial planning, transport planning, spatial simulation, fractal geometry, cities, road network configuration, open-source GIS
Urban agglomeration in Cities is the outcome of its great historical evolution through expanding, clustering, and fragmenting over the period of time responding to many community-induced and resource-led driving forces [1]. This integrated nature of city clusters is referred as urban agglomeration (urban agglomeration) [2, 3]. Many scholars have continuingly attempted to comprehend the pattern of urban agglomeration and its spatial evolution since the 1880s [4] as it evolves as a major study area in the domains of the spatial planning, urban economics and geography. In the context of spatial planning, the identification of the urban agglomeration pattern is vital in many aspects, particularly in explaining the evolutionary process of cities and their functional behaviour over the space [5, 6].
This knowledge is important when developing the local, regional, and master plans, as it helps to identify the existing growth directions, future urbanizing scenarios, and potential developable areas [2, 7]. It also supports to strategically control the undesirable sprawling effects including environmental degradations [3, 8]. The urban agglomeration pattern helps in delineating the urban growth boundaries and it is essential for the demographic, transport, and land use planning contexts [9]. Hence, the ability of comprehending the pattern of urban agglomeration enables policy makers, practitioners and decision-makers in planning and shaping the future urbanizing scenarios in a more effective and productive manner, with deep insights into sustainable urban development [10].
In the modern urban planning literature, the concept of urban agglomeration was introduced by the British urban planner Ebenezer Howard in early 1898, in his remarkable book called ‘Garden Cities of Tomorrow’ [4]. In his literature, Ebenezer Howard referred the term ‘urban agglomeration’ to the integrated nature of spatial organization [4]. In 1915, Patrick Geddes recognized ‘urban agglomeration’ as a phenomenon for the potential urban and population development [11], as it concentrates the economic activities, resources and transportation mobility which subsequently create an appropriate environment for urban development. In 1933, Walter Christaller proposed a systematic interpretation to the term ‘urban agglomeration’ under his outstanding exploration of central place theory [12]. Christaller noted that the urban agglomeration has its highest concentration towards the centre of the city, due to the potentials of scale of economies and transportation accessibility and concentration gradually diffuses towards the peripheries in a specific hierarchical order. This understanding of the urban agglomeration pattern later opened a new pathway to an advanced mathematical and physical interpretation of urban agglomeration in latter studies [13]. Since the beginning of the 19th century, many scholars have been curious in hypothesizing the pattern of urban agglomeration, as it provides clear insights into comprehending the evolutionary process of the spatial forms of cities [14]. Hence, there have been an abundance of proposed applications which were evolved from the classic demographic definitions to complex fractal studies of urban agglomeration.
In 1931, Fawcett (cited by [2]) introduced an administrative boundary- based classification to define urban agglomeration but was severely criticized by John Friedmann and Weber who stated, “Every city does not perform the same cognitive interpretation of urban agglomeration as they differ from the administrative demarcations, population concentration, economy and services” [15, 16]. In order to mitigate such limitations, Zipf applied the Gravity Model to explain urban agglomeration [17]. The model was based on the law of gravitation and utilized the gravity intensity analogues to multiple urban characteristics, (i.e., demographic behaviours, employments, economic activities and movement patters), that represent urban agglomeration [18, 19]. However, the model showed a major limitation in model estimation, as it does not encounter the relative nature of the factors behind the process of urban agglomeration [20]. This severely affected the model accuracy when evaluating the urban agglomeration, particularly of complex urban forms including urban conurbations [21]. The network centrality assessment method, which was evolved from the graph theory, has been extremely successful [19, 22, 23] in capturing the dynamics of the urban agglomeration as attempted by several scholars [7, 20]. Even though the network centrality method captures the relative intensity of urban agglomerations, the method is yet to be developed to represent the clustered interpretation of the urban agglomeration [24]. Also, it is bounded to a given threshold distance which could compute the intensity of agglomeration through a nodal interpretation but has no facility to model its actual expanse [20]. In domain of remote sensing, in order to capture the expanse of the urban agglomeration, Weber [16] introduced a satellite-image processing approach as a constraints-free and globally applicable method [25]. This method was initially lacking in the applicability in the resource-constrained contexts due to lack of access to satellite imagery data with high accuracy [26, 27]. There have been several technological enhancements proposed to improve the applicability of the method [25]. In the latter part of this study, the Satellite Imagery Urban Area Classification will be utilized in validating the proposed model, as it is currently considered as an acceptable measure for depicting the intensity and expanse of the urban agglomeration correspondent to the time when the image was captured [26]. The key limitation of the method is that though the satellite image interpretation can detect the past and existing boundaries of urban expanse yet not much useful in modelling the future as it does not explain the internal factors behind the process of the urban agglomeration [26, 28].
Considering the above-discussed applications and their limitations, it can be concluded that despites many efforts, modelling the spatial patterns of urban agglomeration is constrained with many practical, technical and theoretical limitations. In such a context, this study attempts to develop a modelling approach that can overcome the following four limitations noted in the previous research. First, the study devised a constraints-free modelling framework that can be universally applicable for the urban agglomeration assessment within any geographical regions. Secondly, the model can distinguish the existing level of urban agglomeration and forecast the future trends under different development scenarios. Thirdly, the model identifies each agglomerated cluster separately by its correspondent functional boundaries. It is important to study the growth of each urban cluster and its spatial interactions. Fourthly, unlike other modelling approaches, the proposed model can be applied to a study of any scale from a small neighbourhood to a large region.
In such a context, this study proposes a novel modeling approach to distinguish the urban agglomeration pattern. The proposed model based The theoretical framework of the model is co-evolved from the network centrality [29, 30], percolation theory [31, 24] and fractal geometry [32-34].
This study provides a radical interpretation for the unique urban agglomeration pattern of Sri Lanka and reveals the magnitude of present and future urban agglomeration trend patterns including medium and small-scale towns.
The paper is organized into five major sections described as follows: Section 2 presents the conceptual framework of the model. A brief discussion regarding each model component is presented in the model conceptual framework. The study area, data description, methodology and model formulation are presented in the section 3. Model application, analysis and model validation are discussed in the section 4. Finally, the conclusion and recommendations of the study are presented in section 5.
The iCN Model includes three major components, which are transport network configuration, percolation theory and fractal geometry. The proposed model uses road network as proxy to represent the urban agglomeration pattern spatially and utilized the percolation theory to generate the agglomerated clusters. For generalization and calibrating purposes of the model results, the study utilized fractal geometry. A brief discussion regarding each model component is presented in the following sections.
2.1 Percolation theory and its characteristics
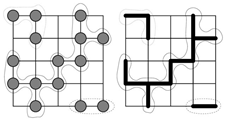
In its basic terms, percolation theory defines the behaviour of a cluster in an infinite graph or a lattice [35]. As shown in Figure 1, the percolation clusters evolve as a bond or a sites percolation based on the open edges or occupying neighbouring cells of the lattice [34, 36].
Figure 1. Bond percolation (left) and the site percolation (right) clusters in a square lattice [33]
In the spatial planning context, the percolation theory is acknowledged as an agglomeration process of development potentials through the accessibility [37] and transportation proximity [24]. In such a context, percolation clusters may occur considering the locational accessibility of cities or road intersections which are potentials to aggregate the development. Therefore, this study utilized the percolation theory under the road intersection points, to identify the city clusters which denote urban agglomeration. Ultimately, these percolated clusters may reveal the urban agglomeration pattern corresponding to the higher accessibility and locational proximity to each intersection points in the study area.
In order to perform the percolation analysis, the study utilized DBSCAN algorithm [38, 39]. Density-Based Spatial Clusterin g of Application with Noise, (i.e.,DBSCAN) algorithm is an unsupervised machine learning algorithm which generates density clusters based on the Euclidian distance to each identical nodes of the network. The most important advantage of the DBSCAN Algorithm when compared to other unsupervised and supervised clustering algorithms, (i.e. K-Means, Hierarchical Clustering respectively) is its ability to carry out the cluster analysis according to the given threshold distance without any user preference, (i.e. number of clusters is decided by the algorithm) [40]. This clearly reflects the natural process of urban agglomeration, which appears in the urban clusters according to the accessibility and locational proximity. Another benefit of the algorithm is its ability to represent the percolated clusters separately by their respective cluster ID, which helps to identify each cluster spatial distribution and cluster significance.
As mentioned above, the study utilized the road intersection points to perform the cluster algorithm. Applicability of the road network to measure the urban agglomeration pattern will be discussed next.
2.2 Characteristics of the road network
Transportation network is ubiquitous in the modern urban development [3, 41]. Batty [29] identified the inherent relationship between the road network and historical evolution of cities as he mentioned that “the road network essentially contains the social, economic and cultural history of its space”. Additionally, the modern development pattern of a city is firmly linked with the infrastructure development; hence this economic development is reflected by the street network configuration [5, 22, 23]. It indicates the level of urban agglomeration of a city by the aspects of economic prosperity which is clearly denoted by the evolution of road network [42]. Also, Hiller identified a strong relationship between the road network configuration and urban agglomeration as he mentioned that higher integrated places are potentials for the rapid urban agglomeration as they have a higher choice and integration compared to the other locations [30, 43, 44]. Moreover, the study considered road intersection points for the proposed percolation calculation, which are considered as the primary indicators of the interaction and urban agglomeration [24].
Considering the above-mentioned characteristics, it utilized the road network as proxy to measure the urban agglomeration under the proposed iCN model. To calibrate the model results with the existing urban agglomeration pattern, the model utilized fractal geometry. Characteristics of the fractal geometry are discussed in the next section.
2.3 Fractal geometry and delineation of the existing urban agglomeration pattern
Fractal Dimension [45] is the urban morphological analytic method which was developed by the Mandelbrot [32]. It helps to distinguish the statistical and morphological similarities of spatial patterns and physical phenomenon [32]. Arcaute et al. [24] identified that urban and rural street network patterns represent clear morphological segregation that could be accurately measured by fractal geometry. Arcaute et al. [2] denoted that after the road network reached its maximum self-similarity level, the fractal value tends to decrease. Therefore, it calculates fractal value of the road network at each percolation cluster threshold distance as the maximum self-similarity percolation cluster as depicted in the existing urban agglomeration.
In order to calculate the fractal value, the study utilized the Box-Counting Dimension method, i.e., Minkowski–Bouligand dimension [46]. It considered the study area as an evenly distributed gridded mesh and calculated the occupancy of the road network of each cluster by counting the number of boxes covered by the particular road network. It changed the box size by shrinking the grid over the given number of iterations in order to calculate the magnitude of the fractal value. Then, it calculated the fractal dimension by applying the box counting algorithm [46].
D=log(N)log(r) (1)
where, D is fractal dimension, log(N) is number of boxes which covered the pattern, log(r) is magnification or the inverse of the box size.
Based on the conceptual framework, the study explains the iCN model formulation in the following section.
3.1 Study area
Sri Lanka, which is located in South Asia was selected as the study area, taking two major reasons into account. First, Sri Lanka is an Island, hence there are no physical linkages from outside the country. Therefore, it can clearly distinguish the agglomeration pattern which is represented by the entire country itself. Second, in terms of the administrative urban agglomeration classification, no study has been carried out to assess the urban agglomeration pattern of the country. Accordingly, the findings of the study will provide a rational insight to the country’s future development. Figure 2 depicts the basic characteristics of Sri Lanka.
Figure 2. Basic characteristics of study area
3.2 Data description and sources
The data used for the study is presented in Table 1. The road network utilized for the model development and satellite imagery data have been used for model validation purposes.
3.3 Methodology
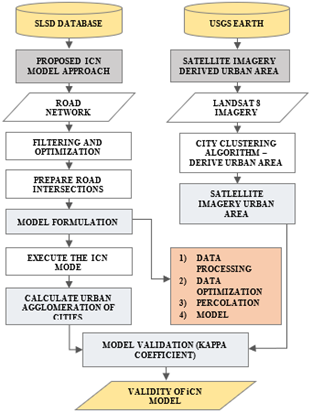
The overall method of the study is presented in Figure 3. The methodology comprises two major tasks: I. To calculate the urban agglomeration pattern using the proposed iCN Model. II. To validate the model utilizing satellite imagery classified urban area.
As mentioned in the methodology, the iCN Model comprised with four major analytical stages. The detailed steps of the model formulation are presented as follows:
3.4 The iCN model formulation
The iCN Model formulation is predominantly based on the free and open-source applications. Thus, it is effective to be implemented by any developing or underdeveloped country. The entire model is built solely upon the QGIS Software with several third-party applications, which are freely available in QGIS Plugin repositories and GRASS GIS Plugin repositories. The model contains four major stages identified as - I. Data Pre-processing Stage, II. Data Processing Stage, III. Clustering Stage and IV. Calibrating stage.
The Data pre-processing stage contains the initial data cleaning steps of the model. In general, the digitized road network contains missing values, islands and isolated segments. These cause to decline the simulation accuracy of the model. Thus, the model utilized a very powerful data cleaning algorithm, V.CLEAN.plugin (GRASS GIS) to clean the road network. Then, it was required to repair and slice the road network into segments in order to generate the intersection points, (i.e., vertices). Hence, it utilized the sDNA-Prepare Network Tool (QGIS Plugin repositories).
Figure 3. Method of study
Table 1. The Data description
|
Data Type |
Area |
Year |
Source |
Description |
|
Transportation Network |
Entire Sri Lanka |
2012 |
Sri Lanka Survey Department (SLSD) |
GIS Data: Road centerlines as polylines Attributes: Road Type |
|
Satellite Imagery |
Colombo Metropolitan Area Galle District |
2012 |
USGS Earth Explorer |
Remote Sensing Data: Raster Format: 12 Bands Including (RGB) |
Figure 4. Analytical framework of the iCN model
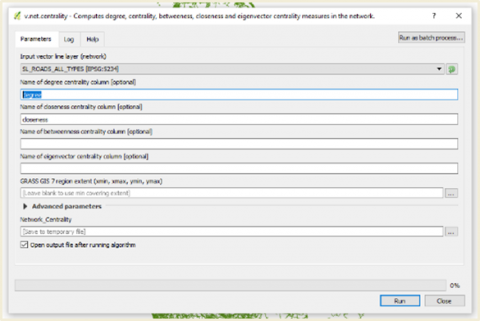
In the Data processing stage, the model generates road intersection points from the road segments, by utilizing the AequilibraE.plugin (QGIS Plugin repositories). For the data optimization purpose, the model follows the Degree Centrality v.net.centrality plugin (GRASS GIS). This is optional for small data sets. At the Percolation (clustering) stage, the model implements the clustering algorithm by utilizing the DBSCAN algorithm of the QGIS plugin repository.
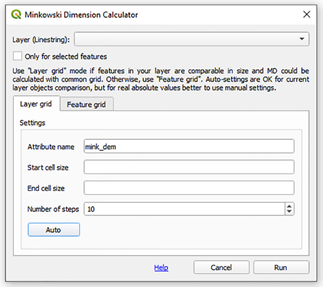
Afterwards, under the calibrating stage, the model calculates the Factual Geometry of the emerged clusters under each threshold distance. It identifies the highest self-similarity distribution of the emerged cluster as the existing urban agglomeration level. The model calculates the fractal value as the mono fractal dimension, which is obtained through the box counting algorithm by using Minkowski Dimension Calculator plugin (QGiS Plugin repositories).
Figure 4 presents the analytical framework of the iCN Model. Since the model derive urban clusters as the interconnected network of road intersections, the model named as iCN model and "i" used to represent the road intersections as it becomes the proxy to urban agglomeration.
In the next section, the study will implement the iCN Model and assess the urban agglomeration pattern of Sri Lanka.
4.1 Implemented iCN Model and the Calculated Urban Agglomeration Pattern
In order to assess the urban agglomeration pattern first, it is required to pre-process the data according to the model analytical framework. The original dataset contained 131,473 road intersections covering the entire Island, but for computational purposes, the dataset size was optimized by following the Degree Centrality data optimization method and the centrality values below 3.40 were removed (Figure 5), as it contained islands and missing segments Also, road roundabouts were considered as single nodes. Finally, after the data pre-processing, it only contained 89,367 road intersections covering the entire study area.
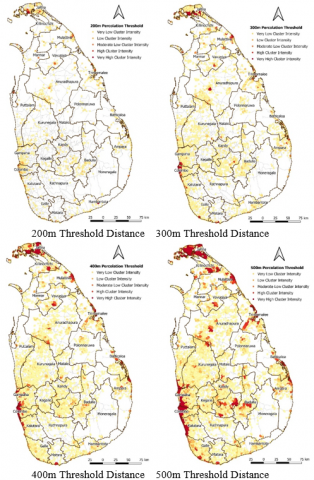
Afterwards, the clustering algorithm of the iCN model was initiated (refer Figure 6). For the percolation threshold distance, (i.e. minimum distance between two identical points) a series of radius values were applied starting from 50m to the critical percolation threshold where it completes the entire clustering process. This helps to capture the urban agglomeration pattern in the most accurate manner. The study did not consider the minimum cluster size to prepare the percolation clusters, as it was required to identify all the original clusters in order to measure the urban agglomeration pattern. Figure 7 depicts the results obtained from the iCN model for the selected threshold distances.
4.2 Calibrate Model Result and obtaining the Existing Urban Agglomeration Pattern
In order to obtain the Existing urban agglomeration Pattern, the model calculated the fractal dimension of percolation clusters (refer Figure 8). For this purpose, the study selected clusters which were emerged in between a 200m to 500m threshold distance, considering two hypotheses: I. the minor level percolation clusters underestimate the actual scale of the urban agglomeration. II. On the other hand, it overestimates the model result when it exceeds the appropriate level of the threshold distance. The model automatically decides on the starting and ending cell size of the clusters in the fractal calculation, in order to minimize the human bias; and it always limits the number of iterations to 30 rounds. In order to have an equal estimation, the study followed the Layer Grid Estimation Method as the entire study area was considered as a single mesh.
Figure 5. Calculating the degree centrality
Figure 6. Application of DBSCAN Tool and derived the urban clusters
Figure 7. iCN Model result for the selected threshold distances
Figure 8. Calculating the fractal dimension of the percolation clusters
Figure 9. Fractal dimension distribution at each distance threshold, (minimum cluster size = 200 meter)
Figure 10. Urban agglomeration pattern of 2012 according to the iCN Model
According to the model result, the maximum distribution of fractal dimension was recorded at the 425-meter TD, which is depicted in the Figure 9. Therefore, urban agglomeration pattern for the year 2012 according to the iCN Model is classified at the distance threshold of 425m and is presented in Figure 10.
Considering the model derived from the existing urban agglomeration pattern of Sri Lanka, it clearly identified that the cities Colombo and Jaffna emerged as the highest urban agglomerated areas and the corresponding agglomeration trend developed towards the surrounding peripheral areas through the transportation accessibility. This is clearly depicted in the western province urban agglomeration pattern (refer Figure 11) as it lays the agglomeration trend upon the major transportation linkages.
Afterwards, the study calculated the model accuracy with satellite imagery classified urban agglomeration area and evaluated the model validity.
Figure 11. Western Province urban agglomeration Pattern According to the iCN Model, (425-meter TD)
4.3 Empirical Validation of the iCN Model
In order to identify the model applicability in the real ground scenarios, the study empirically tested the model result. Hence, it compared the model predicted urban agglomeration pattern with the satellite imagery classified urban areas in several cities.
It is very clear that the model derived urban clusters are very similar to the satellite imagery classified urban areas (refer Figure 12). The most significant advantage of the iCN Model is its capability of identifying each city cluster separately with their cluster significance, while the satellite imagery merely represents the urban area visually. This is extremely helpful when identifying the spatial evolution and interactions of cities. It also denotes the fragile cities and urban development trend patterns which are essential knowledge for the sustainable urban and transportation planning practice.
Although, both findings are derived similar outcome, it also noticed several numbers of unequal patches as well. This clearly emphasise the importance of the iCN model rather it derived the agglomerated clusters from the satellite imagery. Usually, satellite imagery provides visual interpretation of the urban area. This caused to mislead due to the cloud cover and false reflection values of the imagery as it recognized same reflection values as one category. Therefore, it overestimates the urban area. However, iCN model only capture the urban clusters according to the Euclidian distances between nodes and avoid the data misinterpretations.
Figure 12. Comparison of Satellite Imagery Classified Urban Area and iCN Model Derived Urban Clusters
Therefore, according to the empirical validation of the iCN model, it can be clearly asserted that the proposed method provides a clear visual interpretation of the urban agglomeration pattern.
4.4 KAPPA coefficient calculation and model validation
In order to evaluate the model validity, the study calculated the KAPPA estimation [47]. KAPPA estimation measures the agreement between two rater cells with respect to a dichotomous outcome [48]. Hence, the study classified each raster cells in to two major classes, (i.e. “1” represent urban agglomeration area and “0” represent other) by considering the occupancy of the urban agglomeration in each raster cell. Afterwards, it statistically compare the iCN model result and measure the accuracy compares to the satellite imagery classified urban agglomeration area.
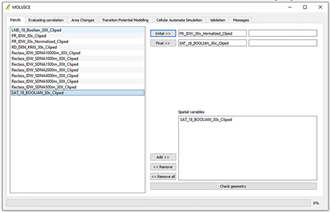
It selected the Colombo Metropolitan Area (CMA) which is considered the major urban agglomeration in Sri Lanka, for the model validation. The study calculated KAPPA coefficient under the MOLUSCE plugin [47] in the QGIS software (refer Figure 13). For the model validation, the study utilized Satellite Imagery Classified Urban Area Map 2012 as the Reference Map and the iCN Model Predicted urban agglomeration Area Map for the year 2012 as the Simulated Map and estimated the model validity under 5 iterations. The results are presented in Figure 14.
Figure 13. Calculating the KAPPA coefficient under the MOLUSCE Plugin
The KAPPA estimation result shows significant accuracy (KAPPA > 71%) of the model. The locational accessibility of the intersection areas and their proximity to other locations point out that with higher accessibility, there is greater the potential for development, similarly to urban agglomeration. However, as mentioned before, the satellite imagery does not provide a precise picture of the urban agglomeration. Hence, the accuracy of the iCN model may vary with the quality of the satellite imagery and the occupied city cluster algorithm.
Figure 14. KAPPA Coefficient Calculation Result
4.5 Forecast future urban agglomeration pattern
The study validated the existing urban agglomeration threshold distance of Sri Lankan cities; thus, it can forecast the future possible urban agglomeration pattern of the study area by increasing the corresponding threshold distance of a given percolation cluster until it reaches the critical percolation threshold.
This represents the future urban agglomeration under the business-as-usual scenario if the road network will not undergo a change. In the reality, road networks undergo many changes thus urban clusters will also getting evolved according to the increasing threshold distance. Hence, although the existing model reached to its maximum self-similarity at 425m, in the future scenario it will increase the self-similarity and the corresponding threshold distance according the expansion of the road network. For the purpose of study, it was assumed that the threshold level might be extends to different threshold limits varying from 750 m to 2000 m. Under the highest threshold-distance scenario, the future urban development was revealed as a giant urban cluster. This can clearly represent by increasing the threshold distance of the percolation clusters as the cluster evolve it denotes the future agglomeration pattern (refer Figure 15) until it each to the giant urban cluster.
With reference to Sri Lanka, it is noticeably clear that the potential agglomeration trend is emerging from the western region and subsequently evolving over the entire island. Some blank areas are clearly visible in the maps, which depict the forests areas and water bodies which could be remined though many have been disappeared fully or partially. Thus, the study provides a deep insight the possible threat of increasing the urban agglomeration over sensitive ecosystems under the business-as-usual scenario.
Figure 15. Future urban agglomeration pattern according to the iCN Model
Although, the model is capable to depict the future possible urban agglomeration pattern according to the proposed road network, the proposed developments are subjected to its inherent uncertainties. It is also important to note that the the threshold limits of percolation distance and fractal geometry values that the study utilized are not universal; rather locally characterized depend upon the trip length and movement patterns.
The study proposed a novel modelling approach to devise the urban agglomeration pattern of cities based on the road network configuration, percolation theory and fractal geometry; and shed a light on the existing theories that explains the road network as inherently interlinked with the spatial development pattern of cities. Thus, it can be denoted the urban agglomeration pattern through the fractal nature of the road structure. In order to identify the existing pattern of urban agglomeration, the model applied the percolation theory on the road intersections to measure the maximum self-similarity distribution of the corresponding clusters. The results revealed that the urban agglomeration pattern derived from the iCN model excellently corresponds with the satellite imagery derived urban agglomeration pattern. Hence, the iCN model denotes excellent accuracy in measuring the urban agglomeration pattern with more than 71% of KAPPA accuracy and it proposes an applicable approach to forecast the future urban agglomeration patterns based on the fractal nature of the transportation system.
Considering the model performance, the iCN model is capable of forecasting the future urban agglomeration patterns under different development scenarios. It is also capable of identifying each urban cluster distinctly. It is especially important for studies related to urban growth and also for analysing the spatial interactions of cities. Additionally, this model denotes the scaling nature of cities via the cluster significance, (i.e., occupancy of nodes in a cluster) and the corresponding knowledge would be essential for the city hierarchy assessments and urban allometry studies.
The results revealed that the level of urban agglomeration is precisely reflected through the road network as the higher the centrality greater the potential for urban agglomeration. Satellite imagery approach only provides the visual interpretation for the urban agglomeration. Nevertheless, iCN model provides an excellent theoretical interpretation for the finding as it follows the configuration and dynamics of road infrastructure network in capturing the urban agglomeration. Moreover, iCN model provides universal and cost effective approach to assess the urban agglomeration pattern in existing and future development scenarios. Therefore, iCN model provides deep insights into the urban simulation studies and it would be useful as an essential tool for urban and transport planning.
5.1 Recommendations, limitations and future research interest
It is widely discussed that the current administrative and satellite-based approaches are incomplete in capturing the actual urban agglomeration pattern and their dynamic urban nature. The iCN model provides a rational framework to redefine the urban agglomeration of cities. Nevertheless, the iCN model does not demand country-specific socio-economic attributes such as demographic data or census records. Hence, the model is universally applicable at any geographical regions for urban agglomeration assessment and forecasting future development trends.
In the domain of the spatial planning practice, urban simulation tools are essential to forecast future urban development trends; comprehend the patterns; and to strategically intervene negative growth scenarios such as the urban sprawl effect. The iCN model denotes the agglomerated areas and segregated areas precisely and spatially. Thus, it helps to enhance the possible spatial integrations of these areas in the future planning practices. Moreover, the study acknowledges the urbanizing pressure upon the vulnerable and environmental sensitive areas which will eventually support decision-makers to take precautionary actions and lead the future development trends toward a more environmentally sustainable direction.
Considering the limitations of the study, the iCN model is currently based on a single attribute, (i.e., road network) to define the urban agglomeration. It may cause to reduce the model accuracy. Several studies in the domain of network centrality studies have incorporated multiple factors in improving the modelling accuracy. Future attempts are required to be focused on improving the prediction accuracy through multiple factors without compromising the universal applicability and data-free nature of the iCN model.
For future research interest, it is required to study the fractal nature of cities, since the study identified a very strong relationship between the urban morphology change of street network and scales of the cities. Also, it is required to develop a new algorithm to convert the agglomerated clusters into a vector format in order to calculate the size and shape of the urban clusters, as the existing situation model derived the urban agglomeration pattern as an interconnected network of nodes.
[1] Cottineau, C., Finance, O., Hatna, E., Elsa, A., Batty, M. (2019). Defining urban clusters. Urban Analytics and City Science, 46(9): 1611-1626. https://doi.org/10.1177/2399808318755146
[2] Fang, C., Yu, D. (2017). Urban agglomeration: An evolving concept of an emerging phenomenon. Landscape and Urban Planning, 162: 126-136. https://doi.org/10.1016/j.landurbplan.2017.02.014
[3] Yang, Z., He, X., Zhang, K., Zhang, J. (2020). Sustainable urban space expansion in Central Yunnan (China): Regional urban integration. International Journal of Sustainable Development and Planning, 15(1): 95-106. https://doi.org/10.2495/SDP-V15-N1-95-106
[4] Ebenezer, H. (1902). Garden Cities of Tomorrow. London. London: Swan Sonnenschein & Co.
[5] Xiao, Y., Orford, S., Webster, C.J. (2015). Urban configuration, accessibility, and property prices: A case study of Cardiff, Wales. Environment and Planning B: Planning and Design, 43(1): 108-129. https://doi.org/10.1177/0265813515600120
[6] Loibl, W., Etminan, G., Gebetsroither-Geringer, E., Neumann, H.M., Sanchez-Guzman, S. (2018). Characteristics of urban agglomerations in different continents: History, patterns, dynamics, drivers and trends. In Urban Agglomeration, pp. 29-63. https://doi.org/10.5772/intechopen.73524
[7] Jayasinghe, A.B., Munasinghe, J. (2012). A study of the urbanizing pattern in Kegalle District, Sri Lanka with connectivity analysis. International Journal of Scientific Knowledge, 7-19.
[8] Deep, S., Kushwaha, S.P. (2020). Urbanization, Urban Sprawl and Environment in Dehradun. In: Gupta A., Dalei N. (eds) Energy, Environment and Globalization. Springer, Singapore. https://doi.org/10.1007/978-981-13-9310-5_10
[9] Murcio, R., Masucci, A.P., Arcaute, E., Batty, M. (2015). Multifractal to monofractal evolution of the London street network. PHYSICAL REVIEW E, 92(6): 062130. https://doi.org/10.1103/PhysRevE.92.062130
[10] Salem, M., Tsurusaki, N., Divigalpitiya, P., Osman, T., Hamdy, O., Kenawy, E. (2020). Assessing progress towards sustainable development in the urban periphery: A case of greater Cairo, Egypt. International Journal of Sustainable Development and Planning, 15(7): 971-982. https://doi.org/10.18280/ijsdp.150701
[11] Geddes, P. (1915). Cities in Evolution: An Introduction to the Town Planning Movement and to the Study of Civics. Williams & Norgate.
[12] Christaller, W. (1966). Central Places in Southern Germany. Prentice Hall.
[13] Shen, Y. (2017). Understanding Functional Urban Centrality. London: University College London.
[14] Batty, M. (2008). The size, scale, and shape of cities. Science, 319(5864): 769-771. https://doi.org/10.1126/science.1151419
[15] Friedmann, J. (1986). The world city hypothesis. Development and change. 17(1): 69-83. https://doi.org/10.1111/j.1467-7660.1986.tb00231.x
[16] Weber, C., Petropoulou, C., Hirsch, J. (2005). Urban development in the Athens metropolitan area using remote sensing data with supervised analysis and GIS. International Journal of Remote Sensing, 26(4): 785-796. https://doi.org/10.1080/01431160512331316856
[17] Zipf, G.K. (1949). Human Behavior and The Principle of Least Effort. Cambridge, MA: Addison-Wesley.
[18] Ronghui, T., Kehao, Z., Qingsong, H., Hengzhou, X. (2016). Analyzing the effects of spatial interaction among city clusters on urban growth-case of Wuhan urban agglomeration. Sustainability, 8(8): 759. https://doi.org/10.3390/su8080759
[19] Sun, Q., Wang, S., Zhang, K., Ma, F., Guo, X., Li, T. (2019). Spatial pattern of urban system based on gravity model and whole network analysis in eight urban agglomerations of China. Mathematical Problems in Engineering, 2019: 6509726. https://doi.org/10.1155/2019/6509726
[20] Hellervik, A., Nilsson, L., Andersson, C. (2019). Preferential centrality - a new measure unifying urban activity, attraction and accessibility. Environment and Planning B: Urban Analytics and City Science, 46(7): 1331-1346. https://doi.org/10.1177/2399808318812888
[21] Kincses, Á., Tóth, G. (2014). The application of gravity model in the investigation of spatial structure. Acta Polytechnica Hungarica, 11(2): 5-19. https://doi.org/10.12700/APH.11.02.2014.02.1
[22] Zhang, S. (2019). Classification of urban land use based on graph theory and geographic information system. Ingénierie des Systèmes d'Information, 24(6): 633-639. https://doi.org/10.18280/isi.240611
[23] Jayasinghe, A., Madusanka, N.B.S., Abenayake, C., Mahanama, P.K.S. (2021). A modeling framework: To analyze the relationship between accessibility, land use and densities in urban areas. Sustainability, 13: 467. https://doi.org/10.3390/su13020467
[24] Arcaute, E., Carlos, M., Erez, H., Roberto, M., Camilo, V.R., Paolo, M., Michael, B. (2016). Cities and regions in Britain through hierarchical percolation. Journal of the Royal Society Interface, 3(4). https://doi.org/10.1098/rsos.150691
[25] Fu, Y.C., Li, J.F., Weng, Q.H., Zheng, Q.M., Li, L., Dai, S., Guo, B.Y. (2019). Characterizing the spatial pattern of annual urban growth by using time series Landsat imagery. Science of The Total Environment, 666: 274-284. https://doi.org/10.1016/j.scitotenv.2019.02.178
[26] Mundhe, N.N., Jaybhaye, R.G. (2014). Impact of urbanization on land use/land covers change using Geo-spatial techniques. International Journal of Geomatics And Geosciences, 50-60.
[27] Moghadam, H.S. (2019). Improving spatial accuracy of urban growth simulation models using ensemble forecasting approaches. Computers, Environment and Urban Systems, 76: 91-100. https://doi.org/10.1016/j.compenvurbsys.2019.04.005
[28] Sinha, S. K. (2018). Application of geospatial techniques in the study of urban growth/ sprawl. International Journal of Multidisciplinary.
[29] Batty M. (2006). Hierarchy in Cities and City Systems. In: Pumain D. (eds) Hierarchy in Natural and Social Sciences. Methodos Series, vol 3. Springer, Dordrecht. https://doi.org/10.1007/1-4020-4127-6_7
[30] Vaughan, L., Hillier, B. (2007). The city as one thing. Progress in Planning, 67(3): 205-230. https://doi.org/10.1016/j.progress.2007.03.001
[31] Herega, A. (2015). Some applications of the percolation theory: Brief review of the century beginning. Journal of Materials Science and Engineering, 409-414. 10.17265/2161-6213/2015.11-12.004
[32] Mandelbrot, B.B. (1983). The fractal geometry of nature. American Journal of Physics, 51(3). https://doi.org/10.1119/1.13295
[33] Masucci, P.A., Arcaute, R., Hatna, E., Stanilov, K., Batty, M. (2015). On the problem of boundaries and scaling for urban street networks. Journal of the Royal Society Interface, 12(111): 20150763. https://doi.org/10.1098/rsif.2015.0763
[34] Piovani, D., Molinero, C., Wilson, A. (2017). Urban retail dynamics: insights from percolation theory and spatial interaction modelling. arXiv preprint arXiv. https://doi.org/10.1371/journal.pone.0185787
[35] Römer, R.A. (2002). Percolation, Renormalization and Quantum Hall Transition. In: Computational Statistical Physics. Springer, Berlin, Heidelberg. https://doi.org/10.1007/978-3-662-04804-7_17
[36] Rozenfeld, H.D., Rybski, D., Andrade, J.S., Batty, M. (2008). Laws of population growth. Proceedings of the National Academy of Sciences, 105: 18702-18707. https://doi.org/10.1073/pnas.0807435105
[37] Malik, S., Tariq, F., Awan, M.Y. (2017). Urbanization and transforming urban form of Asian cities - cases of Bangkok, Tokyo & Mumbai. International Journal of Engineering Research in Mechanical and Civil Engineering.
[38] Ester, M., Kriegel, H.P., Sander, J., Xu, X. (1996). A density-based algorithm for discovering clusters in large spatial databases with noise. 2nd International Conference on Knowledge Discovery and Data Mining, Portland: AAAI Press, pp. 226-231.
[39] Schubert, E., Sander, J., Ester, M., Kriegel, H.P., Xu, X. (2017). DBSCAN revisited, revisited: Why and how you should (still) use DBSCAN. ACM Transactions on Database Systems (TODS), 42(3): 19. https://doi.org/10.1145/3068335
[40] Wang, H., Zhou, C., Li, L. (2019). Design and application of a text clustering algorithm based on parallelized K-means clustering. Revue d'Intelligence Artificielle, 33(6): 453-460. https://doi.org/10.18280/ria.330608
[41] Piraveenan, M., Prokopenko, M., Hossain, L. (2013). Percolation centrality: Quantifying graph-theoretic impact of nodes during percolation in networks. PloS One, 8(1). https://doi.org/10.1371/journal.pone.0053095
[42] Hillier, B. (1996b). Cities as movement economies. Urban Design International, 1: 41-60. https://doi.org/10.1057/udi.1996.5
[43] Hillier, B., Leaman, A., Stansall, P., Bedford, M. (1976). Space syntax. Environment and Planning B, 3(2): 147-185. https://doi.org/10.1068/b030147
[44] Jayasinghe, A., Sano, K., Abenayake, C., Mahanama, P. (2019). A novel approach to model traffic on road segments of large-scale urban road networks. MethodsX, 6: 1147-1163. https://doi.org/10.1016/j.mex.2019.04.024
[45] Imre, A.R., Jan, B. (2006). The Minkowski-Bouligand dimension and the interior-to-edge ratio of habitats. Fractals, 14(1): 49-53. https://doi.org/10.1142/S0218348X06003027
[46] Falconer, K. (2004). Fractal Geometry: Mathematical Foundations and Applications. John Wiley & Sons. https://doi.org/10.1002/0470013850
[47] Ahmed, B., Raquib, A., Xuan, Z. (2013). Evaluation of model validation techniques in land cover dynamics. ISPRS International Journal of Geo-Information, 2(3): 578-597. https://doi.org/10.3390/ijgi2030577
[48] Gismondi, M., Kamusoko, C., Furuya, T., Tomimura, S., Maya, M. (2014). MOLUSCE-An Open Source Land Use Change Analyst for QGIS. http://2013.foss4g.org/conf/programme/presentations/107/