Arun Nagarkatti* | Ajit Kumar Kolar
© 2021 IIETA. This article is published by IIETA and is licensed under the CC BY 4.0 license (http://creativecommons.org/licenses/by/4.0/).
OPEN ACCESS
The use of coal will continue to meet the power demands for the next few decades in India. In this paper, the quantitative number called sustainability index (SI) for coal power plants is estimated on a life cycle basis by using a sequential combination of Analytic Hierarchy Process and Technique for Order of Preference by Similarity to Ideal Solution. Coal-based power plants along with gas, nuclear, hydro, solar photovoltaic, wind, and biomass-based power generation technologies are considered. The SI is estimated considering five dimensions of an energy system, namely, resource, energy, environment, economic and social, and fourteen criteria under these dimensions. A brief life cycle analysis of coal power plants is carried out to quantify all the fourteen criteria. The results show that the coal power plant ranks last among seven power plants and hence, SI has to be improved by using Advanced Coal Technologies (ACT). The development of indigenous ACT will increase efficiency, energy security, and decrease resource consumption as well as emissions. Further, the development of indigenous Carbon Capture Systems will avoid the CO2 emissions from the power plants. This study will help policymakers in developing a technology roadmap for optimal energy-mix in the country
Indian coal power plants, life cycle assessment, analytic hierarchy process, technique for order of preference by similarity to ideal solution, multi-criteria decision making, sustainability index, advanced coal technologies
In modern society, electricity has become an essential part of our life. Electricity is required for the country’s economic growth and sustainable development. United Nations Development Programme (UNDP) has set 17 Sustainable Development Goals (SDGs) which came into effect in 2016 [1]. These SDGs aim to protect the earth and ensure the well-being of all the people. The 7th goal of SDGs refers to clean and affordable energy. The frequently quoted definition for sustainable development is from the Brundtland Report published in 1987, which states “Sustainable development is a development that meets the needs of the present without compromising the ability of future generations to meet their own needs” [2]. The real sustainability is ensuring electricity access to all. In April 2018, India has declared that 100% of the villages are electrified [3]. As per the Government of India (GoI) definition of village electrification, a village is considered as electrified if at least 10% of the households and all the public places in the village are electrified. But there are at least 100 million people in a rural area who do not have access to electricity.
An energy system should be assessed on a life cycle basis, which includes both energy source and technology. A sustainable energy system must qualify 5 A requirements, i.e., Accessibility, Availability, Acceptability, Affordability, and Assurance. These 5 A requirements lead to the selection of dimensions of the sustainability matrix in the present study. These dimensions are resources, energy, environment, economic, and social. It is important to assess sustainability quantitatively rather than providing qualitative statements. In this paper, efforts are made to develop a quantitative number for the sustainability of power generation systems. This study will be useful for the policymakers, academicians, industrialists, environmentalists, and other stakeholders for the selection of appropriate technology for power generation. In order to provide electricity to all and meet the ever-increasing demand for energy, new power generation systems have to be installed. This will help to build a sustainable power generation roadmap for the nation.
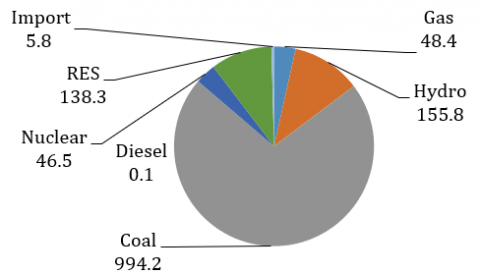
In India, electricity is produced from multiple energy sources. These include coal, oil, gas, nuclear, large hydro, and renewable (solar, wind, small hydro, and biomass) energy sources (RES). As per the Central Electricity Authority (CEA), the total installed capacity in India is 370,107 MW as of 31.03.2020 [3]. Figure 1 shows the installed capacity of various power generation systems. Figure 2 shows the electricity generated from various power generation sources during 2019-20. The total electricity generated is about 1389 billion kWh [3]. The per capita electricity consumption in India is about 1,122 kWh in 2016-17 [3] whereas the world’s per capita electricity consumption as given by International Energy Agency (IEA) was about 3,110 kWh during the same period [4]. This means India’s per capita electricity consumption is just 36% of the world’s average. The share of electricity from coal power plants in India is about 72.8%. Even though the installed capacity is about 56.4%, about just less than 3/4th of the total electricity is generated from coal-based power plants. Coal-based power plants play a significant role in the Indian Energy sector. Coal-based power plants are the backbone for the Indian power sector and this trend will continue in the coming decades. Hence, it is important to study the sustainability of coal-based power plants in India.
Figure 1. Source wise installed capacity (in MW)
Figure 2. Source wise power generation (in billion kWh)
India has abundant coal resources but there is a limited supply of oil and gas. It is estimated that there are 315 billion tonnes of coal available in India, of which 143 billion tonnes are proven. The total domestic coal production was about 676.48 million tonnes (MT) during 2017-18 [5]. As per the World Coal Association (WCA), India ranks second in the production of coal in the world in the year 2016, while first place was occupied by China [6]. The Press Information Bureau (PIB) has published that India imported coal about 208 MT majorly from Indonesia, South Africa, and Australia during 2017-18 [7].
The average gross calorific value of domestic coal is low and they are in the range of 13-17 MJ/kg. Domestic coal has a low carbon content of about 30 – 40% and a high ash content of about 35 – 45%. These two properties make Indian coal a low grade. But the domestic coal is of high quality as this contains less than half a percentage of sulphur. India is importing high-grade coal having a calorific value of 23-25 MJ/kg from various countries.
In India, there are about 191 coal-based power stations as of 31.03.2018 [3]. Currently, more than three fourth of installed capacity is subcritical power plants having typical steam parameters as 166.7 bar/537℃/537℃. All the recent installations in the country are supercritical coal power plants. Typical steam parameters of National Thermal Power Corporation (NTPC) supercritical power plants are 242.2 bar/ 537℃/ 565℃ [8]. The national plant load factor (PLF) for coal-based power plants was about 60.72% during 2017-18 [3] and the average PLF of NTPC coal-based power plants was 78.87% during the same time [3]. One of the biggest advantages of coal-based power plants is that they have a high Energy Return on Investment (EROI). The typical EROI of coal power plants ranges from 30-35 and it ranks third, while nuclear and hydropower plants occupy first and second places respectively. On the other hand, coal-based power plants are the highest point-source emitter of CO2. As per the CEA report, the weighted average specific emissions for coal-based power plants were 970 g CO2/kWh during 2017-18 [3]. It is estimated in the same report that the total emissions from the Indian power sector were about 922 MT CO2. The emissions from Mundra Ultra Mega Power Plants are as low as 810 g CO2/kWh. Some of the old power plants emit more than 1,240 g CO2/kWh. The other pollutants from coal power plants are NOx, SOx, particulate matter, and traces of mercury. These emissions are harmful to human beings as well as to the environment. The pollutants from the coal power plants should be reduced to minimize the externalities caused by coal-based power plants.
Few studies are available on Life Cycle Analysis (LCA) of Indian coal power plants. Agrawal et al. [9] assessed life cycle greenhouse gas (GHG) emissions from the coal-based power plant (1200 MW) in India using imported coal. Authors have neglected about construction and decommissioning phase, and have considered only the operation phase. The study is limited to GHG emissions and other aspects like water consumption, land usage, energy return on investment, economic, and social aspects are not considered. Even the recent study by Mallapragada et al. [10] is limited to life cycle GHG emissions from the Indian coal-based power plant.
Regarding the methodology for sustainability assessment, Wang et al. [11] reviewed Multi-Criteria Decision Making (MCDM) methods at four stages for a sustainable energy system. These four stages were the selection of criteria, assigning weights to the criteria, evaluation of the criteria, and aggregation. The criteria for energy systems were selected from the technical, environmental, economic, and social dimensions. Wang et al. listed and explained various weighting methods (equal weights, subjective, objective and combination weighting) for assigning weights to the criteria. They have also explained different MCDM methods available in the literature. The aggregation step is required when various MCDM methods yield multiple solutions for prioritizing alternatives. Kumar et al. [12] recently reviewed multi-criteria decision making (MCDM) methods for sustainable renewable energy development.
Subramanian and Ramanathan [13] reviewed 291 peer-reviewed articles on applications of the AHP in operation management. The AHP was proposed by Saaty in 1980 [14]. Application of AHP also included in the evaluation of energy systems. Assigning weights is usually subjective. The AHP is a highly structured method and reduces subjectivity by making a pairwise comparison. Behzadian et al. [15] reviewed 269 articles on the application of the TOPSIS method, a MCDM method used to evaluate, assess and rank alternatives. TOPSIS was proposed by Hwang and Yoon in the year 1981 [16]. About 14 scholarly papers were published in the field of energy management since the year 2000.
Further, many studies are available on the sustainability of power generation systems. Chatzimouratidis and Pilavachi [17] estimated ten power plants based on economic & technological, and sustainable aspects using scoring for indicators from the database and the AHP method.
The results show that the renewable energy power systems perform better. Stein [18] has ranked the power generation system in the United States using software called Super Decisions, which is based on AHP. Xu et al. [19] evaluated four 600 MW coal-based power plants in China using the Analytic Hierarchy Process (AHP) and Grey Relational Analysis (GRA) for evaluation of power plants. The results show that the power plants with better environmental indicators have performed better. Campos-Guzmán et al. [20] reviewed approaches for the sustainability analysis of renewable energy systems. About 171 articles were studied, of which only 16 articles were based on LCA and MCDM method for sustainability analysis. The authors concluded that the combination of LCA and MCDM method was found to be the best tool for sustainability analysis. Further, the combination of LCA and AHP was used most frequently due to its simplicity and robustness for sustainability analysis. Also, results showed that there are no studies regarding the combination of LCA and MCDM from India.
From the literature review, it can be seen that the estimation of sustainability index has many ways. These sustainability indices are dependent on many factors. These are data-specific, stakeholder specific, region-specific, method-specific, and so on. Also, there are limited studies on LCA based sustainability analysis of coal power plants in the literature. Further, there are minimal studies on India specific sustainability assessment of power generation systems in the literature. Hence, to bridge this gap the present study is carried out. For the first time, the LCA of Indian coal power plants is carried out considering raw materials, water, land, energy, economics, emissions, and waste generated.
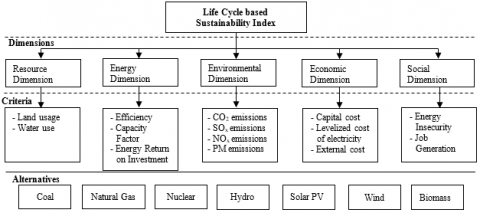
In this paper, the sustainability index (SI) is estimated on a life cycle basis with the aid of the Analytic Hierarchy Process (AHP) and Technique for Order of Preference by Similarity to Ideal Solution (TOPSIS). Figure 3 outlines the overall framework of the present study.
Figure 3. Overall framework of the present study to estimate the Sustainability Index
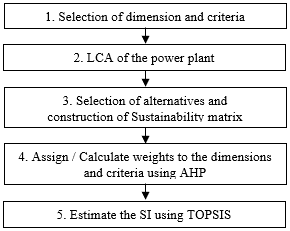
This section presents the methodology for the estimation of the SI of a coal power plant. A flowchart for estimation of SI is shown in the Figure 4.
Figure 4. Flowchart for estimation of SI
There are three major steps for estimation of sustainability index for any energy system as described by Wang et al. [11]. These three steps are selection of criteria, assigning weights to the criteria and evaluation of criteria. In this study, LCA is integrated in the method for quantification of these criteria. The following are the steps used to estimate the SI of coal power plants.
Step 1: The first step is to select the dimensions and respective criteria. These criteria will be selected based on the availability of data for all the power plants and can be compared on similar platforms. Here, five dimensions and 14 criteria are selected for the study. Table 1 summarises the dimensions and respective criteria considered in the present study.
Step 2: The next step is to quantify all the 14 criteria for the coal power plant on a life cycle basis. Hence, a brief LCA is carried out to obtain the required data. The details of the LCA are given in section 3.
Step 3: The third step is to choose alternatives and build a sustainability matrix. The sustainability matrix consists of quantified data of all 14 criteria for all the alternatives considered.
Step 4: The dimensions and criteria are assigned weights. These weights are given based on the importance of the scenario. This step is subjective weighing and lies in the interest of the stakeholders. Various scenarios are studied by changing the weights and the corresponding results obtained are analyzed. Analytic Hierarchy Process (AHP) is also used to assign weights for the dimensions and criteria.
Table 1. Dimensions and their respective Criteria
|
SN |
Dimension |
Criteria |
|
1 |
Resource |
Water consumption; Area usage. |
|
2 |
Energy |
Efficiency; Capacity Factor; Energy Return on Investment. |
|
3 |
Environmental |
CO2 emissions; NOx emissions; SOx emissions; Particulate matter emissions. |
|
4 |
Economic |
Capital cost; Levelized Cost of Electricity; External cost. |
|
5 |
Social |
Energy insecurity; Job Generation. |
The AHP is a method based on a pairwise comparison model, used to determine the weights for dimensions and criteria in the present study. The AHP method was proposed in 1980 by Saaty [14]. Table 2 shows the nine-point scale proposed by Saaty for pairwise comparisons. It gives relative importance among evaluation criteria. For example, if the weight is 5 between two criteria X and Y, then it means X is “strongly preferred” than Y. In the same case, when Y and X are compared the weight will be reciprocal of the weight of X and Y, i.e., 1/5. The step-by-step procedure is given below.
Table 2. Nine-point scale for pairwise comparison
|
Weight |
Interpretation |
|
1 |
Equally preferred |
|
3 |
Moderately preferred |
|
5 |
Strongly preferred |
|
7 |
Very strongly preferred |
|
9 |
Extremely preferred |
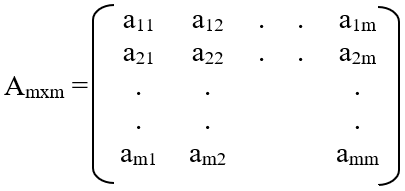
Step i: Evaluation matrix Amxm is constructed using the above mentioned pair-wise comparison method and Table 2 for all dimensions and their respective criteria of sustainability.
Step ii: Each element aij of the matrix Amxm is normalized using Eq. (1). Each element aij is then divided by the sum of all elements in ith row. The resulting matrix is the normalized matrix $\bar{A}_{m x m}$.
$\bar{a}_{i j}=\frac{a_{i j}}{\sum_{k=1}^{m} a_{k j}}(i, j=1,2, \ldots, m)$ (1)
Step iii: Elements are added along its rows to obtain $W_{i}$ as shown in Eq. (2).
$w_{i}=\sum_{j=1}^{m} \bar{a}_{i j}(i=1,2, \ldots, m)$ (2)
Step iv: The resulting matrix is W matrix which is given in Eq. (3).
$W=\left(w_{1}, w_{2}, \ldots, w_{m}\right)$ (3)
Step v: Each element of W matrix is normalized by using Eq. (4).
$\bar{w}_{i}=\frac{w_{i}}{\sum_{k=1}^{m} w_{k}}(i=1,2, \ldots, m)$ (4)
Step vi: Resulting matrix $\bar{W}$ is the weight matrix as shown in Eq. (5). It can be seen that the sum of all elements (weights) in the matrix $\bar{W}$ is equal to 1.
$\bar{W}=\left(\bar{w}_{1}, \bar{w}_{2}, \ldots, \bar{w}_{m}\right)$ (5)
The weight vector $\bar{W}$ gives the weights for the all selected criteria.
Step 5: Using the sustainability matrix and weights from step 4, TOPSIS is used to estimate the SI of coal power plants. It is a MCDM method that deals with making decisions for the selection of the best solution among various alternatives. It is also used to rank alternatives. TOPSIS was proposed by Hwang and Yoon in 1981 [16]. In this method, two ideal solutions are formed. These two ideal solutions are called positive ideal solution and negative ideal solution. The positive ideal solution is formed by taking all the most desired characteristics from the alternatives. Similarly, the negative ideal solution is formed by taking the least desired characteristics from the alternatives considered. The most preferred alternative will be nearest to the positive ideal solution and farthest from the negative ideal solution. It can be noted that all the alternatives will be in between positive and negative ideal solutions. The brief procedure can be found below.
Step i: Construct decision matrix D. Decision matrix D contains various alternatives are placed along the rows and various criteria along the columns as shown. Here D is a ‘m x n’ matrix having ‘m’ number of alternatives (A) and ‘n’ number of criteria (C). xij indicates a quantified number for ith alternative (Ai) and jth criteria (Cj).
Step ii: Normalize each element xij of the decision matrix D using Eq. (6).
$\bar{x}_{i j}=\frac{x_{i j}}{\sqrt{\sum_{i=1}^{m} x_{i j}^{2}}} \quad(j=1,2, \ldots, n)$ (6)
Step iii: Input weight vector W containing weights for all criteria as given in Eq. (7).
$W=\left(w_{1}, w_{2}, \ldots, w_{n}\right)$ (7)
Step iv: Construct a weighted decision matrix by multiplying normalized values and their respective weights using Eq. (8).
$r_{i j}=\bar{x}_{i j} * w_{j}(i=1,2, \ldots, m ; j=1,2, \ldots, n)$ (8)
Step v: From the weighted decision matrix, determine the positive ideal solution ($A^{+}$) and negative ideal solution ($A^{-}$) using the following equations. Eq. (9) and Eq. (10) show positive and negative ideal solution vector, respectively.
$A^{+}=\left\{r_{1}^{+}, r_{2}^{+}, \ldots, r_{n}^{+}\right)$ (9)
where, $\quad r_{j}^{+}=\max \left(r_{i j}\right) j=1,2, \ldots, n $; for "higher the better" criteria
$r_{j}^{+}=\min \left(r_{i j}\right) j=1,2, \ldots, n$; for "lower the better" criteria
$A^{-}=\left\{r_{1}^{-}, r_{2}^{-}, \ldots, r_{n}^{-}\right)$ (10)
where, $r_{j}^{-}=\min \left(r_{i j}\right) j=1,2, \ldots, n$; for "higher the better" criteria
$r_{j}^{-}=\max \left(r_{i j}\right) j=1,2, \ldots, n$; for "lower the better" criteria
Step vi: Evaluate the separation measure for each alternative from the positive ideal solution (S^{+}) and the negative ideal solution (S^{-}) using Eq. (11) and Eq. (12) respectively. The separation measure gives the relative distance between an alternative and the positive ideal solution. Similarly, it gives the relative distance between an alternative and the negative ideal solution.
$S_{i}^{+}=\sqrt{\sum_{j=1}^{n}\left(r_{i j}-r_{j}^{+}\right)^{2}}(i=1,2, \ldots, m)$ (11)
$S_{i}^{-}=\sqrt{\sum_{j=1}^{n}\left(r_{i j}-r_{j}^{-}\right)^{2}}(i=1,2, \ldots, m)$ (12)
Step vii: Evaluate relative closeness measure to the ideal solution for each alternative using Eq. (13).
$C_{i}=\frac{S_{i}^{-}}{\left(S_{i}^{+}+S_{i}^{-}\right)}(i=1,2, \ldots, m)$ (13)
Closeness measure $C_{i}$ will be 1 for the positive ideal solution $\left(A^{+}\right)$ and 0 for the negative ideal solution $\left(A^{-}\right)$. Closeness measure for all alternatives lies between 0 and 1 . This relative closeness measure is SI. Higher closeness measure is preferred, as it is closer to the positive ideal solution.
This section deals with the LCA of an average Indian supercritical coal-based power plant using domestic coal for combustion. LCA is a powerful tool to identify the environmental impacts linked to a process or a product. ISO 14040:2006 deals with principles and framework for carrying out and reporting LCA. It includes the following sections: Goal and scope, life cycle inventory, life cycle impact assessment, and finally, interpretation. The various criteria considered in the present study are water consumption, land use, efficiency, CF, energy return on investment, CO2 emissions, SOx emissions, NOx emissions, capital cost, levelized cost, external cost, energy insecurity, and job generation.
3.1 Boundary of the system
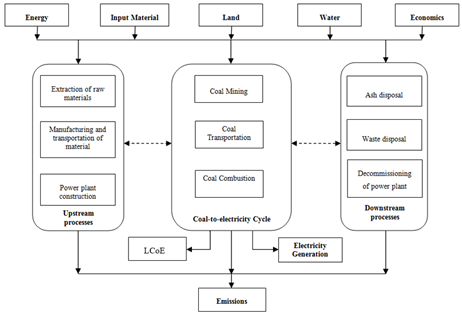
The coal power plant energy system in the real world is very complex and hence, the boundary is defined based on the availability of the data. Figure 5 depicts the boundary of the study. LCA of power generation from the coal power plant is divided into three stages, i.e. power plant construction (cradle), electricity generation from coal combustion (operation), and decommissioning (grave). The operation stage includes upstream and downstream processes along with coal combustion. Upstream processes include processes like coal mining, coal beneficiation, and coal transportation to the power plant site. Downstream processes include ash and waste disposal. Inputs like energy, materials, water, area, and economics are quantified. Similarly, outputs like energy, emissions, ash, and levelized cost of electricity are quantified on a life cycle basis.
Figure 5. The boundary of the coal power plant
3.2 Specifications of the power plant
In the present study, an average NTPC coal-based power plant of 660 MW unit size, having supercritical steam parameters is considered. Table 3 gives the specifications of the power plant [21].
A software called IECM (abbreviated as Integrated Environmental Control Model, developed by Carnegie Mellon University, United States) is used in the present study to calculate the CO2, SOx, NOx and particulate matter emissions as well as for water consumption [22]. The specifications of the power plant are used as input to the software.
Further, the main raw materials used for the construction of coal-based power plants are cement, steel, aluminium, and copper [3]. Table 4 gives details of raw material required, corresponding embodied energy, water consumption, and CO2 emission factor.
It is important to calculate the electricity generated by a power plant over its lifetime. It is assumed that during the first year of operation the power plant will run at 50% of its actual capacity, and 75% during last year. The life span of the power plant is taken as 30 years. The total electricity generated by the power plant is 134.04 billion kWh. The specific coal consumption of an average NTPC power plant is about 0.69 kg/kWh. Hence, the total coal required is about 92.5 MT.
Table 3. Specifications of the coal power plant
|
SN |
Parameter |
Value |
|
1 |
Size of the unit |
660 MW |
|
2 |
Steam parameters type |
Supercritical |
|
3 |
Steam parameters |
242.2 bar/ 537℃/ 565℃ |
|
4 |
Efficiency |
37.5% |
|
5 |
Capacity factor |
80.00% |
|
6 |
Coal supply |
Domestic |
|
7 |
Calorific value of coal |
14,090 kJ/kg |
|
8 |
Specific coal consumption |
0.69 kg/kWh |
|
9 |
Life of the power plant |
30 years |
Table 4. Raw materials used for the power plant construction
|
Material |
Quantity (kg/MW) |
Embodied Energy (MJ/kg) |
Water Consumption (L/kg) |
CO2 Emission Factor (kg) |
|
Cement |
1,50,000 |
1.18 [23] |
0.93 [23] |
1.19 [23] |
|
Structural steel |
85,000 |
29.07 [24] |
3.72 [27] |
3.11 [27] |
|
Reinforcement steel |
45,000 |
29.07 [24] |
3.72 [27] |
3.11 [27] |
|
Aluminium |
500 |
150.12 [25] |
27 [25] |
9.9 [25] |
|
Copper |
10,300 |
69.98 [26] |
4.4 [26] |
5.57 [26] |
3.3 Resource dimension
3.3.1 Water consumption
Water consumption is a significant aspect and it should be considered for the sustainability of the power plant. Water is used not only during the operating phase of the power plant but also during the manufacturing of raw materials required for the construction of the power plant and coal mining. The water consumption during manufacturing is found to be 3.5 ml/kWh using Table 4.
A huge amount of water is consumed during the operation of the power plant. Water is mainly consumed for cooling tower makeup. The water for cooling tower make-up amounts to 85% of the total water consumption. Other processes that require water are ash handling system, domestic purposes, sludge clarifier, etc. From the IECM tool, the water consumption during calculated to be 2.44 L/kWh.
3.3.2 Land use
Land area usage is an important aspect of the power plant. In the present study, not only land required for the main plant is considered i.e. operation phase, but right from land required for coal mining to ash disposal are considered. The land area requirement is captured from a life cycle perspective.
In India, 91.6% of mining from open cast mining, and the rest are from underground coal mining [28]. Surface mining requires a huge area for mining coal. On average, a total of 4 hectares of land is required to mine 10 MT of coal. From the previous section, the coal requirement for a 660 MW sub-critical power plant is found to be 92.5 MT of coal for over 30 years. Hence, the area required for mining is about 0.14 acres/MW.
The area required for the operation of a power plant having 3 units of 660 MW is as shown in Table 5 [3]. It can be seen that the main plant requires just 44 acres. Other facilities are also to be considered while calculating the area occupied by the power plant. The total area required for the operation of the power plant of size 3x660 MW is about 1520 acres, i.e. 0.77 acres/MW. From the above calculations, the total area occupied by the power plant on a life cycle basis is about 0.91 acres/MW.
Table 5. Area required for the operation of the power plant
|
SN |
Description |
Area (acre) |
|
Facilities inside power plant boundary |
||
|
1 |
Main plant |
44 |
|
2 |
Coal Handling System |
240 |
|
3a 3b |
Water system |
55 |
|
Water reservoir |
60 |
|
|
4 |
Switchyard |
28 |
|
5 |
Miscellaneous facilities |
83 |
|
6 |
Green belt |
170 |
|
Facilities outside the power plant boundary |
||
|
1 |
Ash disposal area |
495 |
|
2 |
Township |
100 |
|
3 |
Corridors for ash slurry, raw water, and coal |
245 |
|
Grand Total |
1520 |
|
3.4 Energy dimension
3.4.1 Efficiency
As presented earlier in this section, the coal power plant considered for the study is an average NTPC supercritical coal power plant. The efficiency of the coal-based power plant is 37.5%.
3.4.2 Capacity factor
The average capacity factor (CF) or plant load factor of NTPC coal-based power plants is about 80%. Some power plants operate at more than 90% in India. All India plant load factor of coal power plants was just above 60% [3].
3.4.3 Energy return on investment
The main function of the coal-based power plants is to convert chemical energy present in coal to electricity that can be used easily for various applications. The input for coal power plants is coal. For coal mining, energy is spent in the process. Hence, net energy analysis is considered one of the important aspects of the evaluation of power plants. Energy Return on Investment (EROI) is the most common approach for coal power plants. EROI is defined as the ratio of the usable energy output to the energy spent for producing the usable energy. In the present study, the input energy is the energy invested during the construction of the power plant, coal mining, coal transportation, and decommissioning of the power plant and the output energy of the coal power plants is the electricity.
As discussed, energy is required during the construction phase, coal mining, and transportation. Table 6 provides the energy data required during construction and coal mining for the operation of machinery.
During the commission of the power plant, the construction materials have to be transported from the manufacturing plant to the construction site. Also, during the operation phase of the power plant, the coal has to be transported from coal mines to the power plant. Road and railway modes of transportation are considered in the study.
Table 6. Energy consumption during upstream processes
|
SN |
Description |
Electricity |
Diesel |
|
1 |
Energy consumption during construction (per MW) |
400 kWh |
4,450 L |
|
2 |
Energy consumption during coal mining (per tonne) |
9 kWh |
1.8 L |
|
3 |
CO2 emission factor (kg/unit) |
0.82[3] |
3.2 [29] |
The diesel consumption by trucks during transportation of the raw materials to the construction site is about 50,890 L, and diesel consumption during coal transportation for over 30 years is 15.93 million L. Similarly, the diesel consumption by train during transportation of the raw materials to the construction site is 0.13 million L, and diesel consumption by train during coal transportation for over 30 years is about 64.5 million L. Table 7 shows the energy invested during various processes for the production of electricity.
Table 7. The energy input for the production of electricity
|
SN |
Description |
Energy (MJ) |
|
1 |
Construction of the power plant |
3.25*109 |
|
2 |
Coal Mining |
8.98*109 |
|
3 |
Transportation of coal & raw materials |
2.72*109 |
|
4 |
Decommissioning of power plant |
0.33*109 |
|
|
Total |
15.28*109 |
The energy input to the power plant is about 15.28*109 MJ, i.e. 4.24 billion units. The total electricity output from a 660 MW supercritical coal power plant over 30 years is about 134 billion kWh. The EROI is calculated using Equation 1. Hence, the EROI of the coal-based power plant is found to be 31.6.
3.5 Environmental dimension
Coal power plants are one of the major sources of CO2 emissions. In this section, the life cycle CO2 emissions from the coal power plant are calculated. The stages covered for calculating life cycle CO2 emissions (ELC) are the manufacturing of raw materials required for construction of the power plant (Er), mining of coal (Em), transportation of raw materials (ETr) and coal (ETc) to the site, fuel combustion (Ec) and decommissioning of the power plant (Ed).
From Table 4, it can be seen that the total CO2 emissions from the construction of 660 MW coal-based power plants are about 0.43 MT of CO2. This implies that CO2 emissions from the manufacturing of the raw materials and construction of the power plant (Er) are about 3.24 g CO2/kWh of electricity generated.
The emissions from the transportation of raw materials to the construction site are also considered. The distance covered and energy consumption during transportation is discussed in section 3.4.2. From these data, the emissions from the transportation of raw materials (ETr) are found to be 434 tonnes of CO2. This is negligible when expressed in terms of per unit of total electricity generated by the coal power plant during its life span.
The GHG emissions during the operation of the power plant are significant and this phase is the major contributor to CO2 emissions in the life cycle perspective. The processes included in the operation phase or coal-to-electricity cycle are mining, coal transportation, and coal combustion. In the coal mining process, coal mine methane emissions, electricity, and diesel consumption are considered. In the coal transportation process, both truck and railway means of transport are accounted for. In the fuel combustion process, coal combustion, and oil required for the auxiliary processes are considered. In the present study, an average NTPC power plant is considered. An average supercritical coal power plant emits 871.5 g CO2/kWh of electricity generated.
The coal mine methane is the most significant indirect GHG emissions. In India, most of the mining is surface mining. In 2012-13, 91.6% of the total coal mined was from surface mining by Coal India Ltd. The rest of the coal was from underground mining. The methane emissions from surface mining are less when compared to the emissions from underground mining. The methane emissions from surface mining are considered as 1.33 m3/tonne and the emissions from underground mining varied from 2.91 to 23.64 m3/tonne [28]. The emission factor for CO2 from diesel is considered as 3.2 kg/kg of diesel and CO2 emission from oil is considered to be 2.89 g/ml of oil [29]. The global warming potential CH4 is considered as 25 in the present calculation. Table 8 gives GHG emissions during the operation phase of the coal power plant.
From Table 8, the emissions during operation are found to be 914 g CO2-eq/kWh. There is a lack of data regarding the decommissioning of the power plant. Hence, the emissions during the decommissioning phase are assumed as 10% of emissions during the construction phase. Therefore, emissions during the decommissioning phase are taken as 0.32 g CO2/kWh.
The Life cycle emissions are the sum of emissions during the raw material production and construction of the power plant (3.24 g CO2/kWh), operation phase (914 g CO2/kWh), and decommissioning (0.32 g CO2/kWh). Hence, the life cycle GHG emissions (E_LC) from the super critical coal-based power plant are 917.56 g CO2/kWh.
From the above study, it is seen that about 95% are direct emissions and 5% are indirect emissions. Due to a lack of complete data, emissions for SOx, NOx, and PM are taken only for the operation phase. The SOx, NOx, and PM emissions are found to be 1.88, 0.42, and 0.12 g/kWh respectively during the operation phase.
Table 8. GHG emission from coal-to-combustion cycle
|
SN |
Process |
CH4 |
CO2 |
Total |
|
1 |
Mining - Coal Mine Methane - Electricity consumption - Diesel consumption |
28.20 - |
- 7.23 2.68 |
28.20 7.23 2.68 |
|
2 |
Transportation - Railways - Truck |
- - |
1.17 0.33 |
1.17 0.33 |
|
3 |
Fuel combustion - Coal combustion - Oil combustion |
- - |
871.5 2.89 |
871.5 2.89 |
|
Total |
914 |
|||
3.6 Economic dimension
Capital cost, Levelized Cost of Electricity (LCoE) and external costs are the three important factors that have to be taken into account during economic analysis of any energy systems. The capital cost of supercritical power plants is in the range of INR 5.5-6.5 crores per MW in India. In the present study, the capital cost is considered to be INR 6 crores per MW.
There are many methods available in the literature to calculate the LCoE of the coal power plants. In the present study, a method followed to calculate the LCoE is given by Karmakar [8]. In this method, the annualized cost of electricity is calculated first [30]. Then, by using a levelizing factor annualized cost is modified to the levelized cost of electricity. The technical inputs for this tool are unit size, steam parameters, efficiency, CF, specific coal consumption, the calorific value of coal, the lifespan of the power plant, discount rate, escalation rate, fixed capital cost, and fixed operation and maintenance cost. The capital cost for the power plant is considered as INR 6 crores per MW and the fuel cost is assumed as INR 2,000/tonne of coal. From these inputs, the LCoE is estimated to be INR 2.95/kWh.
The next important criterion is the external cost. Power generation from coal-based power plants causes environmental degradation and health damages. These are usually referred to as external costs. Presently, State Electricity Boards (SEB) are fixing tariffs for electricity at which it has to be sold to the consumer. External costs are not accounted for while deciding the tariff for electricity that is being sold to the consumers. These externalities are not imposed on consumers or electricity producers, but society. Coal-based power generation is linked to environmental, social, and cultural impacts, during all the stages.
Power generation from coal power plants has an impact on the environment and human beings as well. There are dust emissions from mining, land degradation, deforestation, destruction of natural habitat, dislocation of people, changes in culture, and the economy of the local people, surface water and groundwater contamination, fugitive emissions during mining, transportation, and power generation which create an impact on human health, agriculture, and buildings.
The above-mentioned impacts are referred to as external costs and they are not accounted for while calculating tariff for electricity. TERI, with the help of the Planning Commission (Govt. of India), has published a report on the external costs of power generation from coal-based power plants [31]. Table 9 gives externalities and associated costs from the coal-based power generation. These calculations are carried out using the report published by TERI [31]. The external cost for CO2 emissions in the present study is calculated by assuming the external cost to be EUR 13/tonne of CO2 emissions (1 EUR = 80.05 INR). This is based on carbon credits trading.
Table 9. The external cost of coal electricity generation
|
SN |
Parameter |
External Cost (INR/kWh) |
|
1 |
Dust from mining |
0.05 |
|
2 |
Land degradation |
0.04 |
|
3 |
Loss of Forest area |
0.01 |
|
4 |
Resettlement & Rehabilitation |
0.01 |
|
5 |
Water degradation |
0.07 |
|
6 |
Fly ash disposal |
0.06 |
|
7 |
Impacts on Agriculture |
0.03 |
|
8 |
Impacts on Buildings |
0.03 |
|
9 |
Health |
0.13 |
|
10 |
CO2 emission |
0.95 |
|
Total |
1.47 |
Note: Numbers may not sum due to rounding.
From Table 9, the total external costs arising from the generation of electricity from the coal-based power plant are INR 1.47/kWh of electricity generated. This value is very much significant and cannot be neglected. External costs are not included in the LCoE and hence, these are not compensated. Steps have to be taken to mitigate these externalities, to use coal in a more sustainable manner.
3.7 Social dimension
Energy insecurity is an index based on energy resources and energy technologies available at the domestic level and international level. The higher the availability at the domestic level, the lower will be the energy insecurity. In India, Chinese supercritical boilers are imported and these boilers are usually designed for low ash imported coal. Indian domestic coal has higher ash content. In this paper, the energy insecurity for supercritical power plants is considered as 0.50 on a 0 to 1 scale.
Job Generation criteria is a measure of the number of jobs generated per MW of the power plant. For coal power plants, the job generation is about 1.35 per MW [32].
Table 10. The LCA results of a coal based power plant
|
SN |
Dimension |
Criteria |
Unit |
Value |
|
1 |
Resource |
Land usage |
acre/MW |
0.91 |
|
2 |
Water Use |
m3/MWh |
2.44 |
|
|
3 |
Energy |
Efficiency |
% |
37.5 |
|
4 |
Capacity Factor |
% |
80 |
|
|
5 |
EROI |
- |
32 |
|
|
6 |
Environmental |
CO2 Emissions |
g/kWh |
918 |
|
7 |
SOx Emissions |
g/kWh |
1.88 |
|
|
8 |
NOx Emissions |
g/kWh |
0.42 |
|
|
9 |
PM2.5 Emissions |
g/kWh |
0.12 |
|
|
10 |
Economic |
Capital Cost |
crores INR/MW |
6 |
|
11 |
LcoE |
INR/kWh |
2.95 |
|
|
12 |
External Cost |
INR/kWh |
1.47 |
|
|
13 |
Social |
Energy Insecurity |
- |
0.5 |
|
14 |
Job generation |
Jobs/MW |
1.35 |
3.8 Summary
A brief life cycle analysis of supercritical coal based power plant operating in India using high ash domestic coal is carried out. Table 10 summarises the quantified criteria obtained from LCA for this power generation technology. These quantified criteria are used in the sustainability matrix and finally enables to estimate the SI of coal based power plants.
4.1 Estimation of Sustainability Index
In this section, the SI of coal power plants is estimated using the methodology described in Section 2.0. Assigning weights to the dimensions and criteria are subjective. This depends on the different stakeholders involved. Various scenarios are studied by changing the weights given to the dimensions and criteria.
A sustainability matrix is constructed. This matrix contains quantified values of all 14 criteria for 7 different power generation systems i.e., coal, natural gas combined cycle, nuclear, large hydro, solar photovoltaics, wind, and biomass-based power plants. Table 11 shows the sustainability matrix.
SI is estimated with the help of a sustainability matrix and a MCDM method. In the following section, SI for supercritical coal power plants is estimated using TOPSIS for various scenarios.
Table 11. Sustainability Matrix
|
Criteria |
Coal |
Gas |
Nuclear |
Hydro |
SPV |
Wind |
Bio-mass |
|
Land Usage (acre/MW) |
0.91 |
0.75 |
0.24 |
55 |
5 |
27.5 |
5 |
|
Water use (m3/MWh) |
2.44 |
0.75 |
5.7 |
5.4 |
0.95 |
0.03 |
1.29 |
|
Efficiency (%) |
37.5 |
58.6 |
35 |
80 |
13.9 |
35 |
35 |
|
CF (%) |
80.0 |
50 |
80 |
37 |
16.1 |
25 |
80 |
|
EROI |
32 |
28 |
75 |
50 |
4 |
16 |
3.5 |
|
CO2 (g/kWh) |
918 |
351 |
9.21 |
6.24 |
52.9 |
9.84 |
145 |
|
SOx (g/kWh) |
1.88 |
0.46 |
0.03 |
0.004 |
0.13 |
0.002 |
1.41 |
|
NOx (g/kWh) |
0.42 |
1.76 |
0.02 |
0.006 |
0.1 |
0.002 |
3.70 |
|
PM2.5 (g/kWh) |
0.12 |
0.1 |
0.004 |
0.002 |
0.02 |
0.006 |
0.64 |
|
CC (crores INR/MW) |
6 |
4.3 |
10 |
6 |
5.3 |
4.5 |
6 |
|
LCOE (INR/kWh) |
2.95 |
2.62 |
2.44 |
1.84 |
2.44 |
2.43 |
7.54 |
|
External cost (INR/kWh) |
1.47 |
1.0 |
0.21 |
0.29 |
0.32 |
0.10 |
1.08 |
|
Energy Insecurity |
0.5 |
0.5 |
0.4 |
0 |
0.7 |
0.5 |
0 |
|
Job Gen. (Jobs /MW) |
1.35 |
0.94 |
1.60 |
2.09 |
8.20 |
4.50 |
5.70 |
4.2 Scenario 1 – Equal weights for criteria
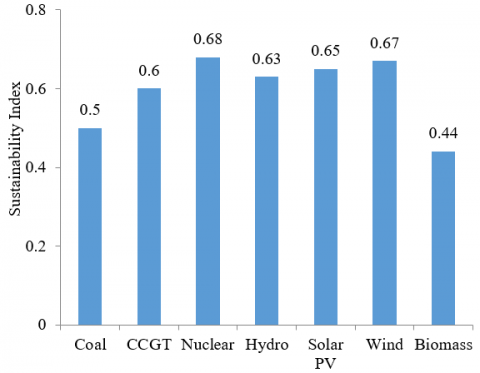
Assigning weights is subjective and it depends on the author. Assigning equal weights is a logical way to avoid subjectivity. In this scenario, all 14 criteria are assigned with equal weights. This weight is referred to as global weights. The weight for each criterion is about 7.14%. Using these weights as inputs for the TOPSIS method, SI is estimated.
Figure 6. The SI of various power generation systems
Figure 6 shows the SI of 7 different power generating systems. From Figure 6, it can be seen that the nuclear power plant has the highest SI with 0.68 and is followed by wind with SI of 0.67. The coal power plant occupies the 6th position with a sustainability index of 0.50. Nuclear, hydro, solar PV and wind-based power plants are preferable when all the criteria are given equal weights.
Equal weights scenario does not exist in the real world. Hence, further analysis is carried out by changing the weights to dimensions and criteria.
4.3 Scenario 2 – Unequal dimension weights and equal criteria weights
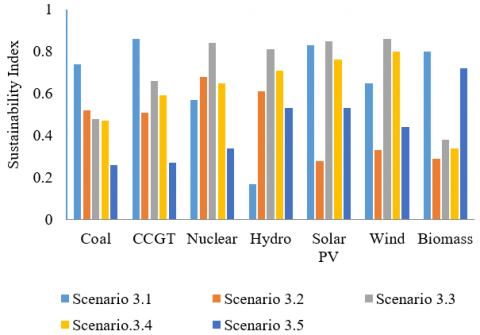
In this scenario, five sub-scenarios are studied. In each sub-scenario, one of the dimensions is given a very high weight. This study is carried out to bring out the importance of each dimension of sustainability. As discussed earlier, these weights depend on the stakeholders’ interest in estimating the SI. Five sub-scenarios are studied in this section highlighting one of the dimensions. The highlighted dimension is assigned with 60% weight and all other dimensions are assigned with 10% weight. Further, the local weights for criteria are equal. Table 12 gives the summary of the dimension weights used in the five sub-scenarios.
Table 12. Weights of dimensions for five scenarios
|
Scenario |
Weights (%) |
||||
|
Resource |
Energy |
Environ. |
Economic |
Social |
|
|
3.1 Resource |
60 |
10 |
10 |
10 |
10 |
|
3.2 Energy |
10 |
60 |
10 |
10 |
10 |
|
3.3 Environ. |
10 |
10 |
60 |
10 |
10 |
|
3.4 Economic |
10 |
10 |
10 |
60 |
10 |
|
3.5 Social |
10 |
10 |
10 |
10 |
60 |
4.3.1 Resource scenario
In this scenario, the resource dimension is given 60% and other dimensions are given 10% each. Since the weights are equally divided among the respective criteria, the water consumption and land usage criteria get 30% weight each. By using these weights, the SI of various power generation systems is estimated and the results are shown in Figure 7. From the results, it can be seen that gas-based power plants have the highest SI, as they consume the least amount of water and land. This is followed by Solar PV. The coal power plants are placed 4th position. Even though the area required is relatively less, these coal power plants consume more water per kWh of electricity produced. Hence, the SI is reduced. Steps have to be taken to reduce water consumption for coal-based power plants.
4.3.2 Energy scenario
In this scenario, the energy dimension is given more importance and it is assigned with 60% weight. The energy dimension contains three criteria and they are efficiency, CF, and EROI. All three criteria are assigned 20% weight by dividing the dimension weight equally. By using these weights, the SI is estimated. The results are as shown in Figure 7. From the results, it can be seen that the nuclear power plants perform better in this scenario with a SI of 0.68. It has the highest EROI as well as the highest CF. The coal power plant is ranked at 3rd position with a SI of 0.52. The efficiency of coal power plants has to be increased by adopting Advanced Coal Technologies (ACT). With an increase in efficiency, there will be an increase in the EROI as well. Hence, the SI of coal-based power plants will be increased.
4.3.3 Environmental scenario
In this scenario, the environmental dimension is assigned with 60% weight. This dimension contains 4 criteria. These criteria are CO2 emission, NOx emission, SOx emission, and particulate matter emission. These criteria weights are 15% each. With these weights, the SI is estimated and the results are shown in Figure 7. Wind, solar PV and nuclear perform well in this dimension and have SI in the range of 0.84-0.86. On the other hand, the coal power plants occupies 6th position with a SI of 0.48, have almost half the SI as compared with the top-ranked power plant. As discussed earlier, coal power plants are the highest point source emitter of CO2. The CO2 capture systems have to be installed to reduce CO2 emissions. Similarly, better efficient emission control units have to be installed to curb NOx, SOx, and PM emissions. By taking these measures, the SI of coal power plants can be increased.
4.3.4 Economic scenario
Here, the economic dimension is assigned with 60% weight. This dimension contains three different criteria. These criteria are capital cost, levelized cost of electricity, and external cost. Each of these criteria is assigned 20%. Other dimensions are assigned 10% weight and this is internally divided among the respective criteria. Using these weights as input for TOPSIS, the SI of power plants is estimated and the results are shown in Figure 7. From the results, it can be seen that wind power plants have the highest SI of 0.80 due to its lower capital cost, LCoE, and external cost. Coal power plants rank 6th among various power plants having SI and it is 0.47. The levelized cost of electricity and the external costs are nearer to the negative ideal power plant. Steps have to be taken to reduce the externalities arising from coal power plants. These coal power plants affect the health of human and other living beings, affects buildings, agriculture, deteriorate land, and water sources. At most care to be taken to tackle these issues.
4.3.5 Social scenario
In this scenario, the social dimension is given high importance and is assigned 60% weight. This dimension contains two different criteria energy insecurity and job generation. The weights assigned for these criteria are about 30% each. Using these weights as the SI is estimated and the results are shown in Figure 7. From the results, the biomass ranks first with a sustainability index of 0.72. The coal-based power plants rank last with a sustainability index of 0.26. This is due to higher insecurity and lower job generation. The energy insecurity is due to the import of high-grade coal mainly from South Africa, Indonesia, and Australia. The Chinese boilers are also imported for the installation of supercritical power plants. These imported boilers are designed for low ash coal. The energy insecurity can be lowered by developing the technology at the national level which runs on Indian high ash coal.
Figure 7. Sustainability Index of various power generation systems
4.4 Scenario 3 – Unequal dimension and criteria weights
In this section, weights are obtained using the AHP method. Assigning weights is subjective and this depends on the authors. AHP method is based on pairwise comparison and this reduces subjectivity. In this section, all the dimensions and respective criteria weights are calculated using AHP. The weights calculated for criteria are called local weights. These weights are then multiplied with the corresponding dimension weight to obtain global weights. The pairwise comparison matrix for the dimension is as shown in Table 13. This comparison matrix is input for AHP and the weights are determined using it. Table 14 shows the weights obtained using AHP.
Table 13. Pairwise comparison matrix for Dimensions
|
|
Resource |
Energy |
Environ. |
Economic |
Social |
|
Resource |
1 |
1/2 |
1/2 |
2 |
3 |
|
Energy |
2 |
1 |
1 |
2 |
3 |
|
Environ. |
2 |
1 |
1 |
3 |
5 |
|
Economic |
1/2 |
1/2 |
1/3 |
1 |
3 |
|
Social |
1/3 |
1/3 |
1/5 |
1/3 |
1 |
Table 14. Weights obtained using AHP for the Dimensions
|
Dimension |
Resource |
Energy |
Environ. |
Economic |
Social |
|
Weight |
0.19 |
0.28 |
0.33 |
0.13 |
0.07 |
This study focuses on UN’s 7th SDG which is ensuring clean energy to all. Considering this goal, more emphases are given to the energy dimension as well as the environmental dimension. To meet the ever-increasing demand for electricity, power plants with higher performance of technical dimension have to be installed. This implies that the power plant with better efficiency, CF, and EROI are more preferable. Further, to combat climate change the power plants that perform better in the environmental dimension have to be installed. This implies that the power plants with lower CO2, NOx, and SOx emissions are more preferable. Hence, these two dimensions are given priority and the weights account for over 60% of the total weight. The pairwise comparison matrices for the criteria in energy dimension and environmental dimension are shown in Table 15 and Table 17, respectively. The weights obtained for these criteria by the application of AHP are shown in Table 16 and Table 18, respectively.
Table 15. Pairwise comparison for the Energy Dimension
|
|
Efficiency |
Capacity factor |
EROI |
|
Efficiency |
1 |
2 |
½ |
|
Capacity factor |
1/2 |
1 |
1/3 |
|
EROI |
2 |
3 |
1 |
Table 16. Criteria weights (local) in the Energy Dimension
|
|
Efficiency |
Capacity factor |
EROI |
|
Weights |
0.30 |
0.17 |
0.53 |
Table 17. Pairwise comparison for the Environ. Dimension
|
|
CO2 |
SOx |
NOx |
PM2.5 |
|
CO2 |
1 |
3 |
3 |
2 |
|
SOx |
1/3 |
1 |
1 |
1/2 |
|
NOx |
1/3 |
1 |
1 |
1/2 |
|
PM2.5 |
1/2 |
2 |
2 |
1 |
Table 18. Criteria weights (local) in the Environ. Dimension
|
|
CO2 |
SOx |
NOx |
PM2.5 |
|
Weights |
0.46 |
0.14 |
0.14 |
0.26 |
Similarly, the weight of all criteria under other three dimensions are also calculated using AHP and the results are summarized in Table 19. Global weights are obtained by multiplying the dimension weight and local weight.
Table 19. Global weights of all criteria
|
Dimension |
Criteria |
Dimension wt. |
Local wt. |
Global wt. |
|
Resource |
Water |
0.19 |
0.50 |
0.093 |
|
Area |
0.50 |
0.093 |
||
|
Energy |
Efficiency |
0.28 |
0.30 |
0.085 |
|
CF |
0.17 |
0.048 |
||
|
EROI |
0.53 |
0.150 |
||
|
Environ. |
CO2 |
0.33 |
0.46 |
0.150 |
|
SOx |
0.14 |
0.047 |
||
|
NOx |
0.14 |
0.047 |
||
|
PM |
0.26 |
0.086 |
||
|
Economic |
Capital cost |
0.13 |
0.65 |
0.086 |
|
LCOE |
0.23 |
0.031 |
||
|
External cost |
0.12 |
0.016 |
||
|
Social |
Energy Insecurity |
0.07 |
0.75 |
0.053 |
|
Job Generation |
0.25 |
0.017 |
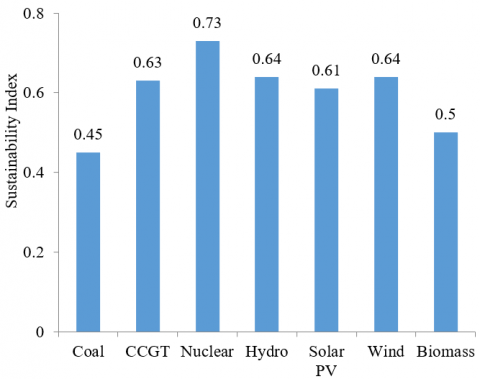
Using the global weights given in Table 19 as input to the TOPSIS method, SI is estimated for various power generation systems and the results are shown in Figure 8. From the results it can be seen that the nuclear power plant ranks first with SI of 0.73 and is followed by Hydro and wind power plants with SI of 0.64 for both. The coal power plants rank last with the SI of 0.45.
From the results, it is evident that coal power plants are not sustainable on their own. The power plants have to be made sustainable by adopting various technologies. By adopting Advanced Coal Technologies, the efficiency of the power plants increases, and in turn emissions will be reduced. These ACTs included Ultra Supercritical (USC), Advanced USC (A-USC), Integrated Gasifier Combined Cycle (IGCC), Integrated Gasifier Fuel Cell (IGFC) to name a few.
Figure 8. SI using AHP-TOPSIS methodology
By increasing the efficiency, precious non-renewable coal is conserved. Further, emissions from the coal power plants should be controlled by installing Carbon Capture System (CCS), efficient De-NOx, De-SOx, and Electrostatic Precipitator (ESP). This will reduce the burden on the environment and also reduce global warming. Research should be carried out at the national level to develop indigenous technologies suitable for Indian conditions and Indian high ash coal. This will strengthen the energy security of the nation. The preliminary studies show that the SI of supercritical power plants with CCS, De-NOx, De-SOx, and ESP will be as high as about 0.75.
The conclusions of the present study are the following.
[1] UNDP. (2016). Sustainable development goals. https://www.undp.org/content/undp/en/home/sustainable-development-goals.html, accessed on Jan. 16, 2019.
[2] WCED. (1987). Our Common Future, World Commission on Environment and Development (WCED), Oxford University Press, Oxford.
[3] CEA. (2020). Central electricity authority website. http://cea.nic.in/, accessed on Sept. 18, 2020.
[4] IEA. (2019). Statistics, Electricity consumption per capita, World 1990-2016. https://www.iea.org/statistics/?country=WORLD&year=2016&category=Electricity&indicator=ElecConsPerCapita&mode=chart&dataTable=INDICATORS, accessed on Apr. 17, 2019.
[5] MOSPI. (2018). Energy Statistics, 2018, Published by Ministry of Statistics and Programme Implementation. http://mospi.nic.in/sites/default/files/publication_reports/Energy_Statistics_2018.pdf, accessed on Apr. 19, 2019.
[6] WCA. (2019). Coal Mining, Top ten coal producers in 2016, World Coal Association. https://www.worldcoal.org/coal/coal-mining, accessed on Apr. 19, 2019.
[7] PIB. (2018). Production, supply and import of coal. Press Information Bureau. http://pib.nic.in/newsite/PrintRelease.aspx?relid=186616. Accessed on April 19, 2019.
[8] Karmakar, S. (2017). 4-E analysis of advanced coal technologies (PC-based Supercritical, Ultra-supercritical and IGCC) for power generation with CO2 capture. Ph.D Thesis, Indian Institute of Technology Madras, India.
[9] Agrawal, K.K., Jain, S., Jain, A.K., Dahiya, S. (2014). A life cycle environmental impact assessment of natural gas combined cycle thermal power plant in Andhra Pradesh, India. Environmental Development, 11: 162-174. https://doi.org/10.1016/j.envdev.2014.04.002
[10] Mallapragada, D.S., Naik, I., Ganesan, K., Banerjee, R., Laurenzi, I.J. (2019). Life cycle greenhouse gas impacts of coal and imported gas-based power generation in the Indian context. Environmental Science and Technology, 53(1): 539-549. https://doi.org/10.1021/acs.est.8b04539
[11] Wang, J.J., Jing, Y.Y., Zhang, C.F., Zhao, J.H. (2009). Review on multi-criteria decision analysis aid in sustainable energy decision-making. Renewable and Sustainable Energy Reviews, 13(9): 2263-2278. https://doi.org/10.1016/j.rser.2009.06.021
[12] Kumar, A., Sah, B., Singh, A.R., Deng, Y., He, X., Kumar, P., Bansal, R.C. (2017). A review of multi criteria decision making (MCDM) towards sustainable renewable energy development. Renewable and Sustainable Energy Reviews, 69: 596-609. https://doi.org/10.1016/j.rser.2016.11.191
[13] Subramanian, N., Ramanathan, R. (2012). A review of applications of Analytic Hierarchy Process in operations management. International Journal of Production Economics, 138(2): 215-241. https://doi.org/10.1016/j.ijpe.2012.03.036
[14] Saaty, T.L. (1980). The Analytic Hierarchy Process. NewYork, NY, USA. McGraw-Hill.
[15] Behzadian, M., Khanmohammadi Otaghsara, S., Yazdani, M., Ignatius, J. (2012). A state-of the-art survey of TOPSIS applications. Expert Systems with Applications, 39(17): 13051-13069. https://doi.org/10.1016/j.eswa.2012.05.056
[16] Hwang, C.L., Yoon, K. (1981). Multiple attribute decision making-methods and application: A state-of-the-art survey, New York, USA: Springer-Verlag.
[17] Chatzimouratidis, A.I., Pilavachi, P.A. (2009). Technological, economic and sustainability evaluation of power plants using the Analytic Hierarchy Process. Energy Policy, 37(3): 778-787. https://doi.org/10.1016/j.enpol.2008.10.009
[18] Stein, E.W. (2013). A comprehensive multi-criteria model to rank electric energy production technologies. Renewable and Sustainable Energy Reviews, 22: 640-654. https://doi.org/10.1016/j.rser.2013.02.001
[19] Xu, G., Yang, Y., Lu, S., Li, L., Song, X. (2011). Comprehensive evaluation of coal-fired power plants based on grey relational analysis and analytic hierarchy process. Energy Policy, 39(5): 2343-2351. https://doi.org/10.1016/j.enpol.2011.01.054
[20] Campos-Guzmán, V., García-Cáscales, M.S., Espinosa, N., Urbina, A. (2019). Life cycle analysis with multi-criteria decision making: A review of approaches for the sustainability evaluation of renewable energy technologies. Renewable and Sustainable Energy Reviews, 104: 343-366. https://doi.org/10.1016/j.rser.2019.01.031
[21] NTPC. (2014). Sustainability Report – FY 2014, NTPC. https://www.ntpc.co.in/en/sustainability/compliances-and-reports/sustainability-reports, accessed on Oct. 16, 2020.
[22] IECM. (1983). Integrated Environmental Control Model Software developed by Carnegie Mellon University, United States. http://www.iecm-online.com.
[23] Nisbet, M.A., Marceau, M.L., Vangeem, M.G. (2002). Environmental life cycle inventory of Portland cement concrete. Portland Cement Association, (2137).
[24] Hammond, G., Jones, C. (2008). Inventory of Carbon and Energy (ICE) – Version 1.6a, University of Bath, U.K. http://www.organicexplorer.co.nz/site/organicexplore/files/ICE%20Version%201.6a.pdf, accessed on Sept. 18, 2017.
[25] IAI. (2003). Life cycle assessment of aluminium: Inventory data for the worldwide primary aluminium industry. Technical report, International Aluminium Institute (IAI), Haymarket, London.
[26] ECI. (2005). Life cycle assessment of copper products, European Copper Institute. http://eplca.jrc.ec.europa.eu/ELCD3/resource/sources/5140044a-4bec-11dc-8314-0800200c9a66/ECI_LCA_of_Copper_Products_Report_5140044a-4bec-11dc-8314-0800200c9a66.pdf;jsessionid=05AF89B31CE66DD97BD02D2A07174A8E, accessed on Sept. 18, 2017.
[27] MoS. (2011). Report of the Working Group on Steel Industry for the Twelfth Five Year Plan (2012-2017), Ministry of Steel. https://mme.iitm.ac.in/shukla/wg_steel2212(1).pdf, accessed on Sept. 18, 2017.
[28] NATCOM. (2008). India’s Second National Communication to the United Nations Framework Convention on Climate Change – Work program, Ministry of Environment and Forests, Government of India. http://www.undp.org/content/dam/india/docs/united_nations_framework_convention_on_climate_change.pdf, accessed on Sept. 13, 2017.
[29] Eggleston, H.S., Buendia, L., Miwa, K., Ngara, T., Tanabe, K. (2006). IPCC Guidelines for National Greenhouse Gas Inventories, Published: IGES, Japan.
[30] Sathaye, J., Phadke, A. (2006). Cost of electric power sector carbon mitigation in India: International implications. Energy Policy, 34(13): 1619-1629. https://doi.org/10.1016/j.enpol.2004.12.010
[31] TERI. (2013). Equitable sharing of benefits arising from coal mining and power generation among resource rich states, The Energy and Research Institute, Project Report No. 2012IA06, New Delhi.
[32] Reddy, B.S. (2016). India’s energy system transition-Survival of the greenest. Renewable Energy, 92: 293-302. http://doi.org/10.1016/j.renene.2016.02.027