Lea Robič Mohar* | Matej Rajšp | Matej Požarnik
© 2021 IIETA. This article is published by IIETA and is licensed under the CC BY 4.0 license (http://creativecommons.org/licenses/by/4.0/).
OPEN ACCESS
Innovative environmental projects, selected for co-financing, must contribute to the green recovery of Europe’s economy and maintain the momentum in its transition to climate neutrality. However, measuring overall sustainable environmental efficiency of a project is a complex matter. The “GHG emission avoidance” indicator, which began to appear in the award criteria of the environmentally oriented tenders of the European cohesion policy for the Programme period 2021-2027, enables the allocation of funds based on the achieved environmental benefits. The purpose of this paper is to present theoretical background and practical calculation of the “GHG emission avoidance” indicator. An absolute and relative indicator is analysed, with which investors quantitatively evaluate the potential for avoiding emissions, generated in the case of project implementation. The research part of this article is presented through case study of a project in the sector of glass, ceramics and building materials in energy-intensive industry, in which contribution of the selected sustainable project to the EU vision for a climate-neutral economy is demonstrated.
EU environmental priorities, sustainable project, quantitative indicators, innovation fund, GHG emission avoidance
According to the European Parliament [1], the main sources of emissions of carbon dioxide (CO2), methane (CH4), nitrous oxide (N2O), sulphur hexafluoride (SF6) and (per)fluorinated hydrocarbons (PFC, HFC) are human activities, fossil fuel combustion, deforestation, and farming. By the end of the century, greenhouse gas emissions will increase global average temperature by 3.75℃ [1]. Climate change will result in natural disasters and extreme weather events (floods, droughts, torrential rains, and heat waves), forest fires, water scarcity, glacier disappearances and sea level rise, changes in the distribution (even extinction) of fauna and flora, plant diseases, scarcity food and fresh water and the migration of citizens fleeing dangers [2].
As defined by The Paris Agreement [3], European strategic long-term vision A Clean Planet for all [4] and European Green Deal [5], the goal of the EU is to become a climate-neutral economy with zero net greenhouse gas emissions by 2050.
Following the EU's climate-neutral vision [4] of 2018, the European Green Deal strategy [5] aims to increase Europe's resilience to climate change and thus improve the quality of life of present and future generations, with a modern, competitive, and resource-efficient economy. The Sustainable Europe Investment Plan [6], a pillar of the European Green Deal, encourages the adaptation of all EU policies in response to the EU's climate and environmental challenges.
Over the next decade, at least €1,000 billion of private and public sustainable investments will be mobilized from the EU budget and related instruments to combat the effects of climate change, reduce greenhouse gas emissions, and preserve Europe's natural environment.
The main investment policy of the EU remains European cohesion policy with an increased level of importance of the human performance factor on the environment. This is reflected in the new system of criteria for the development of regions, which adds indicators of youth unemployment, level of education, reception and integration of migrants and climate change to the GDP per capita indicator [7].
The second of the five main objectives under Regulation 2018/0197 [8] is a greener, carbon-free Europe, which foresees:
The main source of funding for environmental projects is the MFF 2021-2027 budget for the implementation of cohesion policy. Compared to the 2014-2020 programming period, it is by €13 billion lower. One third of the priority investment funds will be focused on the Environmentally friendly (Greening), Carbon-Free Europe objective [9].
Another source of funding is NextGenerationEU, recovery instrument for repairing economic and social damage from the COVID-19 pandemic. Rescuing of natural resources and the environment will be supported by €17.5 billion in repayable assistance and grants [9]. In the period 2021-2030, InvestEU will provide financial leverage for around €279 billion of private and public investments, related to climate and the environment. The Just Transition Mechanism will mobilize investments of at least €100 billion.
The Innovation Fund [10], the EU's strategic tool for the development of low- and carbon-free technologies for the transition to a carbon-free economy, funded by part of the proceeds from the auctioning of carbon allowances under the EU ETS scheme, will provide €25 billion for the transition of the EU on climate neutrality [9].
The selection of projects, financed from the listed sources, is based on predetermined quantitative and qualitative criteria and weights. Quantitative financial criteria evaluate the financial stability of the project, while by evaluating with qualitative non-financial criteria, the projects are ranked based on the idea, content, references, and impact [11]. Research on award criteria [12] shows that inadequate combination that favours only one aspect and neglects the others, is wrong. Projects must be selected based on the combination of quantitative and qualitative criteria [12].
In adjustments to climate change (e.g., assessment of the impact of technology, activities, or the final product on the environment), qualitative non-financial criteria were given priority in tender award criteria in the 2014-2020 programming period, however noticing that evaluators with a lack of knowledge in the field of environmental protection were subjectively assessing them. The content persuasiveness of the project was evaluated better than the measured contribution to the environment. As a result, projects with a weak environmental contribution were funded. To avoid such errors, the evaluation of projects in the MFF 2021-2027 has been upgraded to include concrete quantitative indicators.
“GHG emission avoidance” will become the leading indicator of credible sustainable environmental intent of projects and is as such already included in the award criteria of the first published public tenders of the Innovation Fund. The objective of this article is to investigate the theoretical and practical procedure for calculating that indicator and its application in energy-intensive industry sector.
The rest of this research paper is divided into four sections. Section 2 presents the used research methodology, concerning theoretical approach and research design, followed by the calculation methodology for “GHG emission avoidance” in section 3. To gain an in-depth understanding of a sustainable impact of environmental projects, a case study for “GHG emission avoidance” was performed in section 4. Section 5 presents the results through a real case study of a project in the sector of glass, ceramics and building materials. Final research findings and conclusion are presented in section 6.
The research methodology in this article includes literature review and regulatory framework study to evaluate trends within EU environmental priorities. To gain an in-depth understanding of a sustainable impact of environmental projects, a case study for “GHG emission avoidance” was performed.
Both large scale (over €7.5 million) and small scale (€2.5 -€7.5 million) projects funded by the Innovation Fund support:
They are the first to introduce an absolute and relative quantitative “GHG emission avoidance”, to determine the level of co-financing, project excellence and to ensure credible monitoring of results after the project conclusion.
With the indicator, applicants quantitatively evaluate the emission avoidance potential in the project proposal. The absolute “GHG emission avoidance” is calculated as the difference between the reference greenhouse gas emissions and the expected greenhouse gas emissions of the project scenario in the first 10 years after the start of operation. It is measured in metric tons of CO2e (CO2 equivalent) [13]:
$\Delta G H G_{a b s}=\sum_{y=1}^{10}\left(\operatorname{Re} f_{y}-\operatorname{Proj}_{y}\right)$ (1)
where, Refy are emissions, created without the realization of the project, and Projy are emissions, created after the realization of the project.
The relative “GHG emission avoidance” is calculated as the quotient of the absolute “GHG emission avoidance” and the reference greenhouse gas emissions in the first 10 years [13]:
$\Delta G H G_{r e l}=\frac{\Delta G H G_{a b s}}{\sum_{y=1}^{10}\left(R e f_{y}\right)}$ (2)
where, GHGabs is the absolute “GHG emission avoidance”, and Refy are emissions created without the realization of the project. The “GHG emission avoidance” comprehensively covers the effects of “inputs, processes and outputs” between the project and the reference scenario (current situation in supported sectors). Each project applicant submits a process block diagram for the project, a reference scenario and the expected changes (Figure 1).
Figure 1. Block diagram of processes [13]
In the block diagram, emission sources are divided into five levels, corresponding to “inputs”, “process(es)”, “products”, “use” and “end of life”:
$\Delta G H G_{a b s}=\sum_{y=1}^{10}\left(\Delta E_{\text {inputs }}+\Delta E_{\text {processes }}+\Delta E_{\text {products }}\right.$$\left.+\Delta E_{u s e}+\Delta E_{E o L}\right)$ (3)
where, ∆Einputs are emissions, occurred before the “processes” phase (energy and material inputs), ∆Eprocesses are emissions of processes related to the production of the selected main product of the project, ∆Eproducts are emissions of products (semi-finished products, components), created during the production of the main product of the project, ∆Euse are emissions in the use phase of the main product of the project, and ∆EEoL are stoichiometric (Quantitative ratios between reactants before a chemical reaction and products after a chemical reaction) carbon emissions “at the end of life-cycle”.
The project presents parameters that will include all emission sources for the duration of the project. In most cases, several parameters for the project and the reference scenario are the same, so their change in emissions is 0. During the operations, beneficiaries will have to confirm the predicted parameters as part of the monitoring of the predicted avoidance of greenhouse gas emissions. This will also be a condition for the payment of the full value of the grant awarded [13].
Table 1. Innovation Fund – classification of projects into sectors [14]
|
Category |
Sector |
Products |
|
Energy storage incl. manufacturing plants for components |
Intra-day electricity storage |
electricity |
|
Other energy storage |
electricity |
|
|
heating/cooling |
||
|
e-fuels |
||
|
hydrogen |
||
|
Renewable energy incl. manufacturing plants for components |
Wind energy |
electricity |
|
Solar energy |
electricity |
|
|
Hydro/Ocean energy |
electricity |
|
|
Geothermal energy |
electricity, CHP |
|
|
Bioelectricity |
electricity, CHP |
|
|
Renewable Heating/Cooling |
heating/cooling |
|
|
Energy Intensive Industries incl. CCU incl. substitute products incl. CCS (CO2 capture and full chain) |
Refineries |
fuels (incl. e-fuels) |
|
Biofuels and bio-refineries |
biofuel, bio-based products |
|
|
Iron & steel |
coke |
|
|
iron ore |
||
|
iron |
||
|
steel |
||
|
cast ferrous metals products |
||
|
other ferrous metal products or substitute products |
||
|
Non-ferrous metals |
aluminium |
|
|
precious metals |
||
|
copper |
||
|
other non-ferrous metal |
||
|
cast non-ferrous metal products |
||
|
other ferrous metal products or substitute products |
||
|
Cement & lime |
cement |
|
|
lime, dolime, sintered dolime |
||
|
other cement or lime products or substitute products |
||
|
Glass, ceramics & construction material |
flat glass |
|
|
container glass |
||
|
glass fibres |
||
|
other glass products |
||
|
tiles, plates, refractory products |
||
|
bricks |
||
|
houseware, sanitary ware |
||
|
other ceramic products |
||
|
mineral wool |
||
|
gypsum and gypsum products |
||
|
other construction materials or substitute products |
||
|
Pulp & paper |
chemical pulp |
|
|
mechanical pulp |
||
|
paper and paperboard |
||
|
sanitary and tissue paper |
||
|
other paper products or substitute products |
||
|
Chemicals |
organic basic chemicals |
|
|
inorganic basic chemicals |
||
|
nitrogen compounds |
||
|
plastics in primary forms |
||
|
synthetic rubber |
||
|
other chemical products or substitute products |
||
|
Hydrogen |
hydrogen |
|
|
Other |
electricity |
|
|
heat |
||
|
other |
||
|
CCS (CO2 Transport and Storage) |
CO2 Transport and Storage |
CO2 Transport and Storage |
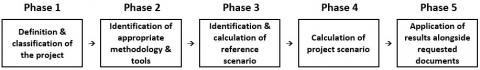
Figure 2. Phases of calculation of the “GHG emission avoidance”
Empirical analysis of the “GHG emission avoidance” is presented for a project from the Glass, ceramics & construction material sector within the Energy Intensive Industries category. The project envisages the construction of a gypsum products factory, with the final product being gypsum and gypsum products (gypsum cardboard panels). The estimated annual production is 100,000 t of gypsum plasterboards. The project implies new inputs and “beyond state of the art” based production processes. No changes are expected in the final product, nor in its use or at the end of its life (EoL).
The calculation of the “GHG emission avoidance” takes place in five phases (Figure 2):
Phase 1 – Definition of the project content, selection of the sector, primary activity, and main product according to the classification in Table 1.
Phase 2 – Selection of the appropriate methodology and tool for calculating the indicator [15] according to the selected sector and category. In the selected case, this is the European Commission's “GHG emission avoidance methodology” in energy-intensive industries (EII), including carbon capture and use (CCU), biofuels and alternative products.
Phase 3 – Defining the input conditions and calculating the emission reference parameters for production of the selected product, in line with the current EU ETS Directive [16].
The EU ETS reference value for production of gypsum plasterboard is 0.131 tCO2e/t and covers the process of manufacturing gypsum plasterboard and similar gypsum products, except for decorative products, plaster products and high-density gypsum fibre boards.
Phase 4 – Calculation of emission parameters for project activities, which are a condition for determining the absolute and relative “GHG emission avoidance”.
Phase 5 – Upload of the calculated GHG emission avoidance factors to the project application portal together with the calculation support tool. In the project scoring phase, the absolute factor of “GHG emission avoidance” is compared with the largest factor among all registered projects in the selected sector.
The reference value for a 10-year period for the estimated production capacity is equal to:
$\operatorname{Re} f_{y}=Q_{P B} \cdot \operatorname{Re} f_{P B} \cdot n$$=100,000 t \cdot 0.131^{\mathrm{tCO}_{2} \mathrm{e} / \mathrm{t} \cdot 10}$$=131,000 \mathrm{tCO}_{2} \mathrm{e}$
Table 2. Summary of calculated reference values
|
Reference rate |
Sum of t CO2e |
|
Refinputs |
- |
|
Refprocesses |
131,000 |
|
Refproducts |
- |
|
Refuse |
- |
|
RefEoL |
- |
|
Grand Total |
131,000 |
The estimated electricity consumption is 50 MWh/t, water consumption 0.2 L/t and thermal energy consumption 0.0016 TJ/t. No other input parameters are considered. The electricity emission factor is equal to 0 in accordance with the methodology [13]. Emissions for water supply are not considered, as they do not have a significant impact on the projected greenhouse gas emission estimates (emissions disregarded). A significant share of the consumed energy is covered by the required thermal energy. Emissions related to the production of gypsum boards are calculated within the input parameters for the operation of the new technology (electricity, water, heat), thus the default value of emissions from production-related processes is equal to 0:
$\operatorname{Proj}_{y}=Q_{P B} \cdot n \cdot\left(E \cdot \operatorname{Re} f_{E}+W \cdot \operatorname{Re} f_{W}+H \cdot \operatorname{Ref}_{H}\right.$$\left.+\operatorname{Proj}_{P B}\right)$
$=100,000 t \cdot 10 \cdot\left(50 \mathrm{MWh} / t \cdot 0^{\mathrm{tCO}_{2} \mathrm{e}} / \mathrm{MWh}+0.2 \mathrm{~L} / t \cdot 0 \mathrm{tCO}_{2} \mathrm{e} / \mathrm{L}\right.$
+0.0016 TJ/ $_{t} \cdot 62.3^{\mathrm{tCO}_{2} \mathrm{e}} / \mathrm{TJ}+0^{\mathrm{tCO}_{2} \mathrm{e} / \mathrm{t}}$
$=100,000 t \cdot 10 \cdot\left(0.0016^{T J} /_{t} \cdot 62.3^{\mathrm{tC} \mathrm{O}_{2} \mathrm{e}} / \mathrm{TJ}=\mathbf{9 9 , 6 8 0} \mathrm{tCO}_{2} \mathrm{e}\right.$
where, QPB is annual production capacity of gypsum plasterboards, n is number of years of operation of production infrastructure, E is the amount of electricity consumed to produce 1 t of product, RefE is the electricity emission reference factor (EU ETS Directive [16]), W is the amount of water used to produce 1 t of product, RefW is the water supply emission reference factor, H is the amount of heat energy used to produce 1 t of product, RefH is the reference factor of thermal energy emissions, and ProjPB is the emission factor of production-related processes. Summary of calculated project emission values is presented in Table 3.
Table 3. Summary of calculated project emission values
|
Project rate |
Sum of t CO2e |
|
Projinputs |
99,680 |
|
Projprocesses |
- |
|
Projproducts |
- |
|
Projuse |
- |
|
ProjEoL |
- |
|
Grand Total |
99,680 |
Considering the Methodology for GHG emission avoidance calculation, the absolute quantitative “GHG emission avoidance” is calculated:
$\Delta G H G_{a b s}=\sum_{y=1}^{10}\left(R e f_{y}-\operatorname{Proj}_{y}\right)=131,000 \mathrm{tCO}_{2} \mathrm{e}$
$-99,680 \mathrm{tCO}_{2} \mathrm{e}=31,320 \mathrm{tCO}_{2} \mathrm{e}$
with the calculation of the relative quantitative “GHG emission avoidance”:
$\Delta G H G_{r e l}=\frac{\Delta G H G_{a b s}}{\sum_{y=1}^{10}\left(R e f_{y}\right)}=\frac{31,320 \mathrm{tCO}_{2} \mathrm{e}}{131,000 \mathrm{tCO}_{2} \mathrm{e}}=23.91 \%$
The results of the calculations for the selected case show that the project avoids the 31.320 t CO2e. On a relative basis, this represents a 23.91% improvement over the reference scenario.
The methodology of the “GHG emission avoidance” allows convincing and measurable calculation of environmental benefits, estimated in the projects applied for co-financing via EU public tenders. Within this research, we have implemented the adoption of absolute and relative “GHG emission avoidance” through a case study of a project in the field of glass, ceramics and building materials in energy-intensive industries.
Calculation results enable objective quantitative measure of sustainable environmental protection intention of the project, allowing the evaluator to give a realistic assessment. Therefore, it is crucial to add quantitative environmental indicators in as many award criterias of the tenders as possible, such as e.g., “GHG emission avoidance”. A project that does not contribute to addressing the EU's environmental challenges should not be eligible for co-financing.
The first results of the success of the introduction of the “GHG emission avoidance” indicator will not be known until 2025, when the impact of completed projects will be profound. It makes sense for the EU to establish an additional, simplified methodology for determining the impact of micro and small projects in the agricultural, manufacturing and service sectors by then. That could be an interesting topic for further research.
In final conclusion, we argue that the incentives for European cohesion policy will only work by encouraging beneficiaries to quantify the sustainable effects of investment. Subjective qualitative assessment must become a thing of the past.
|
EU |
European Union |
|
GDP |
gross domestic product |
|
MFF |
multiannual financial framework |
|
GHG |
greenhouse gases |
|
ETS |
emissions trading system |
[1] European Parliament. Combating climate change. https://www.europarl.europa.eu/factsheets/en/sheet/72/klimaatverandering-en-het-milieu, accessed on Jan. 9, 2021.
[2] European Environment Agency (2017). Climate change, impacts and vulnerability in Europe 2016: An indicator-based report. Luxembourg: Publications Office of the European Union.
[3] United Nations. The Paris Agreement. https://unfccc.int/sites/default/files/english_paris_agreement.pdf, accessed on Jan. 9, 2021.
[4] European Commission. A Clean Planet for all: A European strategic long-term vision for a prosperous, modern, competitive and climate neutral economy. https://eur-lex.europa.eu/legal-content/EN/TXT/PDF/?uri=CELEX:52018DC0773&from=EN, accessed on Jan. 9, 2021.
[5] European Commission. The European Green Deal. https://eur-lex.europa.eu/resource.html?uri=cellar:b828d165-1c22-11ea-8c1f-01aa75ed71a1.0002.02/DOC_1&format=PDF, accessed on Jan. 9, 2021.
[6] European Commission. Sustainable Europe Investment Plan: European Green Deal Investment Plan. https://eur-lex.europa.eu/legal-content/EN/TXT/PDF/?uri=CELEX:52020DC0021&from=EN, accessed on Jan. 9, 2021.
[7] European Commission. Regulation (EU) No 1303/2013. https://eur-lex.europa.eu/legal-content/EN/TXT/PDF/?uri=CELEX:02013R1303-20201115&from=SL, accessed on Jan. 9, 2021.
[8] European Commission. Proposal for a regulation 2018/0197 (COD). https://eur-lex.europa.eu/resource.html?uri=cellar:8d2f7140-6375-11e8-ab9c-01aa75ed71a1.0001.02/DOC_1&format=PDF, accessed on Jan. 9, 2021.
[9] European Council. Infographic - Multiannual financial framework 2021-2027 and Next Generation EU. https://www.consilium.europa.eu/en/infographics/mff2021-2027-ngeu-final/, accessed on Jan. 9, 2021.
[10] European Commission. Innovation Fund: Driving low-carbon technologies towards the market. https://ec.europa.eu/clima/sites/clima/files/innovation-fund/innovation_fund_factsheet_en.pdf, accessed on Jan. 9, 2021.
[11] Požarnik, M., Mohar, L.R. (2016). Alternative financing of smart and sustainable business ideas. Socioeconomica, 4(8): 291-302. http://dx.doi.org/10.12803/SJSECO.48143.
[12] Požarnik, M., Mohar, L.R. (2018), Efficient mechanism for development of competitive European entrepreneurship. International Journal of Innovative Science and Research Technology, 3(10): 536-540.
[13] European Commission. Innovation Fund: Methodology for GHG Emission Avoidance Calculation. https://ec.europa.eu/info/funding-tenders/opportunities/docs/2021-2027/innovfund/wp-call/call-annex_innovfund-ssc-2020-single-stage_en.pdf, accessed on Jan. 9, 2021.
[14] European Commission. Directive 2003/87/EC, Annex 1. https://eur-lex.europa.eu/legal-content/EN/TXT/PDF/?uri=CELEX:02003L0087-20200101&from=SL, accessed on Jan. 9, 2021.
[15] European Commission. Funding & tender opportunities: Innovation Fund Small Scale Projects; Topic conditions and documents. https://ec.europa.eu/info/funding-tenders/opportunities/portal/screen/opportunities/topic-details/innovfund-ssc-2020-single-stage, accessed on Jan. 9, 2021.
[16] European Commission. Directive 2003/87/EC. https://eur-lex.europa.eu/legal-content/EN/TXT/PDF/?uri=CELEX:02003L0087-20200101&from=SL, accessed on Jan. 9, 2021.