Ajay Kumar Singh* | Bhim Jyoti | Sanjeev Kumar | Sanjaya Kumar Lenka
© 2021 IIETA. This article is published by IIETA and is licensed under the CC BY 4.0 license (http://creativecommons.org/licenses/by/4.0/).
OPEN ACCESS
This study assesses the association of sustainable development (SD) with environmental technologies, forest area and developmental indictors in selected 39 economies. It develops global sustainable development index (GSDI) as an integration of environmental sustainability index (ESI), economic development index (EDI) and social development index (SDI) during 2000-2016 using composite Z-score technique. Thereupon, it explores the influence of environmental technologies, deforestation, ESI, EDI and SDI on GSDI using country-wise panel data. The results infer that there exists a high inequality in SD due to diversity in socio-economic structure of selected countries. Most developed economies have a better position in SD due to their relatively better position in environmental, economic and social developmental related variables. India, South Africa and Tunisia have low values of ESI, EDI and SDI, thus, these countries are in worst position in SD. Empirical results exhibit that SD is positively associated with environmental, economic and social development, forest area and environmental technologies. It recommended that protection of forest area maintains the quantity and quality of natural resources and provide ecological security. Accessibility of electricity for all community, discovery of environmental technologies, use of green technologies in production activities may be effective to increase socio-economic, environmental and sustainable development.
deforestation, environmental and green technologies, global sustainable development index, environmental sustainability index, economic development index, social development index, forest area, sustainable development
Deforestation has a negative impact on global climate and ecological system [1, 2]. Thus, it has a negative impact on livelihood security and human well-being. Deforestation increased due to high population growth, overwhelming urbanization, agricultural expansion, industrialization, infrastructural development and over pressure of population on natural resources at global level. Most economies are implementing polices to achieve high economic growth in term of gross domestic product (GDP) [3, 4]. Thus, these economies are using surplus natural resources and ecosystem services (i.e., forestry, water, land, air, soil) to produce goods and services to satisfy the needs of present and growing population. As environmental development is an essential component of sustainable development (SD) [4]. However, the concept of SD is very old and that is emerged in 1972. It has more than 100 different definitions and interaction with numerous indicators and socio-economic activities in a country [5]. Hence, it is projected that SD cannot be achieved without environmental development [3, 4]. Furthermore, quality and quantity of natural resources are adversely affected due to overwhelming deforestation in most countries. Thus, extensive deforestation created a complication to maintain SD especially in developing economies. SD pursues to satisfy the demands of current generations without decline the ability of next generations to achieve their own necessities [4-6]. In above perspectives, theoretical review has shown that SD is an integration of economic, human, social, technological and environmental development [3, 4, 7-12]. Thus, it creates an appropriate bridge between economic, social and environmental development [13, 14]. A group of studies have claimed that protection of environmental factors and ecosystem services, and economic and social development are the crucial determinants of SD [5, 15-18]. Basiago [19] reviewed that economic, social and environmental sustainability are the main dimensions of SD. Guijarro and Poyatos [20] noticed that SD includes income inequality, environmental sustainability, innovation, justice and sustainable consumption of available resources. Sathaye et al. [21] claimed that environmental and economic dimensions are the main determinants of SD. Furthermore, it is also reported that economic growth and economic development directly depend upon environment and natural resources conservation in a country [1, 4]. Howes et al. [22]; Dong and Hauschild [23] explained the factors of environmental sustainability which are also significantly associated with SD. Therefore, to achieve the different goals of SD must be a prime agenda of global economies.
Moreover, recycling, minimization of waste material, substitution of materials, pollution controls, efficient use and protection of natural resources through applications of technologies in production activities are conducive to achieve sustainable development (SD) [1, 3, 5, 7, 14, 24]. Conversely, most economies are framing their policies to attain high development in economic, social and technological sectors [4] as paying low attention towards environmental development and ecological security. As forest area preserves the quality of environmental system and ecological services in term of water conservation and purification, air purification, nutrient cycling, atmospheric environmental purification, soil protection, erosion control, flood protection, carbon fixation, oxygen release and reduce solar radiation impact on human health [3, 23]. Thus, forest area protects the quality and quantity of environmental and natural resources [2, 4]. However, forest area is diminishing continuously due to overwhelming urbanization, high population growth, heavy industrialization, excessive infrastructure development and migration of population from rural to urban area and expansion in cultivated area [3]. Hence, there would be a difficult task to achieve SD without maintaining the environmental development at world-wide.
Also, there is urged to scientific research community, existing researchers and international development organizations to discover more environmental and Appropriate Technologies (AT) that must be useful to mitigate the adverse effects of deforestation on sustainable development (SD). Though, the movement of AT started in 1970, while it was an attempt to discover and design various types of technologies [7]. That time the main goals of AT was to solve the social and environmental problems efficiently [7]. Another aim of AT was to increase additional use of renewable resources and technologies in production activities to increase economic and social development [7]. Thus, use of AT in production activities work as a key driver to maintain economic, social and environmental development at micro level [25]. Hence, the necessary role of AT is to maintain environmental development and consequently is helpful to attain SD. At present environmental scientists and researchers are working to discover environmental and green technologies, and scientific process which can be used to produce goods and services. Environmental technologies are useful to reduce pollution that is generated due to production activities and provide new material, energy and resource-efficient production process [24]. As environmental technologies create a bridge between economic, social and environmental development [24]. Most researchers and scientists, therefore, claimed that environmental and green technologies are essential for environmental sustainability. Thus, applications of environmental and green technologies are helpful to decouple environmental pollution and resources, thus, both may be useful to achieve SD [5, 16, 24-27]. Gavin [28] also argued that extensive applications of environmental technologies will be conducive to reduce risk for environmental degradation. Matin et al. [29] have noticed that environmental and social development cannot be separated form sustainability. Shafiei and Abadi [30] have also mentioned that environmental and ecosystem friendly technologies would be supportive for SD. Nevertheless, a group of researchers claimed that technologies may be harmful for environment and ecosystem services, if it does not reduce or mitigates the negative consequences of production activities on environmental and natural resources [7]. Urban [31] have conceptually proved that innovation in the environmental field is beneficial to increase SD. Anadon et al. [32] have perceived that SD is positively associated with science & technological development. Armenanu et al. [6] have also highlighted the significance of technologies in SD.
Furthermore, several studies provided a hypothetical aspect on prominence of environmental and green technologies in sustainable development (SD) [20, 27, 30-33]. However, limited research could provide a scientific and empirical evidence on association of environmental and green technologies with SD [31]. Furthermore, existing researchers and research academia could not develop a scientific and universally acceptable method and indicators for measurement of SD. For this, previous studies have created global sustainable development index as an integration of economic, social and environmental development, sustainable development goal index and national sustainable development index using different methods [4, 14, 20, 25, 34, 35]. Based on estimated sustainable development index, most studies claimed that performance of a country in SD depend upon chosen method and undertaken indicators [25, 34, 36]. However, these studies could not assess the interconnection of SD with indicators of economic, social and environmental development. Also, existing researchers such as Singh et al. [3], Singh et al. [4], Armenanu et al. [6], Beder [7] Phimphanthavong [15], Kongoli [17], Singh and Issac [24], Miola and Schiltz [34], Nagy et al. [36] have addressed the answer on various research questions with regards to selection of appropriate indicators for assessment of sustainable development (SD) that are presented here:
Based on aforesaid research question, the present study is accomplished following objectives:
2.1 Selection of countries and explanation of data sources
This study generates the global sustainable development index (GSDI) as an integration of environmental sustainability index (ESI), economic development index (EDI) and social development index (SDI). These indexes are created for 39 selected economies (Refer to Table 1) during 2000–2016. For above-mentioned investigations, all required data are segregated from World Bank, Food and Agriculture Organization United Nations Development Programme, Yale Center for Environmental Law and Policy (Yale University), Center for International Earth Science Information Network, Colombia University, World Intellectual Property Organization, and Organization for Economic Co-Operation and Development. Interpolation and extrapolation methods is used to determine the missing values in time series for those variables which do not had the values for middle years [3, 4, 12, 24, 37]. Microsoft excel worksheet, C++ and SPSS statistical software are used for descriptive analysis, and STATA statistical software is used to run the proposed regression models.
Table 1. List of selected countries with region and income group
|
Region of the Country |
Income group of the Country |
Country |
|
Northern European and Pacific oceans |
High income: OECD |
Sweden, Finland |
|
Europe and Central Asia |
Switzerland, Norway |
|
|
Southwestern Pacific Ocean |
New Zealand |
|
|
North America |
Canada |
|
|
Northern, Central and Southern European |
Estonia, Portugal |
|
|
North-western and Northern European Europe |
Netherlands, Australia |
|
|
Western European |
France, Germany, Denmark |
|
|
Europe & Central Asia |
Upper middle income |
Lithuania, Latvia, Romania |
|
North-western Europe |
High income: OECD |
United Kingdom |
|
Central and South-eastern, Europe |
Greece |
|
|
Central and Southeast Europe |
High income: non OECD |
Croatia |
|
Central & Western Europe |
High income: OECD |
Czech Republic, Poland, Hungary, Slovak Republic, Spain, Austria, Luxembourg, Belgium |
|
Latin America and Sub-Saharan Africa |
Upper middle income |
Argentina, South Africa, Mexico |
|
High income: OECD |
United States |
|
|
Upper middle income |
Brazil |
|
|
Europe & Central Asia |
Lower middle income |
Moldova, Russia |
|
South Asia |
India |
|
|
East Asia & Pacific |
Upper middle income |
China |
|
Middle East & North Africa |
Tunisia |
|
|
Asia and the Pacific |
High income: OECD |
Japan, South Korea |
2.2 Overview of different indexes in socio-economic developmental activities
Index-based estimation is very important and vital concept in research and developmental field of all studies [3, 4, 14, 38, 39]. It is an effective policy tools in developmental field [3, 4, 14]. Scientific research community, existing researchers and international development organizations have created several indexes such as human development index, physical quality life index, small business optimism index, global happiness index, ease of doing business index, global competitive index, economic freedom index, corruption perception index, civil liberties index, global manufacturing index, business environment index, buyer sophistication index, firm level technology absorption index, logistic performance index, market potential index, entrepreneurship and development index, global peace index, food security index, livelihood security index, sustainable livelihood security index, global slavery index, global liveability index, economic development index, social development index, socio-economic development index, environmental sustainability index, environmental performance index, energy sustainability index, energy performance indices, consumer price index, insomnia severity index, climatological index, climate variability index, index system of agricultural sustainable development capability, agricultural sustainability index, water quality index, global sustainable development index, global sustainable development goals index and other indexes. Above indexes used as a proxy for assessing the relative or absolute progress of specific socio-economic and other activities for a county or across economies or across entities [3, 4, 12, 14, 20, 24, 35, 36, 38-44]. Any index can be developed using primary and secondary data for a specific socio-economic activity at micro to macro level.
Existing studies such as Singh et al. [4], Jin et al. [14], Guijarro and Poyatos [20], Miola and Schiltz [34], Negy et al. [36] developed sustainable development index as an integration of indicators related to environmental sustainability, economic development and social development. However, previous studies such as Miola and Schiltz [34] argued that country's performance in sustainable development depends upon chosen method and indicators. Thus, it is very important to select the most related variables in the area of environmental development, economic development and social development to develop sustainable development index. Available literature and theories are used to select the suitable variables and method to generates GSDI, ESI, EDI and SDI in this study.
2.3 Selected variables for estimation of environmental sustainability index (ESI)
Environmental performance or sustainability may not be measured through a single indicator of a country [3, 4]. Environmental sustainability is a very crucial for well-being of humanity in a nation [44]. It is significantly associated with CO2 emissions from solid fuel consumption (% of total), CO2 intensity (kg/kg of oil equivalent energy use), PM2.5 air pollution, mean annual exposure (micrograms per cubic meter), renewable electricity output (% of total electricity output), electricity production from natural gas sources (% of total), electricity production from coal sources (% of total), combustible renewables and waste (% of total energy), energy use (kg of oil equivalent), access to clean fuels and technologies for cooking (percentage of population), forest area (percentage of total land area), agricultural land (percentage of total land area), fertilizer consumption (kilogram/hectare arable land), population growth (annual %), population density (in number), urbanization (ratio of urban population with rural population) and others [2, 3, 4, 9, 11, 44, 45]. However, scientific research community could not discover a universally acceptable measurement of environmental sustainability and its variables. In order to avoid the aforementioned inconsistency, Singh et al. [3] and Singh et al. [4] created an ESI to measure the environmental development for 22 Asian economies and selected global countries correspondingly. Sands and Podmore [40] developed environmental sustainability index (ESI) to measure the performance of agricultural system. Dash [44] also created ESI in Indian states. ESI measures the relative performance of environmental achievements of specific region or country as compared to others [3, 4, 44]. Thus, prior researchers used ESI as a best measurement of overall progress of environmental sustainability [3, 4]. ESI is the compilation of different factors which are useful to increase or decrease the quality of environment. In this study, 41 different variables are considered to develop ESI. Furthermore, these factors are divided into 8 different groups which are explained as: (i) Air quality and pollution, (ii) Energy management, (iii) Forest and bio-diversity, (iv) Human health and disaster, (v) Land use pattern and agriculture, (vi) Population pressures on ecosystem services, (vii) Demographic changes and (viii) Water generation management [3, 4, 23, 44, 45]. The brief explanation of selected 41 factors is presented in Table 2.
Table 2. List of factors to develop ESI
|
Symbol |
Factors |
Group of Factors |
Unit |
Source |
|
AEPP |
Access to electricity (% of population) |
Air quality and pollution |
% |
WDI, World Bank (extracted year 2018)
|
|
COET |
CO2 emissions from transport (% of total fuel combustion) |
% |
||
|
COEMIC |
CO2 emissions from manufacturing industries and construction (% of total fuel combustion) |
% |
||
|
COEEHP |
CO2 emissions from electricity and heat production, total (% of total fuel combustion) |
% |
||
|
PCCOE |
CO2 emissions (metric tons per capita) |
Tons |
||
|
COEKPGDP |
CO2 emissions (kg/US$ of GDP) |
Kg |
||
|
COEGFC |
CO2 emissions from gaseous fuel consumption (% of total) |
% |
||
|
COERBCPS |
CO2 emissions from residential buildings and commercial and public services (% of total fuel combustion) |
% |
||
|
COESFC |
CO2 emissions from solid fuel consumption (% of total) |
% |
||
|
COIKPKOEU |
CO2 intensity (kg/kg of oil equivalent energy use) |
Kg |
||
|
COEOS |
CO2 emissions from other sectors, excluding residential buildings and commercial and public services (% of total fuel combustion) |
% |
||
|
PMAPMAPCM |
PM2.5 air pollution, mean annual exposure (micrograms per cubic meter) |
Microgram |
||
|
PMAPPELE |
PM2.5 air pollution, population exposed to levels exceeding WHO guideline value (% of total) |
% |
||
|
EPCPC |
Electric power consumption (kWh per capita) |
KWh |
||
|
TNRRGDP |
Total natural resources rents (% of GDP) |
% |
||
|
REO |
Renewable electricity output (% of total electricity output) |
Energy management |
% |
|
|
EPNGS |
Electricity production from natural gas sources (% of total) |
% |
||
|
EPCS |
Electricity production from coal sources (% of total) |
% |
||
|
EPHS |
Electricity production from hydroelectric sources (% of total) |
% |
||
|
EPNS |
Electricity production from nuclear sources (% of total) |
% |
||
|
EPOS |
Electricity production from oil sources (% of total) |
% |
||
|
EPRS |
Electricity production from renewable sources, excluding hydroelectric (% of total) |
% |
||
|
EPOGCS |
Electricity production from oil, gas and coal sources (% of total) |
% |
||
|
CRW |
Combustible renewables and waste (% of total energy) |
% |
||
|
FFEC |
Fossil fuel energy consumption (% of total) |
% |
||
|
EUKOEPC |
Energy use (kg of oil equivalent per capita) |
Kg |
||
|
REC |
Renewable energy consumption (% of total final energy consumption) |
% |
||
|
ACFTC |
Access to clean fuels and technologies for cooking (% of population) |
% |
||
|
FA |
Forest area (% of total land area) |
Forest and bio-diversity |
% |
|
|
FR |
Forest rents (% of GDP) |
% |
||
|
IMR |
Infant mortality rate (per 1,000 live births) |
Human health and disaster |
Number |
|
|
PUBSS |
People using at least basic sanitation services (% of population) |
% |
||
|
PALEI |
Percentage of arable land equipped for irrigation (in %) |
Land use and agriculture |
% |
FAO (extracted year 2018) |
|
AgLPLA |
Agricultural land (% of land area) |
% |
WDI, World Bank (extracted year 2018) |
|
|
FCPHAL |
Fertilizer consumption (kilogram/hectare of arable land) |
Kg/Ha |
||
|
PGR |
Population growth (annual %) |
Population pressures on ecosystem services |
% |
|
|
TFR |
Fertility rate total (births/woman) |
Number |
||
|
PD |
Population density (in number) |
Demographic changes |
Number |
WDI, World Bank (extracted year 2018) |
|
UR |
Urbanization (Ratio of urban population with rural population) |
Number |
||
|
RIFWRPC |
Renewable internal freshwater resources per capita (cubic meters) |
Water generation management |
Cubic meters |
WDI, World Bank (extracted year 2018) |
|
PUBDWS |
People using at least basic drinking water services (% of total population) |
% |
Source: Sathler et al. [2], Singh et al. [3], Singh et al. [4], Duran et al. [9], Tampakoudis et al. [16], Singh and Issac [24], Matin et al. [29], Siche et al. [41], Dash [44]
Table 3. Brief description on factors of EDI
|
Symbol |
Sub-factors |
Unit |
Source |
|
PCGDP |
GDP per capita (constant 2010 US$) |
US $ |
WDI, World Bank
|
|
PPGDPE |
GDP per person employed (constant 2011 PPP $) |
US $ |
|
|
TVE |
Total vulnerable employment (% of total employment) |
% |
|
|
TWSW |
Total wage and salaried workers (% of total employment) |
% |
|
|
TSE |
Total self-employed (% of total employment) |
% |
|
|
FDINI |
Foreign direct investment net inflows (% of GDP) |
% |
|
|
AIGDPD |
Inflation GDP deflator (annual %) |
% |
|
|
EGS |
Exports of goods and services (% of GDP) |
% |
|
|
GCF |
Gross capital formation (% of GDP) |
% |
|
|
TLFPR |
Labor force participation rate, total (% of total population ages 15+) |
% |
|
|
GFCF |
Gross fixed capital formation (% of GDP) |
% |
|
|
TE |
Employers, total (% of total employment) |
% |
|
|
FCE |
Final consumption expenditure (% of GDP) |
% |
|
|
TUPTLF |
Total unemployment (% of total labor force) |
% |
Source: Sathler et al. [2], Singh et al. [3], Singh et al. [4], Armenanu et al. [6], Duran et al. [9], Singh et al. [12], Tampakoudis et al. [16]
2.4 Selected variables for estimation of economic development index (EDI)
As economic development is positively and negatively associated with several activities in a country, thus, it may not be measured with a single indicator [4, 46]. Hence, measurement of economic development is complex and debatable for academicians and researchers. Therefore, previous studies argued that integration of economic development related variables can be used to assess the progress of economic development. Thus, economic development index (EDI) may be an operative tool for assessment the economic development [4, 40, 46]. Singh et al. [4], Singh et al. [46] developed economic development index (EDI) to assess the relative performance of cross countries in economic development. In this study, EDI is defined as a relative index which shows the progress of a specific country in economic development as compared to others [4, 12, 46]. Therefore, following factors are included to create the EDI in this study: GDP per capita (constant 2010 US),GDPperpersonemployed(constant2011PPP), total vulnerable employment (% of total employment), total wage and salaried workers (% of total employment), total self-employed (% of total employment), foreign direct investment net inflows (% of GDP), inflation GDP deflator (annual %), exports of goods and services (% of GDP), gross capital formation (% of GDP), total labor force participation rate (% of total population ages 15+), gross fixed capital formation (% of GDP), total employers (% of total employment), final consumption expenditure (% of GDP), and total unemployment (% of total labor force) [3, 4, 9, 6, 12, 14, 46, 47]. The brief explanation of above-mentioned variables is presented in Table 3.
2.5 Selected variables for estimation of social development index (SDI)
Social development is significantly associated with various factors and it may not be observed through one indicator in a country [4, 46]. Yet, earlier studies considered a single factor like literacy rate, sex ratio, women participation rate or other variable as a proxy for social development [4, 12, 46]. Therefore, earlier studies, such as Singh et al. [4], Singh et al. [12], Singh et al. [46], therefore, created social development index (SDI) to avoid aforementioned contradiction. SDI may be a best tool for measurement of social development [4, 12, 14, 46].
Existing literature defined SDI as a composite index of several factors which have significant influence on social development [4, 12, 14]. It is a relative index that makes the comparison of cross economies in social development [4, 12]. This study, therefore, considered most related factors which have significant implication on social development. Following variables are included to create SDI in this study: sex ratio at birth (male births/female births), ratio of female to male labor force participation rate (%), female labor force (% of total labor force), female unemployment (% of female labor force), mortality rate, female infant rate (per 1,000 live births), total life expectancy at birth (years), education expenditure (% of GNI), age dependency ratio (% of working-age population) and fixed telephone subscriptions (per 100 people) [3, 4, 14, 24, 47]. Aforesaid variables are the crucial variables to sustain the social equity and social development of country. The concise clarification of variables is presented in Table 4.
Table 4. Brief explanation on factors of SDI
|
Symbol |
Factors |
Unit |
Source |
|
SRB |
Sex ratio at birth (male births per female births) |
Number |
WDI, World Bank |
|
RFMLFPR |
Ratio of female to male labor force participation rate (%) |
% |
|
|
FLF |
Female labor force (% of total labor force) |
% |
|
|
FUPFLF |
Female unemployment (% of female labor force) |
% |
|
|
FIMR |
Female infant mortality rate (per 1,000 live births) |
Number |
|
|
LEB |
Total life expectancy at birth (years) |
Years |
|
|
EEPGNI |
Education expenditure (% of GNI) |
% |
|
|
ADR |
Age dependency ratio (% of working-age population) |
% |
|
|
FTSPPP |
Fixed telephone subscriptions (per 100 people) |
Number |
Source: Singh et al. [3], Singh et al. [4], Armenanu et al. [6], Singh et al. [12], Duran et al. [9], Singh et al. [12].
2.6 Integration of ESI, EDI and SDI as a GSDI
More than 100 factors of sustainable development (SD) discussed by scientific research community [4, 5, 7-9, 14-16]. Furthermore, existing studies used various factors which are helpful to meet the 17 goals of sustainable development (SDGs) and measurement of SD [14]. Furthermore, earlier studies have reported that SD is an integration of economic, social and environmental development [3, 4]. Kusdiantoro et al. [48] developed the sustainable development index as composite index of factors associated with economic, social, ecology and institutional development in Indonesia. Jin et al. [14] planned a national sustainable development index as an assessment of sustainable development in global countries. Hence, factors related to economic, social and environmental development must be comprised as an index for measurement of SD [4, 9, 14, 34, 35]. Global sustainable development index (GSDI) is used as a combination of environmental sustainability index (ESI), economic development index (EDI) and social development index (SDI) in this study. Hereafter, GSDI is considered as linear average sum of ESI, EDI and SDI [3, 4, 10, 20].
For above exploration, this study used composite Z-score technique which is based on normalization-score or normalization-index or composite-index of a specific variable across entities. Normalization-score, thus, shows the relative performance across entities in a specific indicator. Hence, if the specific variable is positively associated with output than normalization-index (composite-index) for corresponding variable is estimated as [3, 4, 12, 14, 38, 39, 41, 44, 46]:
[NI]i,c,t = {[(X)i,c,t – Min (X)i,c,t]/[Max (X)i,c,t – Min (X)i,c,t]} (1)
Here, NIi,c,t is a normalization–index (NI) for ith variable in cross-sectional country (c) in time (t). (X)i,c,t, Min (X)i,c,t and Max (X)i,c,t are the actual, lowest and highest values respectively in each series of a specific variable across countries (c) in time (t). Above-mentioned process recursively applied for each variable individually across years. Values of normalization-index (NI) lies between 0 to 1 for corresponding variables [3, 4, 12, 20, 24, 38, 39, 46, 48, 49]. If the specific variable is negatively associated with output than NI is estimated as:
NIi,c,t = {[Xi,c,t – Max(Xi,c,t)]/[Min(Xi,c,t)- Max(Xi,c,t)]} (2)
After creating normalization–index of all variables, ESI, EDI and SDI are considered as an average linear sum of all associated variables under each category of developmental indicator [4, 41, 49]. Accordingly, GSDI is estimated as linear average sum of ESI, EDI and SDI, which is estimated as:
GSDI = (ESI + EDI + SDI)/3 (3)
Here, GSDI is global sustainable development index; ESI, EDI and SDI are the environmental sustainability index, economic development index and social development index respectively in Eq. (3).
2.7 Formulation of Empirical Model
This study is desired to assess the effect of developmental indicators on sustainable development (SD). For this investigation, GSDI is used as a representative indicator for SD. In this study, GSDI is used as a dependent variable and other indicators are used as explanatory variables. The proposed empirical model is adopted from exiting studies such as: Singh and Issac [3], Singh et al. [4], Singh et al. [12], Singh and Issac [24], Singh and Sharma [38], Samimi et al. [43], Mainali et al. [50], Kumar et al. [51], Kumar et al. [52], Ashraf and Singh [53] which also used estimated indexes as a dependent and independent variable for different purposes. Therefore, this study assumes that global sustainable development index (GSDI) is a function of environmental sustainability index (ESI), economic development index (EDI), social development index (SDI), percentage share of patented environmental technologies in all patented technologies (PPAFET) and growth in forest area (GFA). In mathematically, the aforesaid relationship can be specified as:
(GSDI) = f(ESI, EDI, SDI, PPAFET, GFA) (4)
Here, GSDI is global sustainable development index, ESI is environmental sustainability index, EDI is economic development index, SDI is social development index, PPAFET is percentage share of patented environmental technologies and GFA is growth in forest area. After incorporating the linear regression model, the aforementioned function is used as:
(GSDI)ct =α0 +α1(ESI)ct +α2(EDI)ct +α3(SDI)ct +α4(PPAFET)ct +α5(GFA)ct +ʎct (5)
Here, the explanation of GSDI, ESI, EDI, SDI and PPAFET, GFA are given in Eq. (4). Here, PPAFET used as a proxy for environmental technologies and GFA used as a proxy for deforestation. c is the cross-sectional country and t is time period. α0is the constant term, α1… α6 are the regression coefficients of associated variables and ʎct is the error term in Eq. (5). Similarly, non-linear and log-linear regression models also used to assess the association of GSDI with ESI, EDI, SDI, PPAFET and GFA.
As this study used country-wise panel of various indicators during 2000-2016. Thus, the regression coefficients of explanatory variables are estimated using linear regression correlated panels corrected standard errors model to reduce the presence of cross-sectional dependency, heteroskedasticity, serial-correlation and auto-correlation in the panel data [3, 4, 12, 24, 51-56]. Also, Ramsay RESET test [37, 55, 56], and Akaike Information Criterion (AIC) and Schwarz Information Criteria (BIC) are used to check the validity of model and consistency of regression coefficients of explanatory variables in the proposed models [3, 4, 54-56].
3.1 Descriptive results
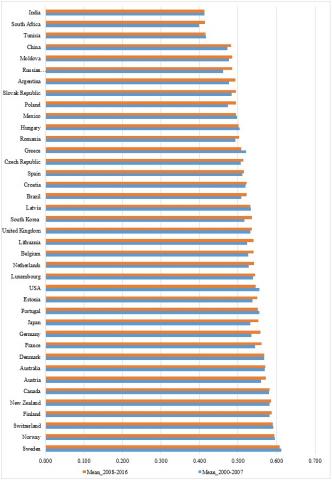
Figure 1 shows the average values of GSDI for two periods i.e., 2000-2007 and 2008-2016 for selected economies. Accordingly, the ranking of undertaken countries in sustainable development, environmental sustainability, economic development and social development based on mean values (during 2000-2016) of GSDI, ESI, EDI and SDI respectively is presented in Table 5. As the estimated values of GSDI lie between 0.413-0.609 during 2008-2016, thus it infers that there is an existence of high variation in sustainable development (SD) across economies. Sweden, Norway and Switzerland, Finland, New Zealand, Canada, Austria, Australia, Denmark, France, Germany, Japan, Portugal, Estonia, USA, Luxembourg, Netherlands, Belgium, Lithuania, United Kingdom, South Korea, Latvia, Brazil, Croatia, Spain, Czech Republic, Greece, Romania and Hungry have the value of GSDI more than 0.5 during 2008-2016. Thus, these economies have a better position in SD as compared to other economies. These economies could create an effective ecosystem to maintain SD due to their consistent contribution to prevent the environmental and natural resources factors.
India, South Africa and Tunisia have 39th, 38th and 37th ranks respectively as per the estimated values of GSDI during 2000-2007. Thus, these economies have deprived position in SD among the 39 economies. High population growth, overwhelming urbanization, excessive industrialization, extensive dependency of population on agriculture sector, overwhelming deforestation, low applications of green technologies in production activities, extreme poverty, low per capita income, income inequality, low R&D expenditure, low literacy rate, low quality of education, ineffective mechanism of government policies, poor health and sanitation facilities and high gender discrimination are the crucial reasons for these economies to make their poor position in SD. Moreover, extreme poverty, low jobs opportunities, high income inequality, extreme corruption, high illiteracy and political instability are creating obstacles to achieve the goals of SD in these economies. Thus, these economies are required to implement an effective and conducive policy to increase the SD. Mexico, Poland, Slovak Republic, Moldova and China have better position in SD as compared to South Africa, India and Tunisia. Most developed economies like Sweden, Norway, Switzerland, Finland, New Zealand, Canada, Australia, Denmark, Austria, Portugal, France, USA, Germany, Estonia, Japan, Luxembourg, Netherlands, United Kingdom, and Belgium adopted effective and conducive social and economic policies to make their clean environment.
Accordingly, these economies have better position in SD as compared to developing and largely agrarian economies. These economies could provide electricity to all population; thus, these are able to improve the quality and quantity of environmental and natural resources. Mainali et al. [50] suggested that more applications of electricity would be beneficial to maintain clean environment in developing economies. Moreover, these economies have a low population growth, urbanization and industrialization. Therefore, these countries are also able to maintain the balance in natural resources due to migration of population from rural to urban areas. Consequently, these economies could mitigate the adverse impact of urbanization, population growth and industrialization on natural resources. Accordingly, these economies could create an effective platform for SD.
Sweden, Finland and Norway have 1st, 2nd and 3rd position in environmental sustainability among the 39 economies, thus, these economies have better infrastructure to increase environmental development. South Africa, India and Luxembourg have 39th, 38th and 37th position respectively in environmental sustainability. Thus, there is essential for these economies to improve their position in environmental sustainability though implementing conducive policies such as water management and conservation, and protection of ecosystem services. Furthermore, the values of ESI lie between 0.623-0.418 for across countries. Therefore, it infers that there is high variation in environmental sustainability in the 39 countries. It is also seemed that Switzerland, Luxembourg and Australia have a better performance in economic development as compared to other economies. It is concluded that economic development is varied across countries due to diversity in social and economic development associated factors. As per the values of SDI, it is also found that most countries such as Sweden, Denmark, Norway, France, Switzerland, United Kingdom, New Zealand, Finland, Germany, Canada, USA, Lithuania, Australia, Belgium, Netherlands, Luxembourg, Portugal, Estonia, Latvia, Croatia, Hungry, Moldova, South Korea, Spain, Argentina and Czech Republic have better position in social development. India, Tunisia and South Africa have 39th, 38th and 37th position respectively in social development. These countries, therefore, need to increase their situation in social development. Moreover, it is observed that there exist is high variation in values of GSDI, ESI, EDI and SDI for all countries (except Sweden).
3.2 Viability and credibility of estimated indexes
Credibility of estimated index is an important task in academic research. It increases the unanimity among the existing researchers about estimated indexes [3, 4, 12, 24, 51, 52, 53]. Singh et al. [3], Singh et al. [4], Singh et al. [12], Singh and Issac [24], Kumar et al. [51], Kumar et al. [52], Ashraf and Singh [53] also argued that an index has viability or credibility when it has positive or negative but statistically significant correlation with its internal or external indicators. While, the internal and external indicators can be selected based on exiting literature review and theories. Thus, correlation coefficients of GSDI with ESI, EDI, SDI, percentage share of patent applications files in environmental technology and forest area (FA) are estimated to check credibility and viability of aforesaid indexes. Table 6 provides the results for Karl-Pearson correlation coefficient of GSDI with ESI, EDI, SDI, percentage share of patent applications files in environmental technology (ET) and forest area (FA). The estimates infer that the association of GSDI with ESI, EDI, SDI and FA are positive and statistically significant. Thus, estimated indexes have credibility and these indexes also can be used to make a rational prediction. It also indicates that above-mentioned indexes may be used for further empirical investigations. Singh et al. [3], Singh et al. [4], Singh et al. [12], Singh and Issac [24], Kumar et al. [51], Kumar et al. [52], Ashraf and Singh [53] also used afore-mentioned technique to check the validity of estimated indexes. Additionally, the results recommend that SD to be improved as increase in environmental, economic and social development, and forest area at world-wide.
Source: Author’s Estimation
Figure 1. Performance of selected economies in sustainable development
Table 5. Values of GSDI, ESI, EDI and SDI for selected countries during 2000-2016
|
Country |
GSDI |
ESI |
EDI |
SDI |
||||
|
Value |
Rank |
Value |
Rank |
Value |
Rank |
Value |
Rank |
|
|
Sweden |
0.611 |
1 |
0.623 |
1 |
0.441 |
13 |
0.767 |
1 |
|
Norway |
0.595 |
2 |
0.586 |
3 |
0.457 |
9 |
0.744 |
3 |
|
Switzerland |
0.591 |
3 |
0.525 |
12 |
0.512 |
1 |
0.736 |
5 |
|
Finland |
0.585 |
4 |
0.607 |
2 |
0.432 |
20 |
0.716 |
8 |
|
New Zealand |
0.584 |
5 |
0.569 |
6 |
0.457 |
8 |
0.727 |
7 |
|
Canada |
0.581 |
6 |
0.569 |
5 |
0.460 |
7 |
0.715 |
10 |
|
Australia |
0.570 |
7 |
0.509 |
16 |
0.495 |
3 |
0.706 |
13 |
|
Denmark |
0.569 |
8 |
0.505 |
18 |
0.447 |
12 |
0.754 |
2 |
|
Austria |
0.566 |
9 |
0.547 |
9 |
0.455 |
10 |
0.697 |
16 |
|
Portugal |
0.554 |
10 |
0.541 |
10 |
0.436 |
17 |
0.685 |
19 |
|
France |
0.554 |
11 |
0.499 |
22 |
0.421 |
23 |
0.740 |
4 |
|
USA |
0.551 |
12 |
0.501 |
20 |
0.441 |
16 |
0.710 |
11 |
|
Germany |
0.548 |
13 |
0.499 |
23 |
0.428 |
21 |
0.716 |
9 |
|
Estonia |
0.544 |
14 |
0.551 |
8 |
0.418 |
25 |
0.662 |
20 |
|
Japan |
0.543 |
15 |
0.519 |
13 |
0.422 |
22 |
0.689 |
18 |
|
Luxembourg |
0.543 |
16 |
0.434 |
37 |
0.504 |
2 |
0.689 |
17 |
|
Netherlands |
0.535 |
17 |
0.453 |
34 |
0.452 |
11 |
0.701 |
15 |
|
United Kingdom |
0.535 |
18 |
0.463 |
31 |
0.408 |
27 |
0.733 |
6 |
|
Belgium |
0.534 |
19 |
0.459 |
32 |
0.441 |
14 |
0.702 |
14 |
|
Lithuania |
0.533 |
20 |
0.512 |
14 |
0.380 |
36 |
0.707 |
12 |
|
Latvia |
0.532 |
21 |
0.561 |
7 |
0.405 |
29 |
0.632 |
21 |
|
South Korea |
0.527 |
22 |
0.492 |
24 |
0.475 |
5 |
0.615 |
25 |
|
Croatia |
0.521 |
23 |
0.536 |
11 |
0.399 |
31 |
0.629 |
22 |
|
Brazil |
0.516 |
24 |
0.578 |
4 |
0.405 |
28 |
0.565 |
34 |
|
Greece |
0.514 |
25 |
0.501 |
21 |
0.441 |
15 |
0.600 |
29 |
|
Spain |
0.513 |
26 |
0.510 |
15 |
0.419 |
24 |
0.611 |
26 |
|
Czech Republic |
0.511 |
27 |
0.492 |
25 |
0.435 |
18 |
0.607 |
28 |
|
Hungary |
0.503 |
28 |
0.475 |
28 |
0.411 |
26 |
0.623 |
23 |
|
Romania |
0.498 |
29 |
0.506 |
17 |
0.399 |
32 |
0.590 |
32 |
|
Mexico |
0.496 |
30 |
0.484 |
26 |
0.433 |
19 |
0.571 |
33 |
|
Slovak Republic |
0.489 |
31 |
0.504 |
19 |
0.399 |
30 |
0.565 |
35 |
|
Argentina |
0.485 |
32 |
0.475 |
29 |
0.373 |
37 |
0.609 |
27 |
|
Poland |
0.485 |
33 |
0.474 |
30 |
0.389 |
35 |
0.592 |
31 |
|
Moldova |
0.481 |
34 |
0.436 |
36 |
0.390 |
34 |
0.617 |
24 |
|
China |
0.477 |
35 |
0.453 |
33 |
0.492 |
4 |
0.486 |
36 |
|
Russian Federation |
0.474 |
36 |
0.479 |
27 |
0.350 |
38 |
0.593 |
30 |
|
Tunisia |
0.416 |
37 |
0.446 |
35 |
0.393 |
33 |
0.409 |
38 |
|
India |
0.413 |
38 |
0.433 |
38 |
0.463 |
6 |
0.343 |
39 |
|
South Africa |
0.407 |
39 |
0.418 |
39 |
0.347 |
39 |
0.456 |
37 |
Source: Author’s estimation.
Table 6. Linkages of GSDI with ESI, EDI, SDI and other indicators
|
Indicators |
GSDI |
ESI |
EDI |
SDI |
PPAFET |
FA |
|
GSDI |
1 |
0.719** |
0.509** |
0.919** |
-0.077* |
0.434** |
|
ESI |
0.719** |
1 |
0.118** |
0.517** |
-0.034 |
0.700** |
|
EDI |
0.509** |
0.118** |
1 |
0.278** |
-0.184** |
0.075 |
|
SDI |
0.919** |
0.517** |
0.278** |
1 |
-0.02 |
0.260** |
|
PPAFET |
-0.077* |
-0.034 |
-0.184** |
-0.02 |
1 |
0.054 |
|
FA |
0.434** |
0.700** |
0.075 |
0.260** |
0.054 |
1 |
Source: Author’s estimation. Note- **: Correlation coefficient is significant at the 0.01 level and *: Correlation coefficient is significant at the 0.05 level. GSDI: Global sustainable development index; ESI: Environmental sustainability index; EDI: Economic development index; SDI: Social development index; PPAFET: Percentage of patent applications files in environmental technology; FA: Forest area as a % of land area.
3.3 Influence of ESI, EDI, ET and forest area on GSDI
Table 7 shows the empirical results which examine the influence of ESI, EDI, SDI, ET and forest area on GSDI. Regression coefficients of explanatory variables are estimated using linear, log-linear and non-linear regression models. As log-linear regression model produce lowest values of AIC and BIC as compared to linear and non-linear regression models. Thus, this model provides consistent regression coefficients of explanatory variables. Accordingly, it explains the statistical interpretation of results based on log-linear regression model. The estimates imply that GFSI has a positive and statistically significant association with ESI, EDI, SDI, PPAFET and GFA. Here, it is argued that sustainable development (SD) will improve as increase in environmental, economic and social development. Earlier studies have also claimed that SD in an integration of above-mentioned developmental related indicators [3, 4, 7-9, 12]. These results are also supported by R-squared value i.e., 1.00 and it shows that 100% variation in sustainable development can be captured through environmental, economic and social development related factors.
Table 7. Impact of ET, SDEI, EDI and forest area on GSDI
|
Dependent Variable: Global Sustainable Development Index (GSDI) |
||||||
|
Model's Name |
Linear Regression Model |
Log–linear Regression Model |
Non-linear Regression Model |
|||
|
No. of Obs. |
663 |
618 |
663 |
|||
|
Mean of VIF |
1.26 |
1.29 |
172.63 |
|||
|
R-squared |
1.0000 |
0.9976 |
1.0000 |
|||
|
Wald Chi2(15) |
1.19e+09 |
1.12e+06 |
1.45e+09 |
|||
|
Prob>Chi2 |
0.0000 |
0.0000 |
0.0000 |
|||
|
AIC |
-11809.5 |
-4958.989 |
-11803.61 |
|||
|
BIC |
-11782.52 |
-4932.43 |
-11754.14 |
|||
|
Ramsey RESET [F-Value] |
0.11 |
151.20 |
0.30 |
|||
|
Prob > F |
0.9555 |
0.0000 |
0.0000 |
|||
|
Variables |
Reg. Coe. |
P>|z| |
Reg. Coe. |
P>|z| |
Reg. Coe. |
P>|z| |
|
ESI |
0.3335 |
0.000 |
0.3185 |
0.000 |
0.333 |
0.000 |
|
(ESI)^2 |
- |
- |
- |
- |
-0.001 |
0.866 |
|
EDI |
0.3334 |
0.000 |
0.2872 |
0.000 |
0.333 |
0.000 |
|
(EDI)^2 |
- |
- |
- |
- |
0.001 |
0.201 |
|
SDI |
0.3333 |
0.000 |
0.3740 |
0.000 |
0.333 |
0.000 |
|
(SDI)^2 |
- |
- |
- |
- |
0.000 |
0.563 |
|
PPAFET |
2.11e-07 |
0.770 |
-0.002 |
0.000 |
-0.001 |
0.536 |
|
(PPAFET)^2 |
- |
- |
- |
- |
0.000 |
0.427 |
|
GFA |
2.87e-06 |
0.340 |
-0.001 |
0.826 |
0.000 |
0.136 |
|
(GFA)^2 |
- |
- |
- |
- |
0.000 |
0.261 |
|
Cons. Coef. |
-0.001 |
0.134 |
-0.013 |
0.000 |
0.000 |
0.507 |
Source: Author’s Estimation.
Environmental and green technology (ET) would be effective to maintain the path of SD. Furthermore, ESI, EDI, SDI are the integrated index of associated several variables. Hence, it is concluded that SD is an integrated component of economic, social and environmental development, and technological development. Singh et al. [4] also found similar results across countries. ESI is integration of various factors such as access to electricity, CO2 emissions from various sources, air pollution, electric power consumption, electricity production form different sources, renewable energy consumption, forest area, infant mortality rate, irrigated area, agricultural land, fertilizer consumption, population growth, population density, urbanization, fresh water resources, basic drinking water and sanitation facilities. Therefore, there is requirement to abate CO2 emissions from various sources using green and environmental technologies in production activities and adoption of best environmental practices to maintain the environmental sustainability in global economies [5]. Use of electricity in production activities is effective to reduce the CO2 emissions in atmosphere. Therefore, access to electricity for all communities and production of electricity form water, solar and other renewable sources will be favorable to increase environmental sustainability. Renewable energy consumption is also a vital factor to preserve the quality of available resources. Furthermore, sustainable use of water in agriculture will enhance the water sustainability in near future. Forest area is found a significant factor to absorb CO2 emissions from various sources and it is useful to increase the clean environment [3, 4]. Therefore, it is recommended that global economies are required to adopt an effective policy to ensure the forest area. It is also apparent that forest area preserves the quality and quantity of available natural resources. For this, global economies should control deforestation to protect the reserves forest area. Extensive use of fertilizer and pesticide in cultivation is also caused to increase environmental degradation. There are many demographical factors like overwhelming population growth, population density, urbanization and industrialization also have negative impact on environment and ecosystem services [4]. Therefore, aforesaid issues must be included to formulate a policy towards sustainable development at world-wide.
Economic development index (EDI) is a combination of GDP per capita, GDP per person employed, total vulnerable employment, total wage and salaried workers, total self-employed, foreign direct investment net inflow, price stability, exports of goods and services, gross capital formation, gross fixed capital formation and consumption expenditure. Thus, aforesaid factors have a greater contribution to maintain the economic development of a nation [4]. Countries like India, South Africa, Tunisia, Moldova, Argentina, Mexico, Hungry, Czech Republic and Greece needs to focus on aforementioned activities to increase their performance and success in economic development.
Social development index (SDI) is a combination of sex ratio, contribution of females in economic activities, female infant mortality rate, total life expectancy rate at birth, education expenditure, age dependency ratio and fixed telephone subscriptions. As sex ratio and female’s contribution in economic activities are useful to maintain the social equality and development. Furthermore, literacy rate is observed a vital factor to increase social equality and social development. Hence, extensive education expenditure will be useful to increase literacy rate and social development as well. Social communication increases as increase in fixed telephone subscriptions. Thus, it a crucial determinant to increase social development. In brief, countries such as South Africa, India, Tunisia, China should include aforementioned activities in further policy formulation to improve their position in social development in global economies. Also, environmental technology (ET) has a positive influence on GSDI, thus, it would be useful to achieve SD in future. Therefore, it is requested for global economies to discover more environmental and green technologies for production of goods and services. Environmental and green technologies will be developed through strengthening the science & technological development, increasing the involvement of researchers and scientists in R&D activities and extensive R&D expenditure in environmental and natural resources sciences. Thereafter, applications of environmental and green technologies in production activities would be helpful to mitigate the negative consequences of deforestation, natural disasters, climate change, other socio-economic activities and demographical change on SD [1, 4]. Furthermore, the empirical results based on non-linear regression model, indicate that sustainable development has a linear association with economic development, social development, and forest area. While, environmental sustainability and environmental technology have non-linear association with sustainable development.
Table 8. Correlation coefficient of error-term with its lags
|
Model's Name |
Linear Regression Model |
Log–linear Regression Model |
Non-linear Regression Model |
|||
|
Lags |
Auto-correlation coefficient |
Partial Auto-correlation |
Auto-correlation coefficient |
Partial Auto-correlation |
Auto-correlation coefficient |
Partial Auto-correlation |
|
1 |
1.000 |
0.010 |
1.000 |
0.618 |
1.000 |
-0.008 |
|
2 |
-0.031 |
-0.059 |
0.948* |
0.016 |
-0.037 |
-0.079 |
|
3 |
-0.079 |
-0.047 |
0.907* |
-0.003 |
-0.084* |
-0.067 |
|
4 |
-0.084 |
-0.093 |
0.875* |
-0.067 |
-0.089* |
-0.113 |
|
5 |
-0.054 |
0.011 |
0.847* |
0.167 |
-0.058 |
-0.011 |
|
6 |
-0.001 |
0.022 |
0.830* |
-0.074 |
-0.007 |
0.007 |
|
7 |
0.033 |
-0.002 |
0.809* |
0.077 |
0.027 |
-0.013 |
|
8 |
0.041 |
-0.128 |
0.794* |
-0.085 |
0.039 |
-0.141 |
|
9 |
-0.098 |
-0.094 |
0.787* |
0.119 |
-0.103 |
-0.114 |
Source: Author’s Estimation. Note: * indicates the coefficient is significant at 5% level.
3.4 Viability and credibility of regression coefficients
This study used three different models to estimate the regression coefficients of explanatory variables. Hence, it is compulsory to check the credibility of regression coefficients to make the rationality in the prediction of results. For this, existing researchers like Singh et al. [54], Jyoti and Singh [55], Singh and Jyoti [56] estimated the correlation coefficients of error-term with its various lags under a well-defined regression model to check the credibility of regression coefficients. Further, above-mentioned studies claimed that if the correlation coefficients of error-term with its at least first two lags are statistically significant then the regression coefficient may be valid and have credibility as well. Accordingly, regression coefficients may be used to make the future prediction about the output. Therefore, the Auto-correlation coefficient and Partial Auto-correlation coefficients of error-term and its various lags for linear, log-linear and non-linear regression models is given in Table 8. Auto-correlation coefficient among the error-term and its various lags under log-linear regression model is found statistically significant. Thus, regression coefficients of explanatory variables under this model have credibility.
The main aim of this study is to estimate the global sustainable development index (GSDI) as an integration of vital determinants of environmental development, economic development, and social development for selected 39 economies. Thus, environmental sustainability index (ESI), economic development index (EDI) and social development index (SDI) are created using Composite Z-score technique. Accordingly, it expresses relative position of undertaken countries in sustainable development, environmental sustainability, economic development and social development. Finally, it explores the effect of environmental technologies (ET), deforestation, environmental sustainability index, economic development index and social development index on GSDI using linear, non-linear and log-linear regression models at country-wise panel data during 2000-2016.
This study emphasized that sustainable development (SD) is multi-dimensional component and assessment which is directly and indirectly associated with socio-economic development and other activities of a nation. It is also highlighted that SD may not be measured with a single factor [4, 14]. Thus, index-based estimation is an effective tool for assessment of SD [4, 14]. Henceforth, this study argued that global sustainable development index (GSDI) may be a crucial mechanism for measurement of SD. Also, it must be included factors related to economic development, human development, social development, environmental development, technological development, industrial development, institutional development, infrastructural development and political stability [17, 32, 57]. The results infer that there is a high variation in sustainable development, environmental sustainability, economic development and social development in selected countries. Also, there is a significant diversity in these indicators in individual country.
As environmental development and ecological security are negatively associated with deforestation. Subsequently, deforestation have negative impact on SD. It is also found that SD is positively associated with economic, social and environmental development. Furthermore, this study provides a confirmation that environmental technologies and its applications in production activities would be useful to increase environmental development and SD. Existing studies also argued that technological development and innovation would be useful to achieve social and economic development [4, 7, 32]. Science & technological development also has a positive impact on income distribution, employment, industrial structure and social security. Environmental sustainability can be improved through technology transfer and extensive R&D expenditure across economies. Kongoli [17] also claimed that science & technological development, appropriate governance and management, education and civil society are the crucial pillars of SD. Furthermore, environmental sustainability will be improved as providing electricity to all community, production of electricity from renewable sources, protection of forest area, water management and conservation [4]. There is also requirement to control urbanization, population growth and population density to maintain environmental sustainability in developing countries like India and China. Consequently, it will reduce extensive pressure of population on ecological factors and additional use of natural resources in production activities. Highly industrialization countries like USA and United Kingdom require to use green and environmental technologies in production of goods to abate CO2 emissions from various sources.
It is expected that extensive pressure of population on natural resources will create more problems to maintain SD in developing economies [9]. Consequently, environmental quality and ecological resources will diminish due to high population growth, urbanization and labor migration from rural to urban area [1, 8, 28, 43]. Therefore, it is essential for developing countries such as India China, South Africa to adopt promising policies to control population growth, urbanization and labor migration to increase environmental sustainability. Furthermore, high population growth is caused to increase carbon emission and it is responsible for depletion of water and natural resources. So, there is desirable to maintain the negative consequences of overwhelming urbanization and population growth on environmental development in developing countries.
South Africa, India, Tunisia, Russia, Moldova, Poland, Argentina, Slovak Republic Romania, Croatia and Lithuania have relatively poor position in economic development among the 39 countries. Therefore, these countries should create extensive jobs for their population, conducive ecosystem for manufacturing sector to increase exports of goods and attract more foreign direct investment inflow and maintain price stability. Aforementioned initiatives will be positive for these countries to increase economic development at greater level.
China, Tunisia, India and South Africa have low position in social development. Thus, these countries should implement appropriate economic planning, effective education policy, better health and sanitation facilities, provision of clean drinking water and energy, adoption of poverty eradication strategies, extensive employment opportunities, gender equality, women empowerment, food security, social and environment justice, provision for protection of natural resources and climate action policies to increase social development and SD [15, 58]. As climate change is also created a barriers in path of sustainable development. Thus, global economies are needed to focus on climate change mitigation and adaptation techniques to achieve sustainable development in near future.
To maintain environmental development is a serious concern to achieve SD in developing economies. Therefore, environmental degradation and deforestation must be reduced through implementing an effective planning towards protection of natural resources and ecosystem services in these economies [8]. Environmental and green technologies bring several opportunities to reduce the adverse effect of deforestation in production activities [33]. Thus, it is proposed that high industrialized economies should use green and environmental technologies in production of goods. It would be helpful to abate GHGs emissions in atmosphere [3]. Also, environmental and green technologies may be discovered through more technological innovation and extensive involvement of scientist in R&D activities [32]. Also, innovative environmental technologies and technological development would be supportive to boost economic growth including SD. Global economies are essential to increase R&D expenditure, and extensive involvement of researchers and scientists in the area of environmental science will be useful to invent more environmental and green technologies for production activities. Hence, technological innovation may be useful to increase social and economic objectives of a country at greater scale [6, 32]. There is also requirement to provide better education and training to the people to increase their consciousness towards environmental related concerns and its implication in human life in developing countries [9].
In this study, ESI is as an integration of several factors that is given as:
(i) Air Quality and Pollution: There is essential to abate CO2 emissions from various production activities. Hence, it is urged to scientific community to discover a carbon sink which can be absorbed the CO2 emissions from various activities [51]. It would be imperative to preserve the quality and quantity of natural resources, subsequently it may be helpful to achieve SD [14, 21]. Air quality also would improve as use of electricity in production activities. Thus, it is indispensable to provide the electricity to all community to increase environmental quality.
(ii) Energy Management: Appropriate energy management practices like use of electric power consumption, renewable electricity output from various sources such as natural gas, coal, hydroelectric, nuclear and renewable sources would be effective to increase environmental sustainability [3, 4, 16, 17, 50, 59, 60]. Also, renewable energy practices and clean fuel energy consumption would be useful to increase economic development with sustainable economic growth [33].
(iii) Forest and Bio-diversity: Forrest area is an ecosystem-adaption based technique which can be used to reduce the negative impact of carbon emission on natural resources [61-63]. Forest area mitigates the negative impact of climate change in agricultural production activities. It is also useful to increase the water level in ground and reduce the possibilities of natural disasters such as floods, hurricanes, drought, tornadoes, volcanic eruptions, hailstorms, earthquakes, tsunamis and other natural calamities.
(iv) Human Health and Disaster: There is also essential to maintain human health to control the infant mortality rate through providing better food security and livelihood security. It would be positive to achieve SD. Infant mortality rate can be reduced through providing basic sanitation and better health facilities to rural and urban dweller [3, 64].
(v) Land Use Pattern and Agriculture: Applications of fertilizer and pesticides in farming is a significant contributor of GHGs emissions. Thus, there is requirement to adopt organic farming practices to abate GHGs emissions from agriculture and allied sectors. Then, it would be beneficial to preserve the quality and quantity of natural and ecological resources [4, 14, 24, 65].
(vi) Population Pressures on Ecosystem Services: Natural resources and ecosystem services are diminishing due to over population growth and higher urbanization at global level [4]. Thus, it must be mandatory for policy makers to formulate a policy to control population and urbanization to maintain the balance of population pressure on ecosystem services.
(vii) Water Generation Management: Water resources is scare in nature and it is continuously decreasing due to population growth, urbanization, and extensive use of water in farming, industrial and other sectors [66]. Therefore, it is necessary to adopt water management and conservation policies to maintain water sustainability.
Population growth, urbanization, population density, access to electricity, deforestation, forest area, renewable source of energy, water conservation and fertilizer consumption in cultivation, and science & technological development are seemed most influencing factors of environmental sustainability index [67, 68].
Economic development index (EDI) is an integration of GDP per capita, GDP per person employed, vulnerable employment, wage and salaried workers, total self-employed, foreign direct investment net inflows, inflation GDP deflator, exports of goods and services, gross capital formation, labor force participation rate, gross fixed capital formation, total employers, final consumption expenditure and total unemployment rate [12, 53]. As per capita GDP and labor participation rate generate a conducive path for economic development [14]. Foreign investment net inflow is useful to increase financial stability, create physical asset and it generates more jobs in a country. Consumption expenditure is also useful to increase the demand of goods and services. Accordingly, it provides incentive to manufacturing sector to produce additional goods and creates more jobs for skilled and unskilled labors in a nation. Hence, per capita GDP, labor participation rate, foreign direct investment net inflow, inflation and consumption expenditure are observed most influencing factors of economic development index. Furthermore, R&D expenditure is also significant driver to increase economic development [69].
Social development index (SDI) is a combination of sex ratio at birth, ratio of female to male labor force participation rate, female labor force, female unemployment, and female infant mortality rate, life expectancy at birth, education expenditure and fixed telephone subscriptions [6, 12]. It is found that education expenditure, female labor force, fixed telephone subscriptions, age dependency ratio, female labor force and employment opportunity for female will be useful to increase social development. Gender equity and female’s participation in economic activities are useful to maintain social equity [4, 70]. Education expenditure is effective to increase the literacy rate. Thus, gender equity, female’s participation and education expenditure are found most influencing factors of social development index (SDI). Also, the benefits of social and economic development must be effective for poverty eradication and abating inequality in the society to achieve SD [15].
This paper is revised and extended version of paper entitled “Measurement of Global Sustainable Development and its Association with Developmental Related Indicators in Selected Economies: An Empirical Investigation” presented in the 56th Annual Conference of the Indian Econometric Society (TIES) organized by School of Economics, Madurai Kamaraj University, Madurai during January 8-10, 2020. The authors are grateful to the conference’s participants who could provide comments and suggestions to increase the strength of this research article.
[1] Kapur, R. (2016). Natural resources and environmental issues. Journal of Ecosystem & Ecography, 6(2): 1-4. http://doi.org/10.4172/2157-7625.1000196
[2] Sathler, D., Adamo, S.B., Lima, E.E.C. (2018). Deforestation and local sustainable development in Brazilian Legal Amazonia: An exploratory analysis. Ecology and Society, 23(2): 1-15. https://doi.org/10.5751/ES-10062-230230
[3] Singh, A.K., Issac, J., Narayanan, K.G.S. (2019). Measurement of environmental sustainability index and its association with socio-economic indicators in Asian economies: An empirical investigation. International Journal of Environment and Sustainable Development, 18(1): 57-100. https://doi.org/10.1504/IJESD.2019.098641
[4] Singh, A.K., Singh, B.J., Vijay, N. (2020). Does sustainable development have causal relationship with environmental development? An evidence from country-wise panel data analysis. International Journal of Technology Management and Sustainable Development, 19(2): 1-36. https://doi.org/10.1386/tmsd_00020_1
[5] Qu, Y., Li, M., Quin, L. (2015). Environmental practice and its effect on the sustainable development of eco-industrial parks in China. International Journal of Sustainable Development and Planning, 10(5): 685-700. https://doi.org/10.2495/SDP-V10-N5-685-700
[6] Armenanu, D.S., Vintila, G., Gherghina, S.C. (2017). Empirical study towards the drivers of sustainable economic growth in EU-28 countries. Sustainability, 10(1): 1-22. https://doi.org/10.3390/su10010004
[7] Beder, S. (2000). The role of technology in sustainable development, Herkert, JR (Eds.). Social, Ethical, and Policy Implications of Engineering, Selected Readings. IEEE, 230-235. https://ro.uow.edu.au/cgi/viewcontent.cgi?article=1049&context=artspapers.
[8] Khan, H., Khan, U. (2012). From growth to sustainable development in developing countries: A conceptual framework. Environmental Economics, 3(1): 23-31.
[9] Duran, D.C., Gogan, L.M., Artene, A., Duran, V. (2015). The components of sustainable development – a possible approach. Procedia Economics and Finance, 26(1): 806-811. https://doi.org/10.1016/S2212-5671(15)00849-7
[10] Economic and Social Commission for Asa and the Asia Pacific (ESCAP) United Nations. (2015). Integrating the three dimensions of sustainable development: A framework and tools. United Nations Publication. https://www.unescap.org/sites/default/files/Integrating%20the%20three%20dimensions%20of%20sustainable%20development%20A%20framework.pdf.
[11] Kumar, A., Sah, B., Singh, A.R., Deng, Y., He, X., Kumar, P., Bansal, R.C. (2017). A review of multi criteria decision making (MCDM) towards sustainable renewable energy development. Renewable and Sustainable Energy Reviews, 69(1): 596-609. https://doi.org/10.1016/j.rser.2016.11.191
[12] Singh, A.K., Acharya, S.R., Chavda, P. (2017). Implications of intellectual property rights and socio-economic factors on growth of manufacturing sector in selected cross economies: An empirical assessment. In Proceedings of 12th Biennial Conference on Entrepreneurship Organized by EDII Ahmedabad, Ahmedabad, India, pp. 262-279.
[13] Moroke, T., Schoeman, C., Schoeman, I. (2020). Neighbourhood sustainability assessment model for developing countries: A comprehensive approach to urban quality of life. International Journal of Sustainable Development and Planning, 15(1): 107-123. https://doi.org/10.2495/SDP-V15-N1-107-123
[14] Jin, H., Qian, X., Chin, T., Zhang, H. (2020). A global assessment of sustainable development based on modification of the human development index via the Entropy method. Sustainability, 12(8): 1-20. https://doi.org/10.3390/su12083251
[15] Phimphanthavong, H. (2014). The determinants of sustainable development in Laos. International Journal of Academic Research in Management, 3(1): 51-75.
[16] Tampakoudis, I.A., Fylantzopoulou, D., Nikandrou, K. (2014). Examining the linkages between GDP growth and sustainable development in Eurozone. Journal of Economics and Business, 27(2): 15-37.
[17] Kongoli, F. (2016). Role of science and technology in sustainable development. 2016 Sustainable Industrial Processing Summit and Exhibition Plenaries, 1-14.
[18] Muttaqin, M.Z., Alviya, L., Lugina, M., Hamdani, F.A., Indartik (2019). Developing community-based forest ecosystem service management to reduce emissions from deforestation and forest degradation. Forest Policy and Economics, 108(1): 1-9. https://doi.org/10.1016/j.forpol.2019.05.024
[19] Basiago, A.D. (1999). Economic, social, and environmental sustainability in development theory and urban planning practice. Environmentalist, 19(1): 145-161. https://doi.org/10.1023/A:1006697118620
[20] Guijarro, F., Poyatos, J.A. (2018). Designing a sustainable development goal index through a Goal programming model: The case of EU-28 countries. Sustainability, 10(9): 3167. https://doi.org/10.3390/su10093167
[21] Sathaye, J., Najam, A., Cocklin, C., Heller, V., Lecocq, F., Llanes-Regueiro, J., Pan, J., Petschel-Held, G., Rayner, S., Robinson, J., Schaeffer, R., Sokona, Y., Swart, R., Winkler, H. (2007). Sustainable Development and Mitigation in Climate Change 2007: Mitigation. Contribution of Working Group III to the 4th Assessment Report of the Intergovernmental Panel on Climate Change [Metz, B., Davidson, O.R., Bosch, P.R., Dave, R., Meyer, L.A. (eds.)], Cambridge University Press, Cambridge, United Kingdom and New York, NY, USA.
[22] Howes, M., Wortley, L., Potts, R., Dedekorkut-Howes, A., Serrao-Neumann, S., Serrao-Neumann, J., Smith, T., Nunn, P. (2017). Environmental sustainability: A case of policy implementation failure? Sustainability, 9(2): 165. https://doi.org/10.3390/su9020165
[23] Dong, Y., Hauschild, M.Z. (2017). Indicators for environmental sustainability. Procedia, 61(1): 697-702. https://doi.org/10.1016/j.procir.2016.11.173
[24] Singh, A.K., Issac, J. (2018). Impact of climatic and non-climatic factors on sustainable livelihood security in Gujarat state of India: A statistical exploration. Agriculture and Food Science Research, 5(1): 30-46. https://doi.org/10.20448/journal.512.2018.51.30.46
[25] Bolay, J.C. (2012) Appropriate Technologies for Sustainable Development. In: Bolay JC., Schmid M., Tejada G., Hazboun E. (eds) Technologies and Innovations for Development. Springer, Paris. https://doi.org/10.1007/978-2-8178-0268-8_1
[26] Zamir, M. (2013). Environmental technology for sustainable development. https://www.thedailystar.net/news/environmental-technology-for-sustainable-development.
[27] Gibbs, D., Longhurst, J. (1995). Sustainable development and environmental technologies: A comparison of policy in Japan and European Union. Environmentalist, 15(1): 196-201. https://doi.org/10.1007/BF01901575
[28] Gavin, B. (2015). Sustainable development of China’s rare earth industry within and without the WTO. Journal of World Trade, 3(1): 495-515.
[29] Matin, N., Islam, M.S., Mbuvi, M.T.E., Odit, B.O., Ongugo, P.O., Syed, M.A. (2014). Group inequality and environmental sustainability: Insights from Bangladesh and Kenyan forest commons. Sustainability, 6(1): 1462-1488. https://doi.org/10.3390/su6031462
[30] Shafiei, M.W.M., Abadi, H. (2017). The importance of green technologies and energy efficiency for environmental protection. International Journal of Applied Environmental Sciences, 12(5): 937-951.
[31] Urban, F. (2015). Environmental innovation for sustainable development: The role of China. Sustainable Development, 23: 203-205.
[32] Anadon, L.A., Chan, G., Harley, A.G., Matus, K., Moon, S., Murthy, S.L., Clark, W. (2016). Making technological innovation for sustainable development. PNAS, 113(35): 9682-9690. https://doi.org/10.1073/pnas.1525004113
[33] Saudi, H.M., Sinaga, O., Roespinoedj, D., Ghani, E. (2019). The impact of technological innovation on energy intensity: Evidence from Indonesia. International Journal of Energy Economics and Policy, 9(3): 11-17. https://doi.org/10.32479/ijeep.7731
[34] Miola, A., Schiltz, F. (2019). Measuring sustainable development goals performance: How to monitor policy action in the 2030 agenda implication? Ecological Economics, 164: 1-10. https://doi.org/10.1016/j.ecolecon.2019.106373
[35] Hickel, J. (2020). The sustainable development index: Measuring the ecological efficiency of human development in Anthropocene. Ecological Economics, 167: 1-10. https://doi.org/10.1016/j.ecolecon.2019.05.011
[36] Nagy, J.A., Benedek, J., Ivan, K. (2018). Measuring sustainable development goals at a local level: A case of a metropolitan area in Romania. Sustainability, 10(11): 3962. https://doi.org/10.3390/su10113962
[37] Singh, A.K. (2017). An empirical analysis to assess the GDP projection of Gujarat state of India. JNNCE Journal of Engineering and Management, 1(2): 51-58. http://jjem.jnnce.ac.in/article/JJEM010207.pdf.
[38] Singh, A.K., Sharma, P. (2018). Implications of climatic and non-climatic variables on food security in developing economies: A conceptual review. MOJ Food Processing & Technology, 6(1): 1-12. https://doi.org/10.15406/mojfpt.2018.06.00138
[39] Li, M., Wang, J., Chen, Y. (2019). Evaluation and influencing factors of sustainable development capability of agriculture in countries along the belt and road route. Sustainability, 11(7): 2004. https://doi.org/10.3390/su11072004
[40] Sands, G.R., Podmore, T.H. (2000). A generalized environmental sustainability index for agricultural systems. Agriculture, Ecosystem and Environment, 79(1): 29-41. https://doi.org/10.1016/S0167-8809(99)00147-4
[41] Siche, J.R., Agostinho, F., Ortega, E., Romeiro, A. (2007). Sustainability of nations by indices: Comparative study between environmental sustainability index, ecological footprint and the energy performance indices. Ecological Economics, 66(4): 628-637. https://doi.org/10.1016/j.ecolecon.2007.10.023
[42] Gaetano, V. (2010). EU rural policy: Proposal and application of an agricultural sustainability index. MPRA Paper No. 27032. https://mpra.ub.uni-muenchen.de/27032/
[43] Samimi, A.J., Kashefi, A., Salatin, P., Lashkarizadeh, M. (2011). Environmental performance and HDI: Evidence from countries around the world. Middle East Journal of Scientific Research, 10(3): 294-301.
[44] Dash, R. (2011). Environmental sustainability index for Indian states 2011: Informing environmental action. Centre for Development Finance, Institute for Financial Management and Research, Chennai. www.ifmr.ac.in/cdf.
[45] Talukder B., Blay-Palmer A., van Loon G.W., Hipel K.W. (2020). Towards complexity of agricultural sustainability assessment: Main issues and concerns. Environmental and Sustainability Indicators, 6: 1-12. https://doi.org/10.1016/j.indic.2020.100038
[46] Singh, A.K., Singh, B.J., Ashraf, S.N. (2020). Implications of intellectual property protection, and science and technological development in the manufacturing sector in selected economies. Journal of Advocacy, Research and Education, 7(1): 16-35.
[47] Singh, A.K., Arya, A., Jyoti, B. (2019). A conceptual review on economic, business, intellectual property rights and science & technological related activities in Asian economies. JNNCE Journal of Engineering & Management, 3(2): 1-22.
[48] Kusdiantoro, Fahrudin, A., Wisudo, S.H., Juanda, B. (2020). Sustainable development index of marine capture fisheries in Indonesia. International Journal of Sustainable Development and Planning, 15(8): 1267-1275. https://doi.org/10.18280/ijsdp.150813
[49] Garg, R. (2013). Measurement of sustainability: Statistical model. International Journal of Scientific and Research Publications, 3(10): 1-4.
[50] Mainali, B., Pachauri, S., Rao, N.R., Silveira, S. (2014). Assessing rural energy sustainability in developing countries. Energy for Sustainable Development, 19: 15-28. https://doi.org/10.1016/j.esd.2014.01.008
[51] Kumar, A., Ahmad, M.M., Sharma, P. (2015). Carbon emission and global food security: A cross country analysis. PENCIL Publication of Agricultural Sciences, 2(1): 7-24.
[52] Kumar, A., Ahmad, M.M., Sharma, P. (2017). Influence of climatic and non-climatic factors on sustainable food security in India: A statistical investigation. International Journal of Sustainable Agricultural Management and Informatics, 3(1): 1-30. https://doi.org/10.1504/IJSAMI.2017.082917
[53] Ashraf, S.N., Singh, A.K. (2019). Does entrepreneurship ecosystem have a long-term relationship with economic Growth in selected economies? A statistical investigation. In: Proceedings of the 13th Biennial Conference on Entrepreneurship Organized by EDII Ahmedabad; 20-22 February 2019; Ahmedabad, India, pp. 176-187.
[54] Singh, A.K., Narayanan, K.G.S., Sharma, P. (2017). Effect of climatic factors on cash crop farming in India: an application of Cobb-Douglas production function model. International Journal of Agricultural Resources, Governance and Ecology, 13(2): 175-210. https://doi.org/10.1504/IJARGE.2017.086452
[55] Jyoti, B., Singh, A.K. (2020). Projected sugarcane yield in different climate change scenarios in Indian states: A state-wise panel data exploration. International Journal of Food and Agricultural Economics, 8(4): 343-365.
[56] Singh, A.K., Jyoti, B. (2021). Projected food-grain production and yield in India: An evidence from state-wise panel data investigation during 1977-2014. The Journal of Agricultural Sciences – Sri Lanka, 16(1): 108-125. http://doi.org/10.4038/jas.v16i1.9188
[57] Mensah, J. (2019). Sustainable development: Meaning, history, principles, pillars, and implications for human action: Literature review. Cogent Social Sciences, 5(1): 1-21. https://doi.org/10.1080/23311886.2019.1653531
[58] Ellerbrock, M.J. (2018). Sustainable development requires environmental justice. International Journal of Sustainable Development and Planning, 13(2): 208-214. https://doi.org/10.2495/SDP-V13-N2-208-214
[59] Malkina-Pykh, I.G., Pykh, Y.A. (2016). Environmental sustainability and quality of life: From theory to practice. International Journal of Sustainable Development and Planning, 11(6): 853-863. https://doi.org/10.2495/SDP-V11-N6-853-863/004
[60] Singh, A.K., Jyoti, B. (2019). Measuring the climate variability impact on cash crop frming in India: An empirical investigation. Agriculture and Food Sciences Research, 6(2): 155-165. https://doi.org/10.20448/journal.512.2019.62.155.165
[61] Segnestam, L. (2002). Indicators of environment and sustainable development: Theories and practical experience. Environmental Economics Series Paper Number 89, The International Bank for Reconstruction and Development/ The World Bank, Washington, DC.
[62] Rostami, M., Mohammadi, H. (2017). An assessment of sustainability of agricultural system in Golestan Province, Iran. International Journal of Agricultural Management and Development, 18(1): 91-100. https://doi.org/10.22004/ag.econ.292523
[63] Zhen, L., Routray, J.K. (2003). Operational indicators for measuring agricultural sustainability in developing countries. Environmental Management, 32(1): 34-46. https://doi.org/10.1007/s00267-003-2881-1
[64] Omisore, A.G. (2018). Attaining sustainable development goals in sub-Saharan Africa: The need to address environmental challenges. Environmental Development, 25: 138-145. https://doi.org/10.1016/j.envdev.2017.09.002
[65] Fallah-Alipour, S., Boshrabadi, H.M., Mehrjerdi, M.R.Z., Hayati, D. (2018). A framework for empirical assessment of agricultural sustainability: The case of Iran. Sustainability, 10(12): 4823. https://doi.org/10.3390/su10124823
[66] Cosgrove, W.J., Loucks, D. (2015). Water management: current and future challenges and research directions. Water Resources Research, 51(6): 4823-4839. https://doi.org/10.1002/2014WR016869
[67] Ahmed, A., Stein, J.A. (2004). Science, technology and sustainable development: A world review. World Review of Science, Technology and Sustainable Development, 1(1): 5-24. http://doi.org/10.1504/WRSTSD.2004.004852
[68] Pramova, E., Locatelli, B., Djoudi, H., Somorin, O.A. (2012). Forests and trees for social adaptation to climate variability and change. WIREs Climate, 3(1): 581-596. https://doi.org/10.1002/wcc.195
[69] Kaur, M., Singh, L. (2016). R&D expenditure and economic growth: An empirical analysis. International Journal of Technologies Management & Sustainable Development, 15(3): 195-213. http://doi.org/10.1386/tmsd.15.3.195_1
[70] Latruffe, L., Diazabakana, A., Bockstaller, C., Desjeux, Y., Finn, J., Kelly, E., Ryan, M., Uthes, S. (2016). Measurement of sustainability in agriculture: A review of indicators. Studies in Agricultural Economics, 118(1): 123-130. http://doi.org/10.7896/j.1624