Lelai Shi | Jing Zhou* | Suhui Liu
© 2020 IIETA. This article is published by IIETA and is licensed under the CC BY 4.0 license (http://creativecommons.org/licenses/by/4.0/).
OPEN ACCESS
The efficient use of agricultural water is the key for Yangtze River Economic Zone (YREZ) to realize ecological green development. Taking the panel data on 11 YREZ regions in 2011-2018 as the object, this paper establishes an evaluation indicator system for green agricultural water use efficiency (GAWUE) containing undesired output, and adopts the epsilon-based measure (EBM) model to evaluate YREZ’s GAWUE. After analyzing the regional differences in YREZ’s GAWUE, the Tobit model was introduced to verify the drivers of GAWUE. The results show that: In the study period, YREZ’s GAWUE exhibits some regional differences. The mean GAWUEs of Shanghai, Jiangsu, Zhejiang, and Sichuan were optimized; those of Guizhou, Yunnan, Chongqing, and Hubei were relatively desirable, leaving a small room for improvement, the mean GAWUEs of Hunan, Jiangxi, and Anhui were undesirable, waiting for major improvement in future. Overall, the lower reaches had the highest GAWUE, followed by the upper reaches, while the middle reaches had the minimum GAWUE. The Tobit model shows that agricultural technological growth (ATG) and agricultural water intensity (AWI) greatly promote GAWUE, while farmer income level (FIL), water resources endowment (WRE), agricultural planting structure (APS), and farmland irrigation area (FIA) significantly suppress GAWUE.
Yangtze River Economic Zone (YREZ), green agricultural water use efficiency (GAWUE), influencing factors, epsilon-based measure (EBM) model, Tobit model
With a long history of agriculture, China consumes a huge amount of agricultural water. In 2018, China’s agricultural water consumption amounted to 369.31 billion m3, taking up 61.39% of the country’s total water consumption (601.55 billion m3). Worse still, the utilization of agricultural water is very inefficient in China, due to the backward technology of agricultural production. In particular, flood irrigation and sprinkler irrigation still dominate the agricultural irrigation. Only 1.1% of farmers have adopted water-saving technology in main agricultural irrigation areas [1]. Amongst the 13 most water-deficient countries, China has a per-capita freshwater resources only a quarter of the global average, ranking 121st in the world. To realize water sustainability, it is crucial for China to improve the efficiency of water use in the agricultural sector.
Yangtze River Economic Zone (YREZ) boasts denser economic output and greater economic potential than anywhere else in China. This zone is also the most important agricultural production area in the country. The agricultural sector occupies an important position in YREZ. Currently, the YREZ accounts for nearly 30% of China’s agricultural farmland (520 million acres), roughly 1/6 of China’s grassland (1 billion acres), and about 40% of the total output of agriculture, forestry, animal husbandry, and fishery (AFAF) (4 trillion yuan). The rapid agricultural development stimulates the YREZ demand for water resources. In 2018, YREZ consumed 138.03 billion m3 of agricultural water, 37.38% of the national total. The efficient use of agricultural water in YREZ directly affects the implementation of agricultural water conservation strategy in China. Therefore, this paper attempts to measure the exact level of green agricultural water use efficiency (GAWUE) in YREZ, and identify the drivers of GAWUE.
The agricultural water use efficiency has long been a hot issue in the academia. The fundamental way to save water in agriculture in to improve the utilization efficiency of water resources [2]. In general, agricultural water is utilized in such processes as water supply, water distribution, and field irrigation [3]. Thus, the agricultural water use efficiency is related to the agricultural production and irrigation. More importantly, this efficiency indicator involves the green utilization and efficiency of water resources [4, 5]. To effectively evaluate the agricultural water use efficiency, an indispensable step is to establish the evaluation indicators of the effective utilization of water resources [6, 7].
At present, the agricultural water utilization is mainly evaluated by stochastic frontier analysis (SFA) or measured by data envelopment analysis (DEA). For example, Kaneko et al. [8] and Wang et al. [9] evaluated the agricultural water use efficiency of China through SFA. After building panel data, Francisco et al. [10] measured China’s agricultural water use efficiency by DEA. Njuki and Bravo-Ureta [11] adopted non-radial input-oriented method to measure the irrigation water efficiency of agriculture in the United States (US).
This paper mainly makes two contributions: Firstly, the existing evaluation indicators of agricultural water use efficiency are mostly good outputs like agricultural output, rather than bad outputs like the pollutants generated in agricultural water utilization; the proposed evaluation indicators for GAWUE take account of bad output. Secondly, most studies on agricultural water use efficiency focus on the national level, while few pay attentions to that in YREZ; this paper makes a great breakthrough by taking YREZ as the study area.
2.1 EBM model
This paper chooses DEA to evaluate YREZ’s GAWUE, because DEA is more flexible and adaptable than SFA. The DEA views each region as a decision-making unit (DMU), and gathers all DMUs into an evaluation group. Then, the relative efficiency of each DMU is evaluated through pairwise comparison between all DMUs [12]. Essentially, DEA determines the non-parametric production frontier [13] through linear programming. The DMUs on the frontier have an efficiency of 1, and those not on that frontier have an efficiency smaller than 1.
Early examples of DEA include the models proposed by Charnes, Cooper, and Rhodes, as well as Banker, Chames, and Cooper [14]. These models can handle efficiency evaluation problems with multiple inputs and outputs. But neither can effectively handle problems with undesired output(s). If the problem belongs to the field of energy or environment, the neglection of undesired output(s) might cause error in efficiency evaluation.
To deal with undesired output(s), Tone extended the classic DEA into slack-based measurement (SBM) model [15]. The largest difference between SBM and classic DEA is the inclusion of undesired output(s) into the efficiency evaluation of DMUs [16]. This major improvement breaks through the maximum output hypothesis of classic DEA-based efficiency models.
The SBM has been widely applied to evaluate efficiency problems with undesired output(s). However, this model often underestimates the DMU efficiency, as it ignores the proportionality between input and output variables. Later, Tone and Tsutsui [17] further improved the SBM model into the epsilon-based measure (EBM) model. The biggest feature of the EBM model is the compatibility with radial and non-radial problems of input and output variables, and the high accuracy in the evaluation of DMU efficiency.
The EBM model can be established as follows: In a production system of n DMUs, s desired outputs y and q undesired outputs b are produced from m inputs x through the procedure Pt(x)={(x, y, b): x can produce y and b}. By this principle, the EBM model can be expressed as:
$\begin{align} & {{\gamma }^{*}}=\min \frac{\theta \text{-}{{\varepsilon }_{x}}\sum\limits_{i=1}^{m}{\frac{w_{i}^{-}s_{i}^{-}}{{{x}_{ik}}}}}{\varphi +{{\varepsilon }_{y}}\sum\limits_{r=1}^{s}{\frac{w_{r}^{+}s_{r}^{+}}{{{y}_{rk}}}+{{\varepsilon }_{b}}\sum\limits_{p=1}^{q}{\frac{w_{p}^{b-}s_{p}^{b-}}{{{b}_{pk}}}}}} \\ & {{s}_{.}}{{t}_{.}}\theta {{x}_{ik}}=\sum\limits_{j=1}^{n}{{{x}_{xj}}}{{\lambda }_{j}}+s_{i}^{-},i=1,...,m \\ & \varphi {{y}_{rk}}=\sum\limits_{r=1}^{n}{{{y}_{xj}}}{{\lambda }_{j}}-s_{r}^{+},r=1,...,s \\ & \varphi {{b}_{tk}}=\sum\limits_{p=1}^{n}{{{b}_{xj}}}{{\lambda }_{j}}+s_{p}^{b-},p=1,...,q \\ & \lambda >0,s_{i}^{-},s_{r}^{+},s_{p}^{b-}\ge 0 \\ \end{align}$ (1)
where, γ* is the score of the optimal efficiency in the EBM model; λ is the weight vector; xik, yrk, and btk are the i-th input, r-th desired output, and p-th undesired output, respectively; wi, wr, and wp are the weights of the i-th input, r-th desired output, and p-th undesired output, respectively; εx is the core parameter of radial feature θ and non-radial feature $s_{i}^{-}$.
2.2 Evaluation indicator system
Unlike traditional indicators of agricultural water use efficiency, GAWUE is a total-factor concept that considers resource and environmental factors in the utilization of agricultural water. Before evaluating YREZ’s GAWUE, an important premise is to build a scientific and reasonable system of evaluation indicators.
Drawing on Geng et al. [18], the evaluation indicators for GAWUE was divided into input indicators and output indicators. The input indicators include water input, labor input, capital input, fertilizer input, and mechanical power input, while the output indicators include a desired output, i.e., AFAF output, and an undesired output, i.e., chemical oxygen demand (COD) of agricultural wastewater. As shown in Table 1, each evaluation indicator can be explained as follows:
Table 1. The indicators of GAWUE inputs and outputs
|
Category |
Name |
Meaning |
|
Input indicators |
Water input |
Total agricultural water consumption in each YREZ region. |
|
Labor input |
Year-end number of employees in each YREZ region. |
|
|
Capital input |
Actual FAI in agriculture in each YREZ region. To eliminate the effect of inflation, the FAI in agriculture was deflated into actual FAI in agriculture, with 2011 as the base period, using the price index of FAI. |
|
|
Fertilizer input |
The fertilizer consumption in each YREZ region. |
|
|
Mechanical power input |
The total power of agricultural machinery in each YREZ region. |
|
|
Output indicators |
AFAF output |
AFAF output in each YREZ region. To eliminate the effect of price, the nominal AFAF output was converted into the actual AFAF output, with 2011 as the base period, using the gross domestic product (GDP) index. |
|
COD |
Annual amount of organic pollutants in agricultural wastewater discharged in each YREZ region. |
This indicator refers to the consumption of water resources in agricultural production, including water consumption in agricultural irrigation, as well as various water consumption in agricultural production. It is the core input indicator for the evaluation of GAWUE.
(2) Labor input
Labor is the subject in the utilization of agricultural water. No agricultural production activity can be completed in the absence of labor. Hence, this indicator is a basic input for the evaluation of GAWUE.
(3) Capital input
The utilization of agricultural water, such as agricultural irrigation, is impossible without capital support. Not only that, capital investment is needed for many links in the utilization of agricultural water, namely, water conservancy construction, agricultural irrigation, and machinery purchases. For the lack of data on agricultural capital input, this indicator was substituted by fixed asset investment (FAI) in agriculture.
(4) Fertilizer input
Fertilizer is an important material in agricultural production. It plays an irreplaceable role in the crop planting and agricultural production. In addition, fertilizer is a major source of pollutants generated through the utilization of agricultural water. Therefore, fertilizer input was included as an important input indicator for the evaluation of GAWUE.
(5) Mechanical power input
Agricultural machinery is the power source in the utilization of agricultural water. With the modernization of agricultural irrigation, the significance of agricultural machinery is increasing in agricultural water utilization. As a result, the mechanical power input was also selected as an important input indicator for the evaluation of GAWUE.
(6) Desired output
The desired output refers to the good output in the utilization of agricultural water. The AFAF output reflects the total scale and yield of agricultural production in a certain period of time. It is the main indicator of the level and development speed of agricultural production. Therefore, the AFAF output was chosen as the desired output.
(7) Undesired output
The “green” in GAWUE reveals the environmental impact of agricultural water utilization. The impact generally means the water pollutants generated through the utilization of agricultural water. Chemical oxygen demand (COD), as the marker of pollutants in agricultural wastewater, was taken as the undesired output.
2.3 Tobit model
This paper tries to answer an important question: What are the drivers of YREZ’s GAWUE? Normally, the efficiency of agricultural water utilization is affected by internal factors, such as agricultural production conditions [19], technological progress [20], and the educational level of farmers [21], as well as external factors, such as water price system [22], and government intervention factors [23].
Referring to the relevant literature, this paper summarizes the drivers of GAWUE into farmer income level (FIL), agricultural technological growth (ATG), water resources endowment (WRE), agricultural water intensity (AWI), agricultural planting structure (APS), and farmland irrigation area (FIA). As shown in Table 2, the impact mechanism of each driver on GAWUE was expected as follows:
(1) FIL
Generally, a high FIL means lots of disposable income. In this case, farmers have sufficient funds to purchase advanced equipment for agricultural irrigation, laying the basis for modern water-saving irrigation techniques like sprinkler irrigation and trickle irrigation. Therefore, the growth in FIL benefits GAWUE. Here, FIL is substituted by the disposable income of farmers, and the sign of FIL coefficient is expected to be positive.
(2) ATG
ATG is a necessary support for farmers to adopt modern techniques for agricultural irrigation. The popularization of these techniques makes agricultural water utilization more efficient, reducing the waste of agricultural water. Moreover, ATG can substitute some production factors. With the advancement of modern agricultural planting technology, the consumption of agricultural production materials, e.g., pesticides and fertilizers, has been lowered. The mass use of such materials is a major source of water pollutants generated in agricultural water utilization. Therefore, ATG is a critical path towards GAWUE improvement. Here, ATG is characterized by the ratio of internal expenditure on research and development (R&D) to GDP, and the sign of ATG coefficient is expected to be positive.
(3) WRE
In water-rich regions, the unit price of water is relatively low thanks to the sufficient supply of water. Besides, the residents in water-rich regions are not fully aware of the importance of water conservation, due to the high per-capita water resources. As a major water consumer, the agricultural sector in water-rich regions tends to utilize water in an intensive manner. This obviously suppresses the GAWUE in these regions. For data availability, WRE was substituted by per-capita water resources, and the sign of WRE coefficient was expected to be negative.
(4) AWI
AWI reflects the dependence of a region on water resources. In general, a high AWI means the region relies heavily on water resources in agricultural production. The inverse is also true. The stronger the reliance, the higher the consumption of agricultural water, and the smaller the agricultural output per unit of water resources. This is clearly unfavorable to GAWUE. Here, the AWI is measured by the ratio of agricultural water consumption to AFAF output, and the sign of AWI coefficient was expected to be negative.
(5) APS
The crops in China mainly encompass food crops and cash crops. China is a large country with a long history of agricultural production. The APS is largely represented by the ratio of the planting area of food crops in the total planting area of all crops. Since food crops have a smaller output per unit of water resources than cash crops, the greater the said ratio, the poorer the GAWUE.
(6) FIA
Generally, a high FIA brings a huge demand for water resources, and induces a large loss in agricultural water utilization. This will significantly reduce GAWUE.
After the drivers of GAWUE had been determined, a suitable measurement model must be selected to verify the significance of each driver [24]. The GAWUE measured by the EMB model falls to (0, 1), and serves as the dependent variable in the measurement model. To overcome the censoring of independent variables, Tobin [25] proposed the Tobit model based on the principle of maximum likelihood estimation. Since then, the Tobit model have been gradually introduced to the empirical tests on the factors affecting agricultural water use efficiency. In view of this, a Tobit model for GAWUE factors was established with GAWUE as the dependent variable and the six drivers as independent variables:
$\begin{align} & GAWRUE_{it}^{*}=\alpha +{{\beta }_{1}}FI{{L}_{it}}+{{\beta }_{2}}AT{{G}_{it}}+ \\ & {{\beta }_{3}}WR{{E}_{it}}+{{\beta }_{4}}AW{{I}_{it}}+{{\beta }_{5}}AP{{S}_{it}}+{{\beta }_{6}}FI{{A}_{it}}+\varepsilon \\ & \left\{ _{GAWRU{{E}_{it}}={{1}_{{}}}(Otherwise IWRUE_{it}^{*}\ge 1)}^{GAWRU{{E}_{it}}=GAWRUEI{{_{it}^{*}}_{{}}}(If IWRUE_{it}^{*}<1)} \right. \\ \end{align}$ (2)
where, FIL is characterized by the disposable income of farmers in each YREZ region (to eliminate the effect of possible collinearity, the natural logarithm of the variables was taken); ATG is characterized by the ratio of internal R&D expenditure to GDP in each YREZ region; WRE is characterized by the natural logarithm of per-capita water resources in each YREZ region; AWI is characterized by the ratio of agricultural water consumption to AFAF output in each YREZ region; APS is characterized by the ratio of the planting area of food crops in the total planting area of all crops in each YREZ region; FIA is characterized by the natural logarithm of agricultural irrigation area in each YREZ region.
Table 2. The meaning of each driver
|
Driver |
Definition |
Unit |
Expected sign |
|
FIL |
Ln (disposable income of farmers) |
yuan |
+ |
|
ATG |
Internal R&D expenditure / GDP |
% |
+ |
|
WRE |
Ln (per-capita water resources) |
m3/person |
- |
|
AWI |
Agricultural water consumption / AFAF output |
% |
- |
|
APS |
Planting area of food crops / Total planting area of all crops |
% |
- |
|
FIA |
Ln (FIA) |
1,000 hectares |
- |
This research involves numerous variables come from EBM and Tobit models. To ensure the availability and comprehensiveness of the data sources of these variables, a reasonable panel data of the YREZ was selected as the object. The entire panel data contain the data on the 11 YREZ regions in 2011-2018. The data on the following variables were collected from China Statistical Yearbooks, China Water Resources Bulletins, China Rural Statistical Yearbooks, China Statistical Yearbooks on Science and Technology, China Statistical Yearbooks on Environment, and the statistical yearbooks of each YREZ region: GDP, GDP index, internal R&D expenditure, total agricultural water consumption, year-end number of employees of agriculture, FAI in agriculture, price index of FAI, agricultural fertilizer consumption, total power of agricultural machinery, AFAF output, COD of agricultural water pollutants, disposable income of farmers, per-capita water resources, planting area of food crops, total planting area of all crops, and agricultural irrigation area.
3.1 Regional differences in GAWUE
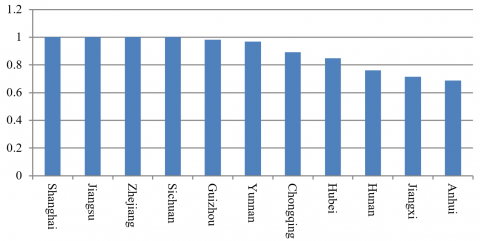
After importing the data on the selected input and output indicators into maxDEA, the EBM model was utilized to evaluate the GAWUEs of the 11 YREZ regions in 2011-2018. For convenience, the mean GAWUEs of each YREZ region in the study period is presented in Figure 1.
As shown in Figure 1, the mean GAWUEs of Shanghai, Jiangsu, Zhejiang, and Sichuan equaled 1, which is the production frontier. Sichuan is the only among them belonging to the upper reaches of YREZ. The other three regions all belong to the lower reaches. These regions achieved the optimal GAWUE, owing to developed economy, advanced agricultural production technology, and high-end agricultural irrigation methods.
The mean GAWUEs of Guizhou, Yunnan, Chongqing, and Hubei were 0.9827, 0.9683, 0.8930, and 0.8470, respectively. The results are relatively desirable, for their small distance from the production frontier. That is, there is only a small room for improving their GAWUEs. Except for Hubei, all these regions belong to the upper reaches. The agricultural production of them is not as good as that of the regions in the lower reaches. This, coupled with the backward irrigation methods in some parts, leads to the waste of some water resources.
The mean GAWUEs of Hunan, Jiangxi, and Anhui were 0.7607, 0.7147, and 0.6882, respectively. Located in the middle reaches, these regions failed to achieve desirable GAWUEs, possibly due to the APS. Being major crop producers in China, these regions have relatively low agricultural outputs, for the high ratio of the planting area of food crops in the total planting area of all crops. Besides, the agricultural production in these regions consume lots of pesticides and fertilizers, resulting in certain water pollutions.
In summary, YREZ’s GAWUE exhibits some regional differences. The regions in the lower reaches optimized GAWUEs, the regions in the upper reaches performed satisfactorily in GAWUE, and those in the middle reaches underperformed. Compared with those in the lower and upper reaches, the regions in the middle reaches utilize agricultural water in an extensive manner. These regions should be the focal point of future policies on agricultural water conservation.
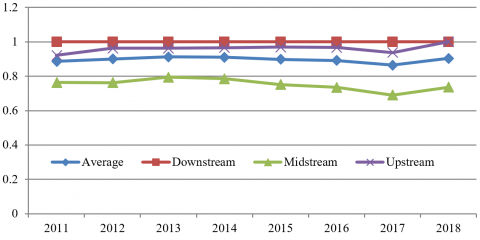
Figure 2 displays the GAWUE trends in YREZ and the upper, middle, and lower reaches. It can be seen that the GAWUE in the lower reaches remained on the production frontier throughout the study period, without any changes; the GAWUE in the middle reaches did not change greatly before 2014, and slowly declined after that year; the GAWUE in the lower reaches stayed stable throughout the study period, except slight decreases in a few years.
The GAWUE of the lower reaches remained at the optimal value of 1, much higher than the YREZ mean of 0.8959; the GAWUE of the middle reaches stood at 0.7527, far below the YREZ mean; the GAWUE of the upper reaches was 0.9610, slightly above the YREZ mean. Overall, the lower reaches had the highest GAWUE, followed by the upper reaches, while the middle reaches had the minimum GAWUE.
Figure 1. The mean GAWUE in each YREZ region
Figure 2. The GAWUE trends in YREZ and the upper, middle, and lower reaches
3.2 Results of Tobit model
By formula (2), the coefficient of each independent variable for YREZ’s GAWUE was regressed through Tobit model estimation on Stata 12.0. The regression results are recorded in Table 3.
Table 3. The regression results on the coefficient of each independent variable
|
Variable |
Coefficient |
T-statistic |
P value |
|
FIL |
-0.4086*** |
-3.37 |
0.001 |
|
ATG |
70.3859*** |
5.22 |
0.000 |
|
WRE |
-0.2387** |
-2.39 |
0.019 |
|
AWI |
2.5398*** |
4.90 |
0.000 |
|
APS |
-0.4561* |
1.62 |
0.110 |
|
FIA |
-0.4693*** |
-4.18 |
0.000 |
|
L- likelihood |
-1.2604 |
||
Note: *** is p < 0.01, i.e., significant at 1% level; ** is p < 0.05, i.e., significant at 5% level; * is p < 0.1, i.e., significant at 10% level.
The estimation coefficient of FIL was negative, passing the significance test at 1%. This means the disposal income of farmers suppresses YREZ’s GAWUE, as opposed to our expectation. This is closely related to the preference of Chinese farmers in agricultural production. With the rise in disposal income, Chinese farmers prefer to purchase agricultural production materials like fertilizers, pesticides, and agricultural machinery, rather than water-saving equipment and irrigation techniques that bring environmental benefits. These materials could rapidly promote agricultural output. But the promotion is realized at the expense of serious water pollution.
ATG had a significant promoting effect on YREZ’s GAWUE, i.e., the GAWUE increases with the ratio of internal R&D expenditure to GDP. This result echoes with our expectation. As stated by Azad and Ancev [26], with the continuous advancement of regional science and technology, the largescale promotion of agricultural water-saving techniques bolsters the efficiency of agricultural water utilization. Statistics also show that, in 2011, the internal R&D expenditure in YREZ only accounted for 1.46% of GDP; in 2018, this ratio climbed up to 2.05%, up by 40% from the 2011 level. It is precisely the advancement of agricultural technology that keeps YREZ’s GAWUE at a high level.
WRE had a significant negative correlation with YREZ’s GAWUE, which verifies our expectation. Located in the southern part of China, YREZ enjoys rich precipitation and abundant surface water. The water resources in YREZ totals 961.6 billion m3, that is, 2,760 m3 per person. The per-capita water resources is significantly higher than the national level of 2,074.53 m3. The abundance of WRE weakens the awareness of water conservation in YREZ, and suppresses the GAWUE.
AWI had a negative impact on YREZ’s GAWUE at the significance level of 1%, which contradicts our expectation. The possible reason rests with its close relationship with agricultural production activities in YREZ. Despite relatively high consumption of agricultural water, the agricultural output of YREZ is quite high. Taking 2018 as an example, YREZ’s AFAF output was as high as 3,917.65 billion yuan, about 41.47% of the national total. The high AFAF output pulls up the GAWUE.
As expected previously, APS significantly suppressed YREZ’s GAWUE, that is, the GAWUE decreases with the growing the ratio of the planting area of food crops in the total planting area of all crops. As a main grain producing area in China, YREZ has been maintaining a high ratio of the planting area of food crops in the total planting area of all crops. For instance, the ratio was as high as 61.42% in 2011, and remained high at 61.28% in 2018. There is virtually no change in the ratio in the seven years.
FIA had a negative impact on YREZ’s GAWUE at the significance level of 1%. The FIA of YREZ, which is a key agricultural production area in China, is relatively large over the years. For example, YREZ contributed 36.82% of China’s total FIA in 2018. In addition, the agricultural irrigation methods in YREZ is still dominated by backward techniques like flood irrigation and sprinkler irrigation, resulting in serious water waste through utilization.
Based on the panel data of 11 YREZ regions in 2011-2018, this paper first selects the indicators for evaluating GAWUE, and then evaluates the GAWUEs in YREZ regions, using an EBM model containing undesired output. Besides, a Tobit model was constructed to verify the significance of the drivers of YREZ GAWUE. The main conclusions are as follows:
(1) YREZ’s GAWUE exhibits some regional differences. In the study period, the mean GAWUEs of Shanghai, Jiangsu, Zhejiang, and Sichuan reached the production frontier; those of Guizhou, Yunnan, Chongqing, and Hubei were relatively desirable, with a certain distance from the production frontier; the mean GAWUEs of Hunan, Jiangxi, and Anhui were undesirable, waiting for major improvement in future.
(2) From the GAWUE trends in different reaches, the GAWUE in the lower reaches remained unchanged on the production frontier throughout the study period; the GAWUE in the middle reaches did not change greatly before 2014, and slowly declined after that year; the GAWUE in the lower reaches stayed stable throughout the study period. Overall, the lower reaches had the highest GAWUE, followed by the upper reaches, while the middle reaches had the minimum GAWUE.
(3)The Tobit model manifests how each driver affects GAWUE. It can be seen that ATG and AWI greatly promote GAWUE, while FIL, WRE, APS, and FIA significantly suppress GAWUE.
This work is supported by Scientific Research Project of Education Department of Hubei Province (Grant No.: Q20201510), the Humanities and Social Science Foundation of Education Department of Hubei Province (Grant No.: 17Q094, 194101).
[1] Huang, Q., Wang, J., Li, Y. (2017). Do water saving technologies save water? Empirical evidence from North China. Journal of Environmental Economics and Management, 82: 1-16. https://doi.org/10.1016/j.jeem.2016.10.003
[2] Ali, M.H., Talukder, M.S.U. (2008). Increasing water productivity in crop production—A synthesis. Agricultural Water Management, 95(11): 1201-1213. https://doi.org/10.1016/j.agwat.2008.06.008
[3] Wallach, B. (2010). International commission on irrigation and drainage. The Professional Geographer, 36(4): 490-491. https://doi.org/10.1111/j.0033-0124.1984.00490.x
[4] Playán, E., Mateos, L. (2006). Modernization and optimization of irrigation systems to increase water productivity. Agricultural Water Management, 80(1-3): 100-116. https://doi.org/10.1016/j.agwat.2005.07.007
[5] Cao, X., Wu, M., Guo, X., Zheng, Y., Gong, Y., Wu, N., Wang, W.G. (2017). Assessing water scarcity in agricultural production system based on the generalized water resources and water footprint framework. Science of the Total Environment, 609: 587-597. https://doi.org/10.1016/j.scitotenv.2017.07.191
[6] Wang, W., Yu, Z., Zhang, W., Shao, Q., Zhang, Y., Luo, Y., Jiao, X., Xu, J. (2014). Responses of rice yield, irrigation water requirement and water use efficiency to climate change in China: Historical simulation and future projections. Agricultural Water Management, 146: 249-261. https://doi.org/10.1016/j.agwat.2014.08.019
[7] Cao, X., Ren, J., Wu, M., Guo, X., Wang, Z., Wang, W. (2018). Effective use rate of generalized water resources assessment and to improve agricultural water use efficiency evaluation index system. Ecological Indicators, 86: 58-66. https://doi.org/10.1016/j.ecolind.2017.12.016
[8] Kaneko, S., Tanaka, K., Toyota, T., Managi, S. (2004). Water efficiency of agricultural production in China: regional comparison from 1999 to 2002. International Journal of Agricultural Resources, Governance and Ecology, 3(3-4): 231-251. https://doi.org/10.1504/IJARGE.2004.006038
[9] Wang, F., Yu, C., Xiong, L., Chang, Y. (2019). How can agricultural water use efficiency be promoted in China? A spatial-temporal analysis. Resources, Conservation and Recycling, 145: 411-418. https://doi.org/10.1016/j.resconrec.2019.03.017
[10] Andre, F.J., Herrero, I., Riesgo, L. (2010). A modified DEA model to estimate the importance of objectives with an application to agricultural economics. Omega, 38(5): 371-382. https://doi.org/10.1016/j.omega.2009.10.002
[11] Njuki, E., Bravo-Ureta, B.E. (2018). Irrigation water use and technical efficiencies: Accounting for technological and environmental heterogeneity in US agriculture using random parameters. Water Resources and Economics, 24: 1-12. https://doi.org/10.1016/j.wre.2018.02.004
[12] Susaeta, A., Adams, D.C., Carter, D.R., Dwivedi, P. (2016). Climate change and ecosystem services output efficiency in southern loblolly pine forests. Environmental Management, 58(3): 417-430. https://doi.org/10.1007/s00267-016-0717-z
[13] Ali, M.K., Klein, K.K. (2014). Water use efficiency and productivity of the irrigation districts in Southern Alberta. Water Resources Management, 28(10): 2751-2766. https://doi.org/10.1007/s11269-014-0634-y
[14] Frija, A., Chebil, A., Speelman, S., Buysse, J., Van Huylenbroeck, G. (2009). Water use and technical efficiencies in horticultural greenhouses in Tunisia. Agricultural Water Management, 96(11): 1509-1516. https://doi.org/10.1016/j.agwat.2009.05.006
[15] Tone, K. (2001). A slacks-based measure of efficiency in data envelopment analysis. European Journal of Operational Research, 130(3): 498-509. https://doi.org/10.1016/S0377-2217(99)00407-5
[16] Fukuyama, H., Weber, W.L. (2009). A directional slacks-based measure of technical inefficiency. Socio-Economic Planning Sciences, 43(4): 274-287. https://doi.org/10.1016/j.seps.2008.12.001
[17] Tone, K., Tsutsui, M. (2010). An epsilon-based measure of efficiency in DEA–A third pole of technical efficiency. European Journal of Operational Research, 207(3): 1554-1563. https://doi.org/10.1016/j.ejor.2010.07.014
[18] Geng, Q., Ren, Q., Nolan, R.H., Wu, P., Yu, Q. (2019). Assessing China’s agricultural water use efficiency in a green-blue water perspective: A study based on data envelopment analysis. Ecological Indicators, 96: 329-335. https://doi.org/10.1016/j.ecolind.2018.09.011
[19] Bouman, B.A.M. (2007). A conceptual framework for the improvement of crop water productivity at different spatial scales. Agricultural Systems, 93(1-3): 43-60. https://doi.org/10.1016/j.agsy.2006.04.004
[20] Veettil, P.C., Speelman, S., Van Huylenbroeck, G. (2013). Estimating the impact of water pricing on water use efficiency in semi-arid cropping system: An application of probabilistically constrained nonparametric efficiency analysis. Water Resources Management, 27(1): 55-73. https://doi.org/10.1007/s11269-012-0155-5
[21] Xiong, Y.J., Hao, X.R., Liao, C., Zeng, Z.N. (2016). Relationship between water-conservation behavior and water education in Guangzhou, China. Environmental Earth Sciences, 75(1): 1-9. https://doi.org/10.1007/s12665-015-4873-x
[22] Wang, Y., Wan, T., Biswas, A.K. (2018). Structuring water rights in China: A hierarchical framework. International Journal of Water Resources Development, 34(3): 418-433. https://doi.org/10.1080/07900627.2017.1378627
[23] Varghese, S.K., Veettil, P.C., Speelman, S., Buysse, J., Van Huylenbroeck, G. (2013). Estimating the causal effect of water scarcity on the groundwater use efficiency of rice farming in South India. Ecological Economics, 86: 55-64. https://doi.org/10.1016/j.ecolecon.2012.10.005
[24] Griliches, Z. (1986). Productivity R & D and basic research at firm level in the 1970’s. American Economic Review, 76(1): 141–153. https://doi.org/10.1016/j.jenvman.2014.05.037
[25] Tobin, J. (1958). Estimation of relationships for limited dependent variables. Econometrica: Journal of the Econometric Society, 26(1): 24-36. https://doi.org/10.2307/1907382
[26] Azad, M.A., Ancev, T. (2014). Measuring environmental efficiency of agricultural water use: A Luenberger environmental indicator. Journal of Environmental Management, 145: 314-320. https://doi.org/10.1016/j.jenvman.2014.05.037