Iim Mucharam* | Ernan Rustiadi | Akhmad Fauzi | Harianto
© 2020 IIETA. This article is published by IIETA and is licensed under the CC BY 4.0 license (http://creativecommons.org/licenses/by/4.0/).
OPEN ACCESS
Indonesia is rated the highest rice consumer and the third-largest producer in the world, consequently, farming is one of the most strategic production systems in the country. Therefore, this study aims to assess the sustainability of rice farming at the provincial level in Indonesia. Furthermore, 32 sustainability indicators, which are categorized into five dimensions, namely economic, ecological, social, technological, and institutional were used. The rapid appraisal approach (Rapsusagri), consisting of multi-dimensional scaling (MDS) analysis was adopted to assess the sustainability of rice farming. Monte Carlo simulation was used to define the validity and sensitivity analysis to assess the dominant attributes which affect sustainability. The result showed that the economic and social dimensions are at a better level, meanwhile the ecological, technological, and institutional still have various weaknesses and needs improvement. Furthermore, irrigated paddy areas, agricultural infrastructure, rice productivity, use of chemical and organic fertilizers, cropping index, land suitability, village accessibility, officers, and agricultural extension institution were pointed out as the leveraging indicators for sustaining the rice farming system. Also, provinces in Java Island were found to have higher sustainability levels than others. However, it is predicted that this condition will last for a short period due to rapid land conversion, therefore Indonesia needs to consider the development of rice production areas outside Java islands.
agriculture, multidimensional scaling, rapid appraisal, rice production area, sustainability
Rice is the most important food crop in Indonesia, which is the third-largest producer in the world after China and India and one of the largest consumers [1, 2]. The data of the rice harvested area between 1980 and 2016 show a fluctuating pattern that tends to increase continuously with a relatively small growth rate of 1.48% per year. Similarly, the production data in 1980-2016 fluctuate considerably but notably rise across the period with an average growth rate of 2.82% per year. The production rose from 2.75 tons/ha in 1980 to 5.2 tons/ha in 2018, however, this is not always followed by an increase in farmers' welfare. Furthermore, most rice farmers in Indonesia (77%) are subsistence farmers [1], and the majority (almost 50% of the total) of production is concentrated in Java [2].
Some of the major problems associated with the production of rice in Indonesia include diminishing paddy field due to land conversion to non-agricultural purposes (commercial, industrial, urban) estimated at 100,000 ha annually; Enormous population pressure on each hectare available in the rice cultivation center; Declines in the average farm size due to traditional inheritance practices; Low budget for the development and improvement of irrigation infrastructure; Lack of access to capital by poor farmers; Increasing production costs; and inadequate numbers of qualified and highly educated agricultural pest management officers [1, 3].
Furthermore, the future challenge of agriculture is not only to produce enough food for a population that grows continuously at an acceptable ecological cost but also to achieve equitable income among agricultural actors. To achieve this requires a sustainable agricultural system [4], which is not a new concept. Since 1988, FAO [5] defined sustainable agriculture as: "The management and conservation of the natural resource base, as well as the orientation of technological and institutional change to ensure the attainment and continued satisfaction of human needs for the present and future generations. Such development conserves land, water, plant, and animal genetic resources, which is environmentally non-degrading, technically appropriate, economically viable, and socially acceptable."
Presently, the implementation of the sustainable development program is a concern of local governments. Therefore, this study focused on assessing sustainability at the provincial level. Furthermore, the assessment of the implementation of sustainable agriculture at the regional level is essential for several reasons, namely: (1) it is more operational compared to the national level [6]; (2) it is a tool to integrate the principles of sustainable development into the regional planning and development [7]; (3) the use of these indicators at the national level for large countries such as Indonesia causes sustainability at the regional which is inadequately displayed [6]; and (4) it is a key to achieving uniform and clear operational objectives for the implementation of sustainable development at the national level [8].
This study aims to measure the sustainability of rice farming in Indonesia as well as identify the factors that leverage the sustainability of its cultivation. Previous studies have measured the sustainability of rice farming in Indonesia but are still limited to agricultural or local levels.
This study is divided into four sections, the first describes the background and objectives while the second deals with the methods, indicators selected in the analysis, and the data sources used. Meanwhile, the third section describes the results and discussion of the analysis and the last part is the conclusion.
2.1 Location
The study is conducted using panel data from 15 central rice production provinces in Indonesia, namely: Aceh, North Sumatra, West Sumatra, South Sumatra, Lampung, West Java, Central Java, East Java, Bali, West Nusa Tenggara (NTB), West Kalimantan, South Kalimantan, South Sulawesi, and Central Sulawesi. The details of the panel data are presented in Table 1.
2.2 Data collection
The study used panel data from Statistics Indonesia (BPS), the Ministry of Agriculture, the Ministry of Environment and Forestry, and the Ministry of Agrarian Affairs and Spatial Planning/National Land Agency (BPN).
2.3 Data analysis
The sustainability indicators are classified into five dimensions, namely economic, ecological, social, technological, and institutional [9, 10], which were obtained from the FGD results, literature review, and Principal Component Analysis (PCA) [11] as presented in Table 1. The existing data were analysed using the Rapsusagri method modified from Rapfish (Rapid Appraisal for Fisheries) developed by the Fisheries Center, University of British Columbia, Canada.
Rapsusagri adopts the principles embedded in the Rapfish method, including: (1) a rapid assessment method of the sustainability status of an object based on several attributes, (2) attributes are redefined or replaced according to available information [12, 13]; (3) a multi-criteria decision-making method based on multidimensional scaling (MDS); and (4) the use of ordination method to determine the status of sustainability. However, Rapfish was originally designed for sustainability analysis in the fisheries sector, the principle developed in this method is implemented in others, such as the agricultural sector [14, 15].
In contrast to the previous version [12-15], the 2013 scaling rate of Rapfish for all attributes was standardized from 0 (worst) to 10 (best), where 4/10 and 7/10 represents a threshold value for the poor and good scores, respectively [13]. Also, upper and lower limits are required to avoid uncertainty in each attribute.
The earlier versions of Rapfish used MDS from the SPSS package or Visual Basic for Excel [12]. However, the application developed by Rapfish.org in this study is the 2013 version with R program, which possesses a more stable platform [9, 14].
The first step of the Rapsusagri analysis is to determine the indicators suitable for the sustainability dimension. Its critical point lies in determining which attributes are selected to be ranked on specific dimensions. Fauzi [14], explained that to produce proper ordination, the number of indicators in each dimension should be more than six. Furthermore, literature studies and FGDs with stakeholders were used to determine the sustainability indicators.
To determine the sustainability status of each province, the dimensions and indicators of rice farming, followed by an ordination analysis, were carried out. This assessment depends on the scoring approach of the indicators. The scoring in the 2013 version of Rapfish has changed from that of 2000 [9, 14], in which the assessment is non-monotonic. That is, the value of 0 indicate bad score, but it may represent good on other indicators. However, in the latest version (2013), the assessment is monotonic with a value of 0 and 10 as the minimum (bad) and maximum (good) value, respectively. The difference lies in the description of the indicators to be analyzed [14].
In this analysis, the valuation pattern of most indicators uses 0 and 10 as the minimum and maximum value, respectively. However, there are exceptions in the use of chemical fertilizers and pesticides, as well as the population growth rate. The Indicators used in these cases are 10 and 0 for the minimum and maximum value respectively, which is due to the impact of rice farming sustainability. In addition, the Rapsusagri analysis with R needs to be limited by the lower and upper bound of the score to describe the uncertainty [14].
The leverage analysis is carried out after the ordination to determine the dominant indicators in a study [14]. This makes it possible to determine the changes in the ordination (bad-good position) when the attributes are issued individually, or in other words, the leverage work as a sensitivity analysis.
The Rapsusagri method is equipped with a Monte Carlo Analysis to test the impact of random errors on the Rapid Appraisal model [14]. These errors occur due to the following factors: (1) errors in the procedures of determining attribute (2) understanding the attributes; (3) variations in scoring due to the different opinions or ratings; (4) the stability of the MDS analysis process; (5) missing data or entry errors; and (6) the stress value is too high.
Table 1. Indicators of sustainable rice farming
|
No |
Indicator |
Operational Definition |
Unit |
Rapsusagri Scoring |
Data Source |
|
|
Economic Dimension |
||||||
|
1 |
Food Crops Farmer Terms of Trade (FTT) |
The average value of the ratio between the price index received by farmers and the price index paid by farmers in 2014-2018 |
% |
Above the national FTT: 9-10 Approaching national FTT: 7-8 3-5% below the national FTT: 5-6 6-10% below the national FTT: 3-4 >10% below the national FTT: 0-2 |
BPS-Statistics Indonesia (BPS) |
|
|
2 |
Rice productivity |
Average rice production per unit area in 2014-2018 |
Tons/Hectare |
Above national average productivity: 9-10 Approaching national productivity: 7-8 5-20% below national productivity: 5-6 21-30% below national productivity:3-4 >30% below national productivity: 0-2 |
BPS |
|
|
3 |
Percentage of irrigated paddy field area |
The average percentage of total irrigated paddy fields to the total area of paddy fields in 2014-2018 |
% |
<30%: 0-3 31-55%: 4-5 56-80%: 6-7 >80%: 8-10 |
BPS |
|
|
4 |
Agricultural Infrastructure |
Indicator values for infrastructure conditions in the 2018 Village Development Index describe infrastructure conditions in rural areas except for accessibility /transportation |
Index value |
Value index<30: 0-3 31-40: 4-5 41-50: 6-7 >50: 8-10 |
BPS |
|
|
5 |
Food crop subsector labor |
Share of the agricultural workforce in the food crop subsector compared to the total workforce |
% |
<15%: 0-2 15-25%: 3-4 26-35%: 5-6 36-45%: 7-8 >45%: 9-10 |
BPS |
|
|
6 |
Financial feasibility of rice farming (B/C Ratio) |
Value of B/C Ratio for 2017 Rice Farmer Cost Structure Survey |
B/C Ratio Value |
<0.30: 0-2 0.30-0.49: 3-4 0.50-0.69: 5-6 0.70-0.89: 7-8 |
BPS |
|
|
Ecological Dimension |
||||||
|
1 |
Use of organic fertilizers |
The average amount of organic fertilizer used in rice farming per rice field area in 2014-2018 |
Tons/Ha |
<0.10 tons/ha: 0-2 0.11-0.15 tons/ha: 3-4 0.16-0.20 tons/ha: 5-6 0.21-0.25 tons/ha: 7-8 >0.25 tons/ha: 9-10 |
BPS |
|
|
2 |
Use of chemical fertilizers |
The average amount of chemical fertilizer used in rice farming per area of rice fields in 2014-2018 |
Tons/Ha |
<0.50 tons/ha: 8-10 0.50-1.00 tons/ha: 6-7 1.10-1.50 tons/ha: 3-5 >1.50 tons/ha: 0-2 |
BPS |
|
|
3 |
Use of chemical pesticides |
The average amount of pesticide stocks for rice farming in 2014-2018 in each province |
Ton |
<20 tons: 8-10 20-39 tons: 6-7 40-59 tons: 4-5 >70 tons: 0-3 |
Ministry of Agriculture (MoA) |
|
|
4 |
Water Quality Index (WQI) |
Water Quality Index (Measured parameters: Total Suspended Solid (TSS), Dissolved Oxygen (DO), Biological Oxygen Demand (BOD), Chemical Oxygen Demand (COD), Total Phosphate, Fecal Coli, and Total Coliform) |
|
>10% above the national WQI: 8-10 6-10% above the national WQI: 6-7 0-5% above the national WQI: 4-5 1-5% below the national WQI: 2-3 > 5% below the national WQI: 0-1 |
BPS |
|
|
5 |
Cropping index (CI) |
The average cropping index value for rice in each province in 2014-2018 |
Index Value |
CI <1.00: 0-2 CI 1.00-1.25: 3-4 CI 1.26-1.75: 5-6 CI 1.76-2.00: 7-8 CI 2.00-2.50: 9-10 |
MoA |
|
|
6 |
Land suitability |
Percentage of land area suitable for rice cultivation based on ZAE Map |
% |
<15%: 0-2 15-25%: 3-4 26-35%: 5-6 36-45%: 7-8 >45%: 9-10 |
MoA |
|
|
7 |
The rate of conversion of paddy fields |
The average rate of conversion of paddy fields in each province in 2014-2018 |
% |
<-5%: 0-2 -5 to 0%: 3-4 0 to 3%: 5-6 3 to 6%: 7-8 >6%: 9-10 |
BPS |
|
|
Social Dimension |
||||||
|
1 |
Population growth rate |
The annual rate of growth of population in 2014-2018 |
% |
>2.0%: 0-2 1.51-2.0%: 3-5 1.01-1.50%: 6-7 <1%: 8-10 |
BPS |
|
|
2 |
Access to agricultural finance |
Percentage of villages based on the presence of financial institutions in 2018 |
% |
<30%: 0-2 31-50%: 3-4 51-70%: 5-6 71-90%: 7-8 >90: 9-10 |
BPS |
|
|
3 |
Youth participation rates in the agricultural sector |
The average percentage of the agricultural sector workforce aged 20-40 years in 2018 |
% |
<30%: 0-2 30-40%: 3-4 41-50%: 5-6 51-60%: 7-8 >60: 9-10 |
BPS |
|
|
4 |
Village Accessibility |
Indicator values for village accessibility conditions in the Village Development Index 2018, |
% |
>10% above the national value: 9-10 0-10% above the national value: 7-8 0-10% below the national value: 5-6 11-20% below the national value: 3-4 >20% below the national value: 0-2 |
BPS |
|
|
5 |
The level of poverty in rural areas |
The average percentage of the rural poor in 2014-2018 |
% |
<15%: 0-2 15-25%: 3-4 26-35%: 5-6 36-45%: 7-8 >45%: 9-10 |
BPS |
|
|
6 |
Rice Farmers Households |
Share of rice farming households to total agricultural households |
% |
<40%: 0-2 40-60%: 3-4 61-80%: 5-6 81-90%: 7-8 >90: 9-10 |
BPS |
|
|
Technology Dimension |
||||||
|
1 |
Integrated Pest Management |
The average land area for Integrated Rice Pest Management in 2016-2018 |
Ha |
<400 Ha: 0-2 400-800: 3-4 801-1200: 5-6 1201-1400: 7-8 >1400: 9-10 |
MoA |
|
|
2 |
Climate Change Mitigation |
Average land area for climate change mitigation program in 2016-2018 |
Ha |
<10 Ha: 0-2 10-20 Ha: 3-4 21-30 Ha: 5-6 31-40 Ha: 7-8 >40 Ha: 9-10 |
MoA |
|
|
3 |
Application of ecologically-friendly rice cultivation technology |
The agricultural land area that applies ecologically friendly rice farming technology (healthy rice cultivation) |
Ha |
<2000 Ha: 0-2 2000-4000 Ha: 3-4 4001-6000 Ha: 5-6 6001-8000 Ha: 7-8 >8000 Ha: 9-10 |
MoA |
|
|
4 |
Use of agricultural machine tools |
Percentage of the use of mechanization technology at rice farming business (Survey result 2018) |
% |
<10%: 0-2 10-15%: 3-4 16-20%: 5-6 21-25%: 7-8 >25%: 9-10 |
BPS |
|
|
5 |
Agricultural households that have participated in agricultural extension |
Share of agricultural households that have participated in agricultural counseling to the total number of farmer households |
% |
<15%: 0-2 15-25%: 3-4 26-35%: 5-6 36-45%: 7-8 >45%: 9-10 |
MoA |
|
|
6 |
Agricultural extension officer |
The ratio of agricultural extension officer to the number of villages |
% |
<40%: 0-2 40-60%: 3-4 61-80%: 5-6 81-90%: 7-8 >90: 9-10 |
MoA |
|
|
Institutional Institution |
||||||
|
1 |
Institutional extension of agriculture |
Share of extension institutions compared to the number of farmers |
% |
<15%: 0-3 15-25%: 4-5 26-35%: 6-7 36-45%: 8-9 >45%: 10 |
MoA |
|
|
2 |
Farmer Group Capacity |
Share of Farmer Groups with Advanced-Middle-Main qualifications compared to Total Farmer Groups |
% |
<15%: 0-2 15-25%: 3-4 26-35%: 5-6 36-40%: 7-8 >40%: 9-10 |
MoA |
|
|
3 |
Institutional Agricultural Mechanization |
Share of total Agricultural Mechanization Service Management Units compared to the number of farmer groups |
% |
<15%: 0-2 15-25%: 3-4 26-35%: 5-6 36-40%: 7-8 >40%: 9-10 |
MoA |
|
|
4 |
Farmers Economic Institution |
The ratio of farmer economic institutions to the number of farmer groups |
% |
<4%: 0-2 4-8%: 3-4 9-12%: 5-6 13-16%: 7-8 >16%: 9-10 |
MoA |
|
|
5 |
Sustainable Agriculture Land Protection Regulation |
Regional compliance to implement the Sustainable Agriculture Land Protection Regulation (LP2B) in Regional Regulation which is defined as a Percentage of LP2B land compared to provincial land area |
% |
<5.00%: 0-2 5.00-7.50%: 3-4 7.51-10.00%: 5-6 10.01-12.50%: 7-8 >12.5%: 9-10 |
Ministry of Agrarian Affairs and Spatial Planning |
|
|
6 |
Rice Farmer Insurance Program |
Share of paddy land area that gets Farmer Business Insurance to the total paddy field area |
% |
<4%: 0-2 4-8%: 3-4 9-12%: 5-6 13-16%: 7-8 >16%: 9-10 |
MoA |
|
3.1 Sustainability ordination
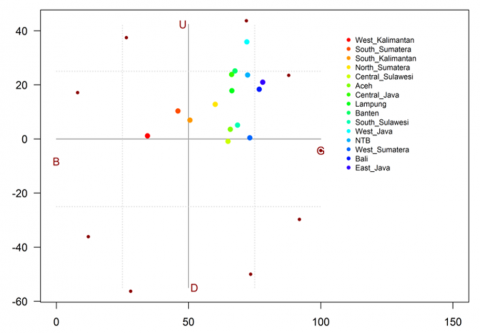
The results of Rapsusagri analysis are detailed based on the economic, ecological, social, technology, and institutional dimensions of 15 provinces in Indonesia. Also, the results of the ordination of the economic sustainability dimension are shown in Figure 1, which illustrates the conditions of sustainability in each province.
Figure 1. Results of economic dimension ordination
The information in Figure 1 showed that East Java, Bali, and West Sumatra are the provinces with the highest economic sustainability compared to others. This condition is closely related to the improvement of agricultural infrastructure in these three provinces, which is relatively better than others. Furthermore, the results of the Cost Structure of Paddy Cultivation Household Survey [3] show that the type of agricultural land for farming activities significantly affects the productivity of commodities cultivated by farmers. Also, rice plants in irrigated paddy fields have higher productivity than the non-irrigated. This is in line with the report of Simatupang and Timmer research [16], that one of the most appropriate efforts to increase rice production is through the rehabilitation of irrigation networks.
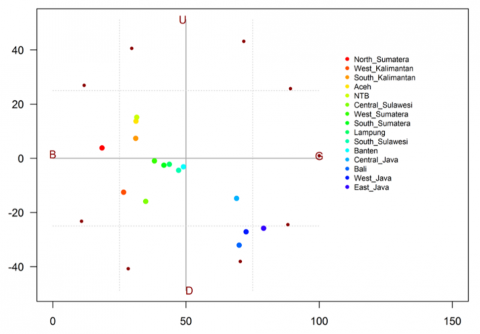
The ordination of the dimension of ecological sustainability as represented in Figure 2 shows that no province scored above 70. Also, the low scores indicate that no province has a good condition of the dimension. Meanwhile, Banten, Bali, and South Sumatra have a sustainability score for the ecological dimension close to 70. A significant cause of ecological damage is the excessive use of chemical fertilizers and pesticides [1, 17]. Furthermore, the International Fertilizer Industry Association (IFA) reveals that Indonesia's fertilizer consumption increased rapidly from 0.14 million tons in 1961 to 4.47 million tons in 2009, and about 52% was used for rice production [1].
Figure 2. Results of ecological dimension ordination
Due to ecological damage, land deterioration causes a decrease in the suitability for rice farming, resulting in a significant conversion over the years. This unanticipated condition leads to a decline in the paddy field area and significantly impact national rice production.
The results further show that the social sustainability dimension (Figure 3) has a good score. There are no provinces that score below 50, while those with the highest are West Nusa Tenggara (NTB), West Sumatra, and South Kalimantan. This score is closely related to the social conditions of the three provinces, which are relatively better compared to others. Interestingly, these provinces are located outside of Java, which has always been the primary national rice producer. In contrast, Nurmalina [18] reported that Java Island has a higher sustainability value than other regions for the social dimension. The difference in the result of sustainability analysis is due to the different indicators used and the scoring methods.
Figure 3. Results of social dimension ordination
The technological dimension in Figure 4 shows the unsustainable conditions, in which only one (West Java) of 15 provinces scores above 50, while the others have less. The three provinces (West Java, East Java, and South Sulawesi) that achieve the highest score on the technological dimension have the most significant national rice production. Furthermore, the score of technological sustainability in these provinces shows that the use of technology needs improvement. Presently, farmers still use conventional agricultural technology that is less ecologically friendly. Also, the government is not focused on developing the use of ecologically friendly rice cultivation technology and the implementation of climate change mitigation as well as integrated pest control is also low. The effectiveness of government efforts in the provision of agricultural machinery remains questionable.
Figure 4. Results of technology dimension ordination
Moreover, there are several cases of rejection in some areas due to incompatible agricultural machine tools as well as the conditions of land and the needs of farmers. On the other hand, the underutilization of environmentally-friendly rice cultivation technology is due to insufficient agricultural extension workers. This condition leads to a stagnation in the dissemination of technology from research and development institutions to farmers.
The results of the ordinance on the dimension of institutional sustainability are shown in Figure 5, which illustrates the varying conditions in each province. Furthermore, the provinces in Java and Bali island show better conditions of institutional sustainability compared to others. This relates to the condition of extension institutions, farmer groups, and economic institutions in Java and Bali, which are more developed than other provinces.
Figure 5. Results of institutional dimension ordination
In addition, implementing regulations to protect agricultural land is critical policy to maintaining the sustainability of rice farming. The amount of new paddy fields resulting from the agricultural extensification program is still inferior compared to its conversion to land for other uses [19]. On the other side, the decline in productive agricultural land causes regional compliance to implement regulation for the protection of sustainable agricultural land.
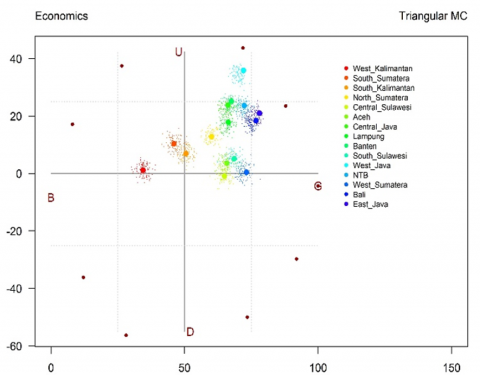
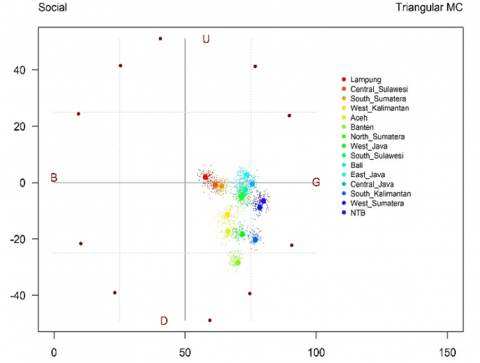
A robustness test in the form of Monte Carlo analysis is conducted to avoid errors in the determination of indicator scores. This is due to imperfect knowledge about the analyzed unit, incorrect understanding of indicators and their scores, and data entry errors [12, 14]. Monte Carlo triangular analysis was used, and it included the minimum, the most likely, and the maximum value.
Furthermore, Monte Carlo analysis is carried out using the scatter plot method, which shows the ordination of each dimension. The results of 100 repetitions show that MDS does not experience significant changes, as seen in Figure 6. This analysis showed that the results of the MDS ordination had overcome the random errors.
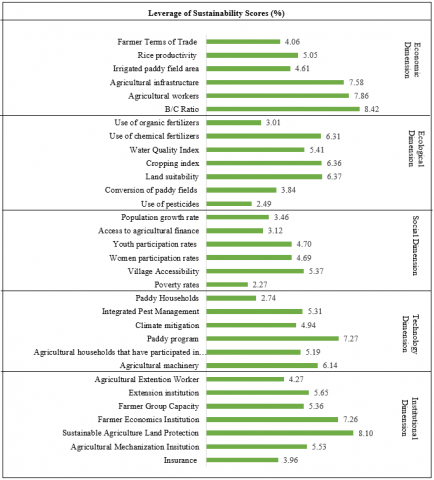
3.2 Leverage analysis
The leverage (Figure 7) shows the change in ordination caused by omitting several indicators or sensitivity analysis [12-14]. On the economic dimension, the indicator "B/C ratio" is the essential attribute of sustainable rice farming ordination with a value of 6.69%. Furthermore, the leverage value indicates that when the B/C ratio indicator is removed, then the difference in the position of the sustainability ordinance changes by 8.42%.
Also, indicators that become the leverage for the economic dimension are agricultural labour and infrastructure with a value of 7.86% and 7.58%, respectively. These indicators show a reasonably significant leverage value compared to others within the economic dimension. This is in line with Rasmussen et al. and Wardana et al. [20, 21], which explains the importance of irrigation efficiency and the provision of infrastructure for sustainable agricultural production.
Furthermore, land suitability in the ecological dimension is the most crucial attribute in the ordination of sustainable rice farming with a value of 6.37%. The Ministry of Agriculture published Land Suitability Criteria for Agricultural Commodities and Agro-Ecological Zone Maps in 2013 as a reference for development. They also published the Cropping Calendar, also known as KATAM, which makes it easy for farmers and stakeholders to determine the right planting time, application of fertilizer, and provide various information related to rice cultivation needed by farmers and the government.
Other indicators that become leverage for the ecological dimension are the Cropping Index and the use of chemical fertilizer with a value of 6.36% and 6.31%, respectively. The excessive use of chemical fertilizers has long been the focus of experts and policymakers due to its impact on land and water pollution [22].
Figure 6. Monte Carlo analysis
Figure 7. Leverage of sustainability scores
One of the government's program to increase rice production is the enhancement of the Cropping Index [22]. This was implemented by improving irrigation systems and providing production facilities to enable rice to be planted two to three times a year. However, the continuity of this cultivation system raises fears of pest outbreaks, especially the explosion of the population of brown plant hoppers, which are very detrimental to farmers.
The results of the leverage analysis on the social dimension show that the village accessibility is the most crucial attribute on the ordination of sustainable rice cultivation at the provincial level with a value of 5.37%. This includes the availability and access to transportation facilities such as traffic as well as road quality and accessibility [23]. Furthermore, without adequate access to the village, social life in the countryside, which is the center of rice cultivation, will be affected. Another indicator that becomes leverage on the social dimension is the level of participation of young people and women in the agricultural sector with a value of 4.70% and 4.69%, respectively.
The institutional dimension shows that implementing regulation for the protection of sustainable agriculture land with a value of 8.10% is the most significant attribute of ordination at the provincial level. These show the importance of implementing regulations in each province and district to prevent the use of productive agricultural land for other purposes.
The second influential attribute in the ordination of sustainable agriculture is "Farmers Economic Institution" with a value of 7.26%. This is in line with the government policy that encourages farmers to do business on a corporate basis [24]. Furthermore, with the leverage value of 5.65%, "Agricultural extension institutions" is the third most essential attribute in the ordination of sustainable agriculture. Strengthening this Institution plays a vital role in sustainable agricultural development. In addition, the modernization of agriculture requires a new extension system to anticipate various global forces that influence change on the social, economic, and political order [25].
The radar diagram in Figure 8 shows that almost all dimensions of the provinces in Java and Bali have a higher value of sustainability compared to others, except for the social dimension. This is in line with the report of Takariyana [2] and Panuju et al. [26], that more than half of the national rice supply comes from Java. This condition undoubtedly affects the sustainability of rice farming because the rice fields in Java are declining, and the population is also increasing. Therefore, it is necessary to expand rice centers on other islands, especially for provinces whose sustainability value is quite high.
Figure 8. Radar and kite diagram
The social sustainability dimension in provinces of West Nusa Tenggara, West Sumatra, and South Kalimantan achieve the highest sustainability score. The Kite Diagram shows that the score in the technological dimension is the lowest compared to others. Furthermore, in order to maintain the sustainability of rice farming, new technologies are needed, in terms of seeds, cropping patterns, agricultural mechanization, integrated pest control, climate change adaptation, and others while taking into account environmentally friendly cultivation techniques. The increase in rice production remains in line with the rise in the sustainability value of the social, ecological, and institutional dimensions.
The sustainability status of rice farming development programs in Indonesia is described comprehensively through Rapsusagri Analysis, which is used by policymakers to design a follow-up and provide feedback in response to this rapid evaluation.
The most important indicators (of leverage) on the ordinance of sustainable agricultural development at the provincial level include irrigated paddy area, agricultural infrastructure, rice productivity, the use of chemical and organic fertilizers, Cropping Index, land suitability, agricultural extension officers and institution, and village accessibility.
Furthermore, the provinces in Java have higher values of sustainability compared to others. However, this condition is predicted to last for a short period. Therefore, the Indonesian Government must give more attention to develop other regions outside Java as a new rice production center.
The Indonesian government needs to focus more on the Technology Dimension due to its low sustainability. Without technological innovation, it is difficult to achieve rice farming sustainability, which will in turn jeopardize food sovereignty in the country.
The use of 15 out of the 34 provinces of rice center in Indonesia limits this study's analysis. To obtain a more comprehensible result on the sustainability of rice farming, further research needs to incorporate all provinces. Also, several indicators have not been reviewed due to limited data availability.
Furthermore, this study is useful as a suitable reference to determine the effectiveness of government programs in increasing sustainable rice production. Also, it should be adopted by policymakers to formulate follow-up and feedback in response to the evaluation results concerning the provinces with the lowest level of sustainability conditions and the most important indicators (leverage).
The authors express their gratitude and appreciation to the Agricultural Extension and Human Resource Development Agency (BPPSDMP) Ministry of Agriculture Republic of Indonesia for funding this study through the Scientific Publication Grant 2019.
[1] [GRiSP] Global Rice Science Partnership. (2013). Rice Almanac; 4th edition. International Rice Research Institute, Los Banos.
[2] Takariyana, H. (2016). Outlook Komoditas Pertanian Padi. Nuryati, L., Waryanto, B., Widaningsih, R., (eds). Pusat Data dan Sistem Informasi Pertanian, Jakarta.
[3] [BPS] Statistics Indonesia. (2017). Results of Cost Structure of Paddy Cultivation Household Survey 2017 (SOUT2017-SPD). BPS-Statistics Indonesia, Jakarta.
[4] Reeves, T.G., Thomas, G., Ramsay, G. (2016). Save and Grow in Practice: Maize, Rice, Wheat. FAO, Rome.
[5] Gennari, P., Navarro, D.K. (2019). The challenge of measuring agricultural sustainability in all its dimensions. Journal of Sustainability Research, 1: e190013. https://doi.org/10.20900/jsr20190013
[6] Rahma, H., Fauzi, A., Juanda, B., Widjojanto, B. (2019). Development of a composite measure of regional sustainable development in Indonesia. Sustainability, 11(20): 5861. https://doi.org/10.3390/su11205861
[7] Bakri, B., Rustiadi, E., Fauzi, A., Adiwibowo, S. (2018). Regional sustainable development indicators for developing countries: Case study of provinces in Indonesia. International Journal of Sustainable Development, 21(1-4): 102-130. https://doi.org/10.1504/IJSD.2018.100827
[8] Mishenin, Y., Koblianska, I., Medvid, V., Maistrenko, Y. (2018). Sustainable regional development policy formation: Role of industrial ecology and logistics. Entrepreneurship and Sustainability Issues, 6(1): 329-341. https://doi.org/10.9770/jesi.2018.6.1(20)
[9] Pitcher, T.J., Lam, M.E., Ainsworth, C., Martindale, A., Nakamura, K., Perry, R.I., Ward, T. (2013). Improvements to Rapfish: A rapid evaluation technique for fisheries integrating ecological and human dimensions. Journal of Fish Biology, 83(4): 865-889. https://doi.org/10.1111/jfb.12122
[10] Deng, F.M., Liu, C.M., Liang, X.D. (2017). Measurement of regional agricultural sustainable development system based on dissipative structure theory: A case study in Sichuan Province, China. Sustainability, 9(11): 2047. https://doi.org/10.3390/su9112047
[11] Mucharam, I., Rustiadi, E., Fauzi, A., Harianto. (2019). Development of sustainable agricultural indicators at provincial levels in Indonesia: A Case study of rice. IOP Conference Series: Earth and Environmental Science, 399: 012054. https://doi.org/10.1088/1755-1315/399/1/012054
[12] Kavanagh, P., Pitcher, T.J. (2004). Implementing Microsoft Excel software for Rapfish: A technique for the rapid appraisal of fisheries status. Fisheries Centre Research Reports, 12(2).
[13] Pitcher, T.J., Preikshot, D. (2001). RAPFISH: A rapid appraisal technique to evaluate the sustainability status of fisheries. Fisheries Research, 49(3): 255-270. https://doi.org/10.1016/S0165-7836(00)00205-8
[14] Fauzi, A. (2019). Teknis Analisis Keberlanjutan, Gramedia Pustaka Utama, Jakarta.
[15] Dharmawan, A.H., Fauzi, A., Putri, E.I.K., Pacheco, P., Dermawan, A., Nuva, N. (2020). Bioenergy policy : The biodiesel sustainability dilemma in Indonesia. International Journal of Sustainable Development and Planning, 15(4): 537-546. https://doi.org/10.18280/ijsdp.150414
[16] Simatupang, P., Timmer, C.P. (2008). Indonesian rice production: Policies and realities. Bulletin of Indonesian Economic Studies, 44(1): 65-80. https://doi.org/10.1080/00074910802001587
[17] Mohamed, Z., Terano, R., Shamsudin, M.N., Abd Latif, I. (2016). Paddy farmers’ sustainability practices in Granary Areas in Malaysia. Resources, 5(2): 17. https://doi.org/10.3390/resources5020017
[18] Nurmalina, R. (2008). Analisis Indeks dan Status Keberlanjutan Sistem Ketersediaan Beras di Beberapa Wilayah Indonesia. Jurnal Agro Ekonomi, 26(1): 47-79.
[19] Shofiyati, R., Pasaribu, S.M. (2016). Perspektif Aplikasi Penginderaan Jauh Mendukung Perluasan Areal Pertanian. In: Pasandaran, E., Heriawan, R., Syakir, M. (eds) Sumber Daya Lahan dan Air: Prospek pengembangan dan pengelolaan, IAARD Press, Jakarta.
[20] Birovljev, J., Kleut, Z. (2017). Analysis of the factors of sustainable agriculture in Serbia and the European Union member states. Ekonomika Preduzeca, 64(7-8): 469-477. https://doi.org/10.5937/ekopre1608469b
[21] Rasmussen, L.V., Agrawal, A., Oldekop, J.A. (2016). A review of indicators used to assess the sustainability of agricultural commodity production. Review paper for the Scientific and Technical Advisory Panel of the Global Environment Facility. 50th GEF Council Meeting June 07-09, Washington, D.C.
[22] Wardana, I.P., Zaini, Z., Sembiring, H. (2016). Sustainable rice production intensification. In: Pasandaran, E., Haryono, (eds) Toward a Resilience Food and Nutrition Security in Indonesia. IAARD Press, Jakarta.
[23] [BPS] Statistics Indonesia. (2019). Indikator Pembangunan Desa. Masfufah, Suryaningsih, T., Naim, A., (eds.) BPS-Statistics Indonesia, Jakarta.
[24] Kementerian Pertanian. (2020). Pedoman Penumbuhan dan Pengembangan Korporasi Petani di Kawasan Pertanian. Hermanto (eds), Kementerian Pertanian, Jakarta.
[25] Syahyuti, N. (2018). Modernisasi Penyuluhan Pertanian di Indonesia: Dukungan Undang-Undang Nomor 23 Tahun 2014 terhadap Eksistensi Kelembagaan Penyuluhan Pertanian di Daerah. Analisis Kebijakan Pertanian, 14(2): 83-96. https://doi.org/10.21082/akp.v14n2.2016.83-96
[26] Panuju, D.R., Mizuno, K., Trisasongko, B.H. (2013). The dynamics of rice production in Indonesia 1961-2009. Journal of the Saudi Society of Agricultural Sciences. 12(1): 27-37. https://doi.org/10.1016/j.jssas.2012.05.002