Lirong Ding | Qing Xia*
© 2020 IIETA. This article is published by IIETA and is licensed under the CC BY 4.0 license (http://creativecommons.org/licenses/by/4.0/).
OPEN ACCESS
This paper establishes an evaluation metric system (EMS) for low-carbon economic gain efficiency (LCEGE) containing the carbon sink element, and measures the LCEGEs in the 11 provincial administrative regions in the Yangtze River Economic Corridor (YREC) of 2000-2017 with the directional distance function (DDF) model. Furthermore, the Tobit model was selected for the empirical analysis on the influence of financial development on LCEGE. The results show that: the provinces in YREC had certain disparities in LCEGE. Most provinces achieved desirable LCEGEs, but a few provinces failed to do so. The LCEGE in the lower part changed little in the target period, while that in the middle part and upper part varied in two phases. Besides, there are obvious differences in the mean LCEGE between the lower part, middle part, and upper part. In the target period, the three parts of the YREC can be ranked as lower part, middle part, and upper part by LCEGE. The results of Tobit model reveal that the LCEGE in the YREC can be greatly promoted by financial scale, and clearly suppressed by financial structure. Among the control variables, foreign direct investment significantly promotes LCEGE; technical innovation, and energy structure significantly suppresses LCEGE; industrial structure and environmental regulation have an insignificant influence on LCEGE.
economic development, Low-carbon economic gain efficiency (LCEGE), Yangtze River Economic Corridor (YREC), directional distance function (DDF) model
Since the late 1970s, China has quickly developed into a major economy, second only to the United States (US). However, the economy of China has been growing in the traditional extensive model, featuring high energy consumption, pollution, and emissions. Lots of energy is consumed and a huge amount of carbon dioxide (CO2) is released by the economic development.
In 2017, the energy consumption in China totaled 4.49 billion tons of coal equivalent (TCE), up by 2.9% over the previous year, taking up 23% of global energy consumption. Carbon Brief reported that China emitted 9.775 billion tons of CO2 in 2017, more than any other country.
To reduce carbon emissions, China made the following pledge on the 2015 United Nations Climate Change Conference: hitting the peak carbon emissions around 2030; reducing 60-65% of the carbon emissions per unit of gross domestic product (GDP) from the level of 2005; cutting the consumption of non-fossil energy as a proportion of primary energy consumption to around 20% [1]. This solemn pledge makes carbon emissions a challenging task for the country.
As the largest developing country, China needs to fulfil the mission of maintaining steady economic gain, in addition to cutting carbon emissions. It is particularly significant to realize the low-carbon economic development, that is, achieving sustained economic gain while implementing energy conservation and emission reduction (ECER).
The Yangtze River Economic Belt (YREC) is one of the most economically dense regions in China. There are eleven provincial administrative regions in the YREC. For simplicity, the term provincial administrative region is shortened as province in the following analysis. Taking up 40% of China’s population and economy, the YREC accounted for 50% of the China’s total carbon emissions. The carbon reduction of the YREC directly affects the fulfilment of the national target of carbon reduction. Hence, the YREC must urgently promote low-carbon economic development.
To propel low-carbon economy, policymakers in China have reiterated the importance of regional financial factors to the low-carbon transformation of economic development. This requires the deep integration between financial development and corporate technical innovation. Therefore, this paper aims to improve low-carbon economic gain efficiency (LCEGE) through financial development.
Unlike traditional efficiency metrics of the economy, LCEGE measures the economic efficiency of a country or region in the light of resource input and environmental cost. This concept bears resemblances with green total factor productivity (TFP) [2], sustainable TFP [3], and energy environmental efficiency [4]. In essence, LCEGE characterizes the transition from resource-intensive economic gain to sustainable economic gain [5], or how green economic activities promote benefits in economy and environment, as well as sustainability [6].
In recent years, a growing academic attention has been attracted to the influence of financial development on regional low-carbon economic transformation. For instance, Owen et al. [7] explored the green innovation financial policies that promote low-carbon economic gain, revealing that low-carbon innovation, especially the green finance escalator, is stimulated by public finance in the early phase. Campiglio [8] analyzed the role of banks and monetary policy in financing low-carbon economic transition, and suggested promoting green investment through prudential macro financial supervision. Polzin and Sanders [9] explored how to finance Europe’s transition to low-carbon energy model, and concluded that the investors and lenders of banks and other institutions are reluctant to invest in renewable energy or grid infrastructure, owing to the discontinuity of expectations (policies). From finance and justice in the low-carbon energy transition, Hall et al. [10] compared the operating modes of alternative finance in the energy investment patterns of two developed economies, and learned that alternative finance is often opposed to commercial capital.
This paper mainly makes two contributions: First, the previous evaluation metric systems (EMSs) for low-carbon economic transition often ignores the important factor of carbon sink; this paper innovatively include carbon sink, measured by provincial newly-added afforestation area, into the EMS for LCEGE. Second, most studies only qualify the influence of financial development on low-carbon economic transition, failing to quantify the exact impact, and measures financial development with a single metric; this paper decomposes the variable of financial development into multiple dimensions, and overcomes the defects of single-metric evaluation.
2.1 Directional distance function (DDF) model
This paper measures LCEGE through data envelopment analysis (DEA). Since LCEGE incorporate resources and environment into the measurement of economic gain efficiency, the evaluation of LCEGE must deal with environmental pollutants as undesired outputs. If the undesired outputs are neglected, the actual rate of economic gain will be distorted, which will mislead the decision-makers [11, 12].
Early on, Charnes et al. [13] and Banker et al. [14] proposed two models to solve multi-input and multi-output problems. Nonetheless, these models cannot effectively handle problems with environmental pollutants as undesired outputs. This is because environmental pollutants do not satisfy the maximum output hypothesis in traditional DEA models for efficiency measurements.
Some scholars treated environmental pollutants as input variables [15]. But this treatment goes against the actual production process [16], and causes bias in the evaluation results. The problem of undesired outputs was not solved until Chambers et al. [17] developed the DDF. Compared with early models, the DDF model regards various environmental pollutants as undesired outputs in efficiency evaluation, making the evaluation much more accurate.
Through linear programming, the DDF model constructs a non-parametric piecewise surface on the original data to calculate the efficiency relative to the surface. The principle of the model is summarized below:
For a given production system of n decision making units (DMUs), each DMU is assumed to product d units desired outputs and u units of undesired outputs out of m production factors [18]. For convenience, the inputs, desired outputs, and undesired outputs are denoted as $X=\left(x_{1}, x_{2} \ldots, x_{n}\right) \in R_{+}^{m \times n}$ $Y=\left(y_{1}, y_{2} \ldots, y_{n}\right) \in R_{+}^{d \times n},$ and $b=\left(b_{1}, b_{2} \ldots, b_{n}\right) \in R_{+}^{u \times n}$ respectively. In addition, the set of all DMUs in the production system is denoted as $D M U_{0}=\left(x_{0}, y_{0}^{g}, y_{0}^{b}\right),$ and the set of possible outputs of the entire production system as $P^{t}(x)=$ $\{(x, y): x$ can produce $y\} .$ Then, the DDF model can be defined as:
$\begin{align} & {{\overrightarrow{D}}_{0}}(x,y,b;-{{g}_{x}},{{g}_{y}},-{{g}_{b}})=\underset{\theta }{\mathop{\sup }}\,\{\theta :(x-{{g}_{x}},y+{{g}_{y}},b-{{g}_{b}})\in (x,y,b)\} \\ \end{align}$ (1)
As shown in formula (1), the entire model is composed of inputs (X), desired outputs (Y), and undesired outputs (b). There are two key features of the model: the desired outputs (Y) and undesired outputs (b) always appear at the same time, i.e., any economic activity is bound to have desired outputs like GDP and undesired outputs like environmental pollutants; the desired outputs (Y) change in the same direction as the undesired outputs (b), i.e., the increase of any undesired output(s) Y will push up undesired output(s) b. Based on these features, linear programming was performed on the entire model [18]. Then, the DDF of DMU k at time t can be expressed as:
$\begin{align} & \overrightarrow{D}_{0}^{t}({{x}^{tk}},{{y}^{tk}},{{b}^{tk}};-g_{x}^{tk},g_{y}^{tk},-g{{_{b}^{tk}}_{b}})=\max \theta \\ & s.t.\sum\limits_{j=1}^{n}{{{\lambda }_{j}}}y_{rj}^{t}\ge (1\text{+}\theta )y_{rj}^{t},r=1,2,\cdot \cdot \cdot ,d \\ & \sum\limits_{j=1}^{n}{{{\lambda }_{j}}}b_{lj}^{t}=(1-\theta )b_{rj}^{t},l=1,2,\cdot \cdot \cdot ,u \\ & \sum\limits_{j=1}^{n}{{{\lambda }_{j}}}x_{ij}^{t}\le (1-\theta )x_{rj}^{t},i=1,2,\cdot \cdot \cdot ,m \\ & {{\lambda }_{j}}\ge 0,j=1,2,\cdot \cdot \cdot ,n \\ \end{align}$ (2)
where, $x^{t k}, y^{t k}, b^{t k},-g_{x}^{t k}, g_{y}^{t k},$ and $-g_{b}^{t k}$ are the input $(\mathrm{s})$, desired output(s), undesired output(s), decrement of input(s), increment of desired output, and decrement of undesired output(s), respectively; θ is the invalid part of inputs and outputs. If θ is large, then a good portion of inputs and outputs is invalid, and the DMU has a low efficiency; if θ is small, then the DMU has a high efficiency; if θ is zero, then all inputs and outputs are valid, and the DMU has an efficiency of 1.
2.2 Tobit model
Our research aims to disclose the influence of financial development on LCEGE. It is important to choose the right model to test that influence. As the dependent variable, the value of LCGEG falls in (0, 1). In this case, the value of the dependent variable is censored. The common estimation method of ordinary least squares (OLS) will have bias in parameter estimation.
To solve the problem of censored dependent variable, Tobin [19] designed the Tobit model based on the principle of maximum likelihood estimation. In recent years, the model has been increasingly applied to analyze discrete dependent variables, especially the evaluation results of DEA [20]. Hence, this paper chooses the Tobit model to examine how financial development affects LCEGE:
$Y_{it}^{*}=\alpha +{{\beta }_{i}}{{X}_{it}}\text{+}{{\varepsilon }_{it}}$
$\left\{ _{{{Y}_{it}}={{1}_{{}}}(ifY_{it}^{*}\ge 1)}^{{{Y}_{it}}=Y{{_{it}^{*}}_{{}}}(ifY_{it}^{*}<1)} \right. $ (3)
where, $Y_{i t}$ is the observable variable; $Y_{i t}^{*}$ is the latent variable, i.e. LCEGE; $X_{i t}$ is the set of dependent variables, including financial development and a series of control variables; $\beta_{i}$ is the coefficient of the independent variable, reflecting how much the LCEGE is affected by each dependent variable; $\varepsilon_{i t}$ is a random disturbance term.
3.1 Variable setting
3.1.1 Input and output variables
Inspired by the results of Hu et al. [21], this paper evaluates the LCEGE, a.k.a. the TFP of low-carbon economy, with a metric system containing manpower, capital stock, energy consumption, afforestation area, GDP, and CO2. Different from the previous TFP EMSs, our EMS includes afforestation area to reflect the significance of carbon sink to low-carbon economic transition. In the EMS, the input metrics include manpower, capital stock, energy consumption, and afforestation area, the desired output is GDP, and the undesired output is CO2. Each metric in the EMS is explained in Table 1.
Table 1. The explanation of each metric in LCEGE EMS
|
Metric |
|
Meaning |
Unit |
|
Inputs |
Manpower |
The provincial year-end number of employees |
10,000 people |
|
Capital stock |
The provincial actual comparable capital stock with 2000 as the base period |
100 million yuan |
|
|
Afforestation area |
The provincial annual newly-added afforestation area |
1,000 hectares |
|
|
Energy |
The provincial energy consumption |
10,000 TCE |
|
|
Outputs |
Desired output |
The provincial true GDP with 2000 as the base period |
100 million yuan |
|
Undesired output |
The provincial carbon emission |
10,000 tons |
(1) Manpower
Manpower is an essential element for economic gain, and the source of economic value. Drawing on the literature, this paper characterizes manpower as provincial year-end number of employees during the target period.
(2) Capital stock
The capital input was characterized by the provincial real capital stock during the target period. Since the data on capital stock are not provided in relevant statistical yearbooks, this paper estimates the provincial capital stock using the permanent inventory method (PIM) [18]:
$K_{i, t}=I_{i, t}+(1-\delta) K_{i, t-1}$,
where, $K_{i, t}$ and $l_{i, t}$ are the nominal capital stock and fixed capital formation of province $i$ in year $t,$ respectively; $\delta=10.96 \%$ is the depreciation rate.
To remove the price effect, the nominal capital stock was converted into the real capital stock with 2000 as the base period, using the price index of investment in fixed assets [22].
(3) Afforestation area
Afforestation area was measured by the provincial annual newly-added afforestation area during the target period. Afforestation refers to the total area of forests, woods, and shrubs formed through artificial cultivation or planting. The newly-added afforestation area represents the carbon sink element in the LCEGE EMS.
(4) Energy
Energy was measured by the provincial energy consumption during the target period, such as coal, diesel, and natural gas.
(5) GDP
GDP is the desired output in the LCEGE EMS. However, the relevant statistical yearbooks only mention the nominal GDP. This metric is easily distorted by the inflation under the price effect. Therefore, the provincial nominal GDP was deflated into comparable true GDP with 2000 as the base period and the GDP index.
(6) CO2
CO2 is the undesired output in LCEGE EMS. Whereas the statistical bureaus in China have not published any data on carbon emissions, and fossil energy consumption contributes more than 90% of China’s carbon emissions, the provincial CO2 was estimated by the strategy specified in IPCC 2006 Guidelines for National Greenhouse Gas Inventories:
$C{{O}_{2}}=\sum\limits_{i=1}^{14}{{{E}_{i}}}\times NC{{V}_{i}}\times CE{{F}_{i}}$ (4)
where, CO2 is the estimated provincial carbon emissions; NCV is the net caloric value of each fossil energy; CEF is the carbon emission factor of each fossil energy; i is the serial number of 14 fossil energies.
3.1.2 Other variables
Financial development is the core independent variable, because the research purpose is to disclose its influence on LCEGE. To measure this variable accurately and comprehensively, this paper further decomposes financial development into financial scale and financial structure. In addition, several factors were included as control variables, including industrial structure, technical innovation, foreign direct investment, energy structure, and environmental regulation. All these variables are explained in Table 2.
(1) Financial scale
In general, the larger the financial scale, the more perfect the financial market. Thus, the expansion of financial scale helps to reduce the borrowing cost of enterprises, and facilitate the financing of green enterprises. Moreover, as the financial market gradually improves, the government can roll out financial policies, encouraging financial institutions to lend money to green projects. Frankel et al. pointed out that financial development promotes the economy and reduces pollutant emissions [23, 24]. Therefore, financial scale was expected to promote LCEGE.
(2) Financial structure
Like financial scale, financial structure also mirrors the quality of financial development. As stated by McKinnon, financial structure often reflects the proportional relationship between informal finance and formal finance. Based on the intensity of government regulation, formal finance mainly includes domestic loans, budgetary funds, and foreign capital, while informal finance basically consists of self-raised funds and other funds. Owing to the different intensities of government regulation, formal and informal finances differ greatly in the capital flow to green enterprises or projects. Hence, the ratio of informal finance to formal finance exerts a major impact on low-carbon economic gain. Here, the provincial scale of formal finance is calculated as the sum of domestic loans, budgetary funds, and foreign capital, among the sources of investment in fixed assets, while the provincial scale of informal finance is calculated as the sum of raised funds and other funds. Then, the two scales were compared to obtain the financial structure.
(3) Industrial structure
The industrial structure reflects the proportional relationship between different industries. In China, the secondary industry utilizes more energy and outputs higher pollutant emissions than primary and secondary industries [25]. What is worse, the secondary industry utilizes energy in an inefficient manner, and wastes a lot of energy. Hailed as the world’s factory, China boasts a gigantic secondary industry, which dominates the national economy. The dominance of secondary industry in industrial structure was expected to suppress LCEGE.
(4) Technological innovation
Studies have shown that technical innovation is a key promoter of production mode transformation and ECER of enterprises [26]. Through technical innovation, enterprises can renew and update production processes, improve the efficiency of production and operation, and make more efficient use of energy. This will obviously reduce the emissions of pollutants like CO2. Thus, technical innovation was expected to improve LCEGE.
(5) Foreign direct investment
One of the key tasks of reform and opening-up is to attract foreign investment. The foreign direct investment brings advanced management knowledge and low-carbon technology to China, which improves the production efficiency of local enterprises and benefits the ECER. Furthermore, the high environmental standards of foreign enterprises set an example for domestic enterprises, encouraging the latter to improve their own standards. Thus, foreign direct investment is expected to promote LCEGE [27].
(6) Energy consumption structure
The carbon emission factor varies with energies. Wind energy, solar energy, bioenergy, and natural gas are non-carbon or low-carbon energy sources. These energies are called clean energy, because the consumption of such energies release virtually no CO2. By contrast, coal is a typical carbon-intensive energy with a high carbon emission factor, that is, coal consumption releases lots of CO2. China is a major producer and consumer of coal. More than 70% of all energy consumed in China is coal. Referring to Ren et al., the provincial energy structure was measured with the percentage of coal consumption in total energy consumption [28].
(7) Environmental regulation
Environmental regulation is an important means to limit the discharge of various environmental pollutants by enterprises. Nevertheless, the intensity of environmental regulation differs from place to place. Therefore, environmental regulation has two different impacts on provincial ECER. If a province imposes strict environmental regulation, the local enterprises need to pay a high green cost. Then, the enterprises are forced to choose clean production technology, thereby reducing carbon emissions [29]. If a province implements relaxed environmental regulation (e.g., fails to impose strict enough administrative penalty, and pollution charge), the enterprises would rather pay green cost than realize clean production, giving rise to the green paradox.
Table 2. The explanation of other variables
|
Name |
Meaning |
Unit |
Expected sign |
|
Financial scale |
The sum of deposit and loan balances in financial institutions/provincial GDP |
% |
+ |
|
Financial structure |
The ratio between the scale of informal finance and the scale of formal finance, among the sources of investment in provincial fixed assets |
% |
-/+ |
|
Industrial structure |
The output of the secondary industry / GDP |
% |
- |
|
Technical progress |
Ln (number of patens grants to each province) |
% |
+ |
|
Foreign direct investment |
Ln (actual foreign direct investment) |
10,000USD |
+ |
|
Energy consumption structure |
The provincial coal consumption / provincial total energy consumption |
% |
- |
|
Environmental regulation |
The investment in industrial pollution control / total industrial output |
% |
-/+ |
3.2 Data sources
For data availability and completeness on every variable in the DDF model and the Tobit model, the panel data of 11 provinces in YREC in 2000-2017 were taken as the samples. The data on the deposit and loan balances in financial institutions, scale of informal finance and the scale of formal finance among the sources of investment in fixed assets, year-end number of employees, GDP, GDP index, output of secondary industry, coal consumption, energy consumption, newly-added afforestation area, fixed capital formation, CO2, foreign direct investment, number of patents granted, investment in industrial pollution control, and total industrial output were collected from China Statistical Yearbooks, China Energy Statistical Yearbooks, Almanac of China’s Finance and Banking, China Statistical Yearbooks on Science and Technology, China Industry Statistical Yearbooks, the official website of the National Bureau of Statistics of China, as well as local statistical yearbooks. The few missing data were completed by moving average method.
4.1 YREC LCEGE
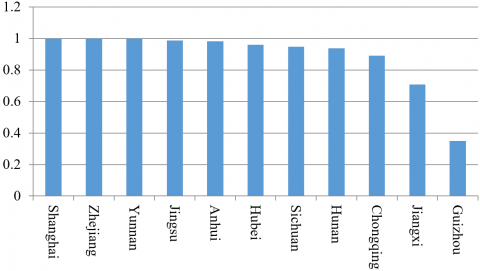
According to the LCEGE EMS, this paper measures the LCEGEs of the 11 provinces in YREC based on the panel data on the input and output metrics. For convenience, the mean provincial LCEGE is displayed in Figure 1.
As shown in Figure 1, the provinces in YREC had certain differences in LCEGE. Specifically, Shanghai, Zhejiang, and Yunnan achieved the optimal mean LCEGE of 1. Among them, Shanghai and Zhejiang belong to the lower part, while Yunnan belongs to the upper part of the YREC. The mean LCEGEs of Jiangsu, Anhui, Hubei, Sichuan, and Hunan fell between 0.9 and 1. The results are rather satisfactory, but leave a room for improvement. The mean LCEGEs of Chongqing and Jiangxi were 0.8914 and 0.7074, respectively. Despite falling in the medium to top range, the LCEGEs of the two provinces should be further improved. The mean LCEGE of Guizhou (0.3496) was far from satisfactory, calling for great improvement in future.
Figure 1. The mean LCEGEs of the provinces in YREC
Overall, most provinces in YREC achieved satisfactory LCEGEs, possibly due to China’s efforts to build a green and low-carbon circular economic system. Nonetheless, a few provinces performed poorly in LCEGE, due to the weakness in resource endowments and regional differences. These provinces should be the focus of future policies on green development.
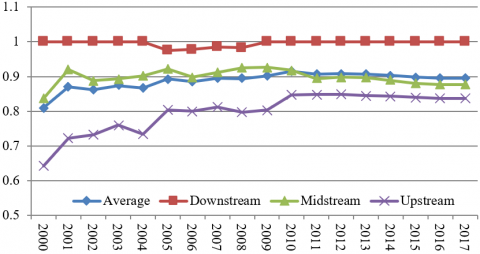
Figure 2 shows the LCEGE trends in the YREC and its lower part, middle part, and upper part. It can be seen that the LCEGE in the lower part changed little in the target period, except for a slight decline in a few years. In the middle part, the LCEGE slowly increased before 2005, and remained constant after that. In the upper part, the LCEGE surged up before 2010, and did not change much after that.
Figure 2. The LCEGE trends in the YREC and its lower part, middle part, and upper part
There are obvious differences in the mean LCEGE between the lower part, middle part, and upper part. The mean LCEGE in the lower part was as high as 0.9955, which is close to the efficient frontier, and far above the average level of the YREC (0.8876). The mean LCEGE in the middle part (0.8972) was close to the average level of the YREC. The mean LCEGE in the upper part (0.7971) was far below the average level of the YREC. To sum up, the three parts of the YREC can be ranked as lower part, middle part, and upper part by LCEGE.
The theory on environmental Kuznets curve (EKC) holds that, in the early stage of economic development, the degree of environmental pollution increases with the per-capita GDP; when the economic gain arrives at a threshold, the degree of environmental pollution will decline the growth of per-capita GDP. This principle is demonstrated well in Figure 2: the economically developed lower part had much higher LCEGE than the underdeveloped middle part and upper part.
4.2 Results of Tobit model
The Tobit model (3) on how financial development influences YREC LCEGE was regressed on Stata 12. The results are displayed in Table 3.
Table 3. The results of the Tobit model
|
Variable |
Coefficient |
T-statistic |
P-value |
|
Financial scale |
0.1104** |
2.36 |
0.019 |
|
Financial structure |
-0.0564*** |
-3.42 |
0.001 |
|
Industrial structure |
-0.6722 |
-1.09 |
0.278 |
|
Technological innovation |
-0.0791*** |
-3.70 |
0.000 |
|
Foreign direct investment |
0.2154*** |
6.12 |
0.000 |
|
Energy consumption structure |
-0.4129** |
-2.46 |
0.015 |
|
Environmental regulation |
-3.6963 |
-0.33 |
0.745 |
|
Log likelihood |
-56.6410 |
||
Note: *, **, and *** are significance levels of 10%, 5%, and 1%, respectively.
Financial scale had a significant positive impact on LCEGE at the 5% level, suggesting that the expansion of financial scale promotes low-carbon economic efficiency. This is in line with our hypothesis. The importance of financial factors in low-carbon economic transition, which is reiterated by the Chinese government, is gradually emerging. Sohag et al. [30] empirically manifested that financial development helps to cut down carbon emissions by motivating the green financial innovations that have carbon reduction effect. Not only that, a good financial system could interest international investors and stimulate the growth of regional economy, thereby affecting environmental quality [31]. Of course, China’s recent efforts to promote carbon finance also provide sufficient financial support to regional low-carbon economy. For example, the government guides commercial banks to issue loans to green projects, elevate direct financing to low-carbon economy, and speed up the construction of carbon trading markets. It is safe to say that the construction and improvement of the carbon financial system is of great necessity to promote the low-carbon economy in the YREC.
The estimated coefficient of financial structure was negative, passing the 1% significance test. Thus, a large ratio of informal finance to formal finance among the investment in fixed assets hinders the low-carbon economic efficiency. A possible reason is that informal finance is not regulated as strictly as formal finance. The government fails to control the use of informal finance. Moreover, informal finance favors economic projects with quick returns, high pollution, and high benefits, and rarely considers green projects with slow returns and low benefits. To pursue short-term economic benefits, informal finance tends to invest heavily in small and medium enterprises (SMEs) with high energy consumption and high pollution. After receiving the investment, the SMEs expand production scale, and emit much more CO2. This clearly bottlenecks the regional economic development.
As for the control variables of LCEGE, industrial structure had an insignificant negative impact on LCEGE. Despite being the largest energy consumer and pollutant emitter, the secondary industry has witnessed a decline in energy intensity and carbon emissions, thanks to the optimization and upgrading of internal structure, and the promotes industrial green transformation promoted by the government.
Technological innovation had a negative impact on LCEGE at the significant level of 5%, which contradicts our expectation. Acemoglu et al. [32] demonstrated that the research and development (R&D) of enterprises emphasize both clean and pollution technologies. If an enterprise initially engages in the R&D of pollution technologies, then the R&D will bring more pollution. There are many heavy chemical enterprises in the YREC. The R&D of these enterprises emphasize profitable pollution technologies over clean technologies.
Foreign direct investment is significant positively correlated with LCEGE, which validates our expectation. Statistics show that the YREC only attracted 14.306 billion USD of foreign direct investment in 2000. This number surged up to 132.946 billion USD in 2017. The continuous introduction of foreign direct investment positively affects the ECER [33].
Energy consumption structure greatly inhibited LCEGE. In 2017, coal took up 54% of the energy consumption in the YREC, indicating that the dominance of coal has not ended. This is clearly not conducive to the development of low-carbon economy.
Environmental regulation had an insignificant negative effect on LCEGE. The environmental regulation in the YREC is far from sufficient. In most provinces, the investment in industrial pollution control takes up less than 1% of total industrial output. Suffice it to say that the green paradox dominates the influence of environmental regulation on low-carbon economic development.
Unlike the traditional TFP EMSs, this paper includes carbon sink, which is measured by afforestation area, into the LCEGE EMS. On this basis, the LCEGEs of the 11 provinces in YREC were measured by the DDF model in 2000-2017. Next, the Tobit model was adopted for empirical analysis on the influence of financial development on LCEGE. Through the analysis, the authors drew the following conclusions
(1) The provinces in YREC had certain differences in LCEGE. Specifically, Shanghai, Zhejiang, and Yunnan optimized the mean LCEGE. The mean LCEGEs of Jiangsu, Anhui, Hubei, Sichuan, and Hunan are rather satisfactory, but leave a room for improvement. The mean LCEGEs of Chongqing and Jiangxi fell in the medium to top range, and should be further improved. The mean LCEGE of Guizhou was far from satisfactory, calling for great improvement in future.
(2) The LCEGE trends in the lower part, middle part, and upper part of the YREC were different. The LCEGE in the lower part changed little in the target period, while that in the middle part and upper part varied in two phases. Besides, there are obvious differences in the mean LCEGE between the lower part, middle part, and upper part. In the target period, the three parts of the YREC can be ranked as lower part, middle part, and upper part by LCEGE.
(3) The empirical results of Tobit model show that financial scale exerts a significant positive impact on LCEGE, while financial structure exerts a significant negative impact on LCEGE. As for the control variables, foreign direct investment exerts a significant positive correlation with LCEGE; technical innovation, and energy structure exerts a significant negative correlation with LCEGE; industrial structure and environmental regulation have an insignificant influence on LCEGE.
[1] Lin, B., Zhu, J. (2017). Energy and carbon intensity in China during the urbanization and industrialization process: A panel VAR approach. Journal of Cleaner Production, 168: 780-790. https://doi.org/10.1016/j.jclepro.2017.09.013
[2] Lin, B., Chen, Z. (2018). Does factor market distortion inhibit the green total factor productivity in China? Journal of Cleaner Production, 197: 25-33. https://doi.org/10.1016/j.jclepro.2018.06.094
[3] Yue, S., Shen, Y., Yuan, J. (2019). Sustainable total factor productivity growth for 55 states: An application of the new Malmquist index considering ecological footprint and human development index. Resources, Conservation and Recycling, 146: 475-483. https://doi.org/10.1016/j.resconrec.2019.03.035
[4] Mavi, N.K., Mavi, R.K. (2019). Energy and environmental efficiency of OECD countries in the context of the circular economy: Common weight analysis for Malmquist productivity index. Journal of Environmental Management, 247: 651-661. https://doi.org/10.1016/j.jenvman.2019.06.069
[5] Chen, W., Chen, J., Xu, D., Liu, J., Niu, N. (2017). Assessment of the practices and contributions of China's green industry to the socio-economic development. Journal of cleaner production, 153: 648-656. https://doi.org/10.1016/j.jclepro.2016.11.065
[6] Sengupta, P., Choudhury, B.K., Agrawal, K.M. (2019). Low carbon economy for sustainable development. Encyclopedia of Renewable and Sustainable Materials, 3: 551-560. https://doi.org/10.1016/B978-0-12-803581-8.11217-2
[7] Owen, R., Brennan, G., Lyon, F. (2018). Enabling investment for the transition to a low carbon economy: government policy to finance early stage green innovation. Current Opinion in Environmental Sustainability, 31: 137-145. https://doi.org/10.1016/j.cosust.2018.03.004
[8] Campiglio, E. (2016). Beyond carbon pricing: The role of banking and monetary policy in financing the transition to a low-carbon economy. Ecological Economics, 121: 220-230. https://doi.org/10.1016/j.ecolecon.2015.03.020
[9] Polzin, F., Sanders, M. (2020). How to finance the transition to low-carbon energy in Europe? Energy Policy, 147: 111863. https://doi.org/10.1016/j.enpol.2020.111863
[10] Hall, S., Roelich, K.E., Davis, M.E., Holstenkamp, L. (2018). Finance and justice in low-carbon energy transitions. Applied Energy, 222: 772-780. https://doi.org/10.1016/j.apenergy.2018.04.007
[11] Li, K., Lin, B. (2015). Measuring green productivity growth of Chinese industrial sectors during 1998–2011. China Economic Review, 36: 279-295. https://doi.org/10.1016/j.chieco.2015.09.008
[12] Liu, W., Zhan, J., Wang, C., Li, S., Zhang, F. (2018). Environmentally sensitive productivity growth of industrial sectors in the Pearl River Delta. Resources, Conservation and Recycling, 139: 50-63. https://doi.org/10.1016/j.resconrec.2018.07.017
[13] Charnes, A., Cooper, W.W., Rhodes, E. (1978). Measuring the efficiency of decision making units. European Journal of Operational Research, 2(6): 429-444.
[14] Banker, R.D., Charnes, A., Cooper, W.W. (1984). Some models for estimating technical and scale inefficiencies in data envelopment analysis. Management Science, 30(9): 1078-1092. https://doi.org/10.1287/mnsc.30.9.1078
[15] Ramanathan, R. (2005). An analysis of energy consumption and carbon dioxide emissions in countries of the Middle East and North Africa. Energy, 30(15): 2831-2842. https://doi.org/10.1016/j.energy.2005.01.010
[16] Seiford, L.M., Zhu, J. (2002). Modeling undesirable factors in efficiency evaluation. European Journal of Operational Research, 142(1): 16-20. https://doi.org/10.1016/S0377-2217(01)00293-4
[17] Chambers, R.G., Chung, Y., Färe, R. (1996). Benefit and distance functions. Journal of Economic Theory, 70(2): 407-419. https://doi.org/10.1006/jeth.1996.0096
[18] Wang, Q.Y., Zhao, C.Y. (2020). Dynamic evolution and influencing factors of industrial green total factor energy efficiency in China, Alexandria Engineering Journal, in press. https://doi.org/10.1016/j.aej.2020.11.040
[19] Tobin, J. (1958). Estimation of relationships for limited dependent variables. Econometrica: journal of the Econometric Society, 26(1): 24-36. https://doi.org/10.2307/1907382
[20] Feng, C., Wang, M. (2017). Analysis of energy efficiency and energy savings potential in China’s provincial industrial sectors. Journal of Cleaner Production, 164: 1531-1541. https://doi.org/10.1016/j.jclepro.2017.07.081
[21] Hu, J.L., Wang, S.C., Yeh, F.Y. (2006). Total-factor water efficiency of regions in China. Resources Policy, 31(4): 217-230. https://doi.org/10.1016/j.resourpol.2007.02.001
[22] Zhu, Z., Zheng, Y.F. (2020). Green total factor energy efficiency in China and its influencing factors. International Journal of Sustainable Development and Planning, 15(5): 781-787. https://doi.org/10.18280/ijsdp.150521
[23] Frankel, J.A., Romer, D.H. (1999). Does trade cause growth? American Economic Review, 89(3): 379-399. https://doi.org/10.1257/aer.89.3.379
[24] Frankel, J., Rose, A. (2002). An estimate of the effect of common currencies on trade and income. The Quarterly Journal of Economics, 117(2): 437-466. https://doi.org/10.1162/003355302753650292
[25] Wei, C., Ni, J., Shen, M. (2009). Empirical analysis of provincial energy efficiency in China. China & World Economy, 17(5): 88-103. https://doi.org/10.1111/j.1749-124X.2009.01168.x
[26] Ma, C., Stern, D.I. (2008). China's changing energy intensity trend: a decomposition analysis. Energy Economics, 30(3): 1037-1053. https://doi.org/10.1016/j.eneco.2007.05.005
[27] Frankel, J.A. (2003). The environment and globalization (No. w10090). National bureau of economic research. Nber Working Paper, 5(2): 161-210. https://doi.org/10.3386/w10090
[28] Ren, S., Fu, X., Chen, X. (2012). Regional variation of energy-related industrial CO2 emissions mitigation in China. China Economic Review, 23(4): 1134-1145. https://doi.org/10.1016/j.chieco.2012.08.003
[29] Kathuria, V. (2007). Informal regulation of pollution in a developing country: Evidence from India. Ecological Economics, 63(2-3): 403-417. https://doi.org/10.1016/j.ecolecon.2006.11.013
[30] Sohag, K., Al Mamun, M., Uddin, G.S., Ahmed, A.M. (2017). Sectoral output, energy use, and CO2 emission in middle-income countries. Environmental Science and Pollution Research, 24(10): 9754-9764. https://doi.org/10.1007/s11356-017-8599-z
[31] Park, Y., Meng, F., Baloch, M.A. (2018). The effect of ICT, financial development, growth, and trade openness on CO 2 emissions: an empirical analysis. Environmental Science and Pollution Research, 25(30): 30708-30719. https://doi.org/10.1007/s11356-018-3108-6
[32] Acemoglu, D., Aghion, P., Bursztyn, L., Hemous, D. (2012). The environment and directed technical change. American Economic Review, 102(1): 131-66. https://doi.org/10.1257/aer.102.1.131
[33] Sinton, J.E., Fridley, D.G. (2000). What goes up: recent trends in China's energy consumption. Energy Policy, 28(10): 671-687. https://doi.org/10.1016/S0301-4215(00)00053-7