Farhadur Reza* | Shoichi Kojima
© 2020 IIETA. This article is published by IIETA and is licensed under the CC BY 4.0 license (http://creativecommons.org/licenses/by/4.0/).
OPEN ACCESS
Thermal comfort in the classroom is critical since it influences the learning process, performance, and health of students. This paper attempts to propose design considerations evaluating the thermal comfort condition in tropical studio type classroom. Predicted Mean Vote (PMV) and Standard Effective Temperature (SET) have been calculated using weather data such as air temperature, relative humidity, globe temperature, and air velocity recorded during field measurement in typical summer days along with clothing insulation and metabolic rate. The effects of environmental parameters in comfort indices calculation have been observed. PMV and SET results indicate that the thermal condition of the classroom is away from the standard comfort zone. Increased air velocity can be useful in accomplishing thermal comfort is identified. Furthermore, the selection of appropriate design considerations based on findings has been recommended to attain a desirable classroom environment.
thermal comfort, thermal environment, Predicted Mean Vote (PMV), Standard Effective Temperature (SET), studio type classroom
Thermal comfort is one of the vital environmental factors for building occupants to work productively and live well [1, 2]. A comfortable thermal environment makes people healthy both physically and psychologically. An environment that makes occupants feel too cold or too hot could cause a decrease in work efficiency [3, 4]. Educational buildings are primarily designed to provide a sensible environment to promote teaching and learning [5, 6]. Activities related to teaching and learning are affected directly by the thermal environment [3]. The unsatisfactory thermal environment in the classroom can result in undesirable conditions for both teachers and students. Thermal discomfort can negatively affect the students’ learning capacity, performance, and health. Hence this is always critical to provide comfort conditions in the classroom [7].
Several studies have been conducted on thermal comfort in different types of classrooms around the globe. Wong and Khoo [8] conducted a study in mechanically ventilated classrooms in Singapore to assess thermal comfort. The objective measurement showed that none of the classrooms had thermal conditions falling within the comfort zone of ASHRAE standard 55. The study found that the acceptable temperature lies between 27.1 to 29.3℃ and 28.8℃ as neutral temperature. Ismail et al. [9] carried out their study in a computer laboratory and found PMV values exceeding the comfort level initially. However, a comfortable thermal environment was attained by operating the air conditioner consistently. A small-scale study was conducted by Pellegrino, Simonetti, and Fournier [10] in two university classrooms ventilated by fans in Kolkata, India. Calculated PMV values indicated the thermal conditions of the classrooms are away from the comfort zone. Kamaruzzaman and Tazilan [11] assessed the thermal comfort of a school classroom in Malaysia. Field measurement data showed that most classrooms do not provide a thermal comfort environment and satisfaction for teachers and students. PMV values were far beyond of comfort range. This study determined 26.5℃ as the maximum acceptable temperature. Mishra and Ramgopal [12] conducted a thermal comfort study in undergraduate laboratories in India. They estimated the maximum PMV value of 3.06 and found a comfort range of 20-31℃. Rajkumar, Amirtham, and Horrison [13] assessed the thermal comfort of university studio classrooms in Tamil Nadu, India. Objective measurement was carried out to measure air temperature and relative humidity. Air temperature tends to increase as time progresses in the measurement days and it corresponds to relative humidity decreases. Ali et al. [14] evaluated the indoor environmental performance of laboratories in Nigerian university. The PMV values of two laboratories were found 1.43 and 0.79, respectively. However, these values did not comply with actual mean vote results. Hence, they suggest further investigation. Subhashinia and Thirumaran [15] assessed thermal comfort in a naturally ventilated architecture building, India. The estimated PMV value indicated the thermal discomfort of the occupants. They suggested using shading devices for enhancing the thermal comfort. Cheung et al. [16] investigated that the PMV model possessed a better prediction performance in classroom thermal comfort than that of office and house. However, PMV tends to overestimate at both ends of the thermal sensation scale, e.g., Cold and Hot. Along with PMV, another comfort index named as SET proposed by Gagge developed based upon a dynamic two-node model (core node and skin node) of human temperature regulation has also been widely applied in the field of thermal environment mentioned by Ye et al. [17] and Zhang et al. [18]. Rahman and Tuhin [19] evaluated the impact of daylight on the learning environment in a school, Ishwardi, Bangladesh. They focused on assessing visual comfort evolved from the penetration of daylighting with different placement of the window.
Different educational stage and curricula demands different learning approaches and different activities requires a desirable classroom environment [20]. In a studio type classroom student are usually involved with light laboratory activities rather than merely reading, writing and listening. Proper design considerations are hence critical for studio type classroom in tropical country. PMV and SET models are extensively applied in the field of classroom thermal comfort assessment since fundamental factors of thermal comfort are duly addressed in these models [16-18, 21]. This study, therefore, is an endeavor to investigate the thermal comfort employing PMV and SET models of a studio type university classroom.
2.1 Conceptual framework
2.1.1 Thermal comfort
The environmental conditions that affect a person’s heat loss are known as the thermal environment. Thermal comfort means a state of mind that expresses satisfaction with the thermal environment in determining the condition for thermal comfort, six primary factors, e.g., metabolic rate, clothing insulation, air temperature, radiant temperature, air speed, and relative humidity, are strongly recommended to consider [21].
2.1.2 Mean Radiant Temperature (MRT)
The temperature of a uniform, black enclosure that exchanges the same amount of heat by radiation with the occupant as the actual surroundings is called mean radiant temperature. It is a single value for the entire body and accounts for both long-wave mean radiant temperature and short-wave mean radiant temperature [21].
2.1.3 Predicted Mean Vote (PMV)
PMV is an index that predicts the mean value of the thermal sensation votes (self-reported perceptions) of a large group of persons on a sensation scale expressed from -3 to +3 corresponding to the categories “cold,” “cool,” “slightly cool,” “neutral,” “slightly warm,” “warm,” and “hot.”
The PMV model is calculated with the air temperature, mean radiant temperature, along with the applicable metabolic rate, clothing insulation, air speed and humidity. If the resulting PMV value generated by the model is within the recommended range (-0.5 < PMV < +0.5), the conditions are within the comfort zone [21].
2.1.4 Standard Effective Temperature (SET)
SET is the temperature of an imaginary environment at 50% relative humidity (RH), < 0.1 ms-1 average air speed (Va), and mean radiant temperature is equal to average air temperature, in which the total heat loss from the skin of an imaginary occupant with an activity level of 1.0 met and a clothing level of 0.6 clo is the same as that from a person in the actual environment with actual clothing and activity level [21]. SET value ranges between 10 to 14.5℃ indicates “Cold” sensation which is very unacceptable. In contrary, 34.5 to 37.5℃ realm of the SET value means “Hot” in sensation and very unacceptable. The sensation will be “Very Hot” if the value found greater than 37.5℃ and people will feel very uncomfortable. The calculated SET value within the domain of 22.2 to 25.6℃ is specified as “Comfortable” and acceptable by the model [22].
2.2 Device setup
Device setup, objective measurement, PMV and SET calculation have been conducted based on the procedures prescribed by ASHRAE Standard 55-2017.
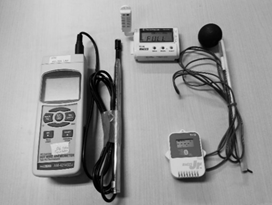
All the devices (Table 1, Figure 1, and Figure 3) were placed in the centre of the classroom at 1.1 m above the floor. Additionally, one set of similar devices was also placed in outside of the building to investigate outdoor microclimatic data.
Table 1. Weather data measurement devices
|
Parameter |
Instruments |
Time Interval |
Range |
Accuracy |
|
Air temperature |
Thermo Recorder TR-72wb |
1 min. |
0 to 55℃ |
±0.5℃ |
|
Relative humidity |
Thermo Recorder TR-72wb |
1 min. |
10 to 95% RH |
±5% RH |
|
Globe temperature |
Thermo Recorder TR-45 |
1 min. |
199 to 1760℃ |
±(0.5℃ + 0.3% of reading) |
|
Air velocity |
Anemometer AM4214SDJ |
1 min. |
0.2 to 5.0 m/s |
± (5% + a) reading |
Figure 1. Measurement devices
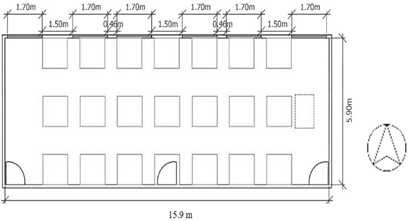
Figure 2. Classroom plan
2.3 Measurement
Field measurement was carried out during typical summer days from June 11 to June 13, 2019. Seven hours of data, from 9:00 to 16:00, were continuously recorded with a 1-minute time interval. To assure the investigation more representative, however, data recorded from 9:30 and 9:15 on June 11 and June 13 respectively have been used in this study. All the windows and doors were open during measurement.
2.4 Calculation
Initially, Mean Radiant Temperature (MRT) was calculated by Engineering Equation Solver (EES). Then, values of MRT along with air temperature, air velocity, relative humidity, metabolic rate, and clothing level were put in CBE Thermal Comfort Tool to determine PMV and SET. Students are usually involved in light laboratory activities, e.g., drawing, preparing 2D or 3D Models rather than heavy lifting or strenuous exertion with a metabolic rate of 1.4 Met. While 0.5 clo value for typical summer clothing ensemble was used in the calculation [23].
2.5 Study Area Profile
This study was carried out in a studio type classroom (locally named as Design Laboratory) (Figure 2) in the Department of Urban and Regional Planning, Jahangirnagar University, Bangladesh. Geographically it lies between 23°52΄ N and 90°16΄ E. The university comprises an area of about 2.8 km2 and is located 32 km north of Dhaka city. Table 2 presents an overview of the studio type classroom.
Table 2. Major specifications of the classroom
|
Dimensions |
15.9 m × 5.9 m × 3.2 m |
Level |
2nd floor |
|
Area |
93.8 m2 |
Orientation of Window |
North |
|
Volume |
300.2 m3 |
Window dimensions |
1.6 m × 1.9 m |
The selected classroom covers an area of 93.8 m2 and located on the second floor of a four-storied academic building. The window to wall ratio (WWR) on the north façade is 60%. However, window to wall ratio (WWR) for the entire classroom is 18%.
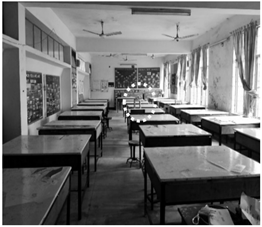
Figure 3. Devices setup inside the classroom
Here climate can be characterized as hot, rainy, humid summers and dry and cool winter possessing total annual rainfall of about 1,800 mm and 86% mean relative humidity. More temperate months range from April to October [24-26].
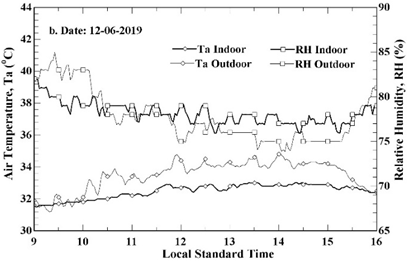
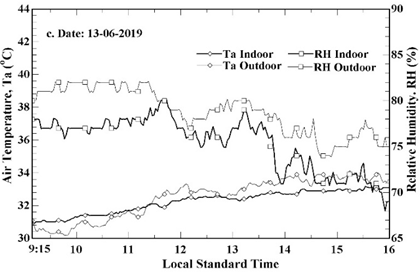
3.1 Indoor and outdoor environmental parameters
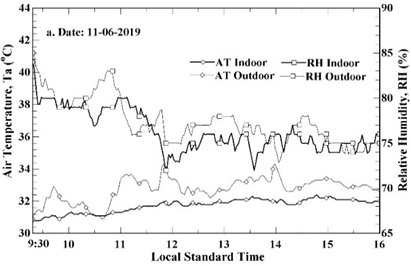
Figure 4. Diurnal distribution of air temperature and relative humidity
Diurnal distribution of indoor and outdoor air temperature and relative humidity in different days are presented in Figure 4. Outdoor air temperature (ATo) found higher than indoor air temperature (ATi) during the measurement periods. A steady increase in ATi is observed while ATo advances with a fluctuation rate. ATi and ATo are found lower in the morning and started to rise from the afternoon. Since solar radiation progresses with time, both ATi and ATo, in general, tend to form an increasing trend. ATi possesses a similar type of trend like ATo during the measurement period except up to 11:30 am on June 13 because of cloudy weather.
The values of relative humidity inside the classroom (RHi) were lower than in outdoor space on June 11 and 13. On June 12, outdoor relative humidity (RHo,) started to fall from 12:00 to 15:00 as outdoor temperature increased and tended to rise from 15:30 as the temperature started to decrease. Both the values of RHi and RHo were higher in the morning and started to decrease as air temperature increased with the progress of time. A decreasing tendency of both RHi and RHo was observed from 12:00 when air temperature also tends to increase.
Measured indoor and outdoor air velocity is presented in Table 3. The outdoor air velocity was higher than the indoor counterpart. The maximum air velocity (1.11 ms-1) was recorded in the classroom on June 13 when ceiling fans were in operation from 11:38 to 11:51 am. Ceiling fans were not operated apart from this period, and air remained still inside the classroom. Door and windows of the classroom were open during the field measurement period. The outdoor air velocity change more frequently than indoor. The maximum fluctuation rate of air velocity was observed on June 13, followed by June 11. On June 13, the maximum outdoor air velocity was measured at 1.29 ms-1, with the highest average of 0.26 ms-1. However, the changing pattern of air velocity found steady on June 12 as compared to other measurement days.
Table 3. Indoor and outdoor air velocity
|
Date |
Indoor Air velocity (ms-1) |
||
|
Maximum |
Minimum |
Average |
|
|
11-06-19 |
0 |
0 |
0 |
|
12-06-19 |
0 |
0 |
0 |
|
13-06-19 |
1.11 |
0 |
0.02 |
|
Date |
Outdoor Air velocity (ms-1) |
||
|
Maximum |
Minimum |
Average |
|
|
11-06-19 |
1.17 |
0 |
0.07 |
|
12-06-19 |
0.93 |
0 |
0.03 |
|
13-06-19 |
1.29 |
0 |
0.26 |
3.2 PMV based thermal comfort assessment
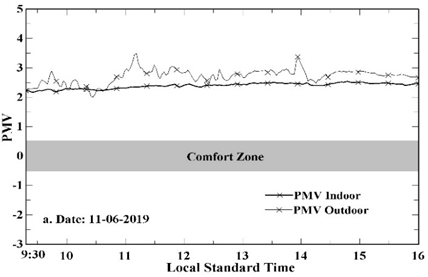
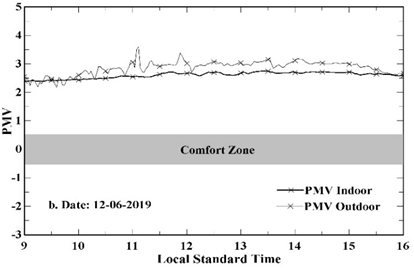
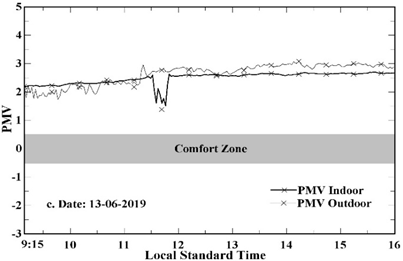
Calculated Predicted Mean vote (PMV) for the Design laboratory is plotted in Figure 5. Outdoor PMV values fluctuated more frequently than that of indoor. A steady increase was observed in indoor PMV as time progresses since the room temperature also tends to increase. Both indoor and outdoor PMV values were far away from the ‘Comfort Zone’ recommended by ASHRAE 55-2017 Standard.
The values of outdoor PMV were higher and even exceeded the maximum margin of sensation scale (+3) in most of the time compared to indoor values. The highest outdoor PMV value was calculated as 3.77 on June 12 followed by 3.73 on June 11 due to higher air temperature and very low air velocity. Lower outdoor PMV values were observed on June 13, 2019, up to 10:30 am. During this period, the outdoor weather was cloudy, and measured air temperature found lower with mentionable air velocity. Thus the minimum PMV value was found as 1.76. Compared to other dates, the higher fluctuation of outdoor PMV values was observed on June 13 due to frequent alteration of air velocity. PMV values inside the classroom were found more than +2 in most of the time. The highest indoor PMV value was determined as 2.75 on June 12 when the air was still and the highest air temperature measured as 33℃. The effect of increased air velocity was observed between 11:38 to 11:51 am, June 13, by operating ceiling fans. Indoor PMV values found closer to ‘Comfort Zone’ during this period with a minimum PMV value of 1.39, which indicates a ‘slightly warm’ sensation. The maximum air velocity was measured during this time as 1.11 ms-1.
Figure 5. PMV Trend in different dates
3.3 SET based thermal comfort assessment
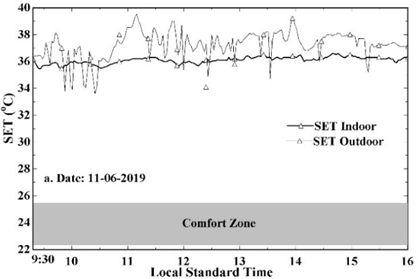
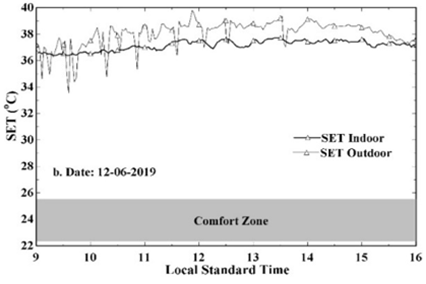
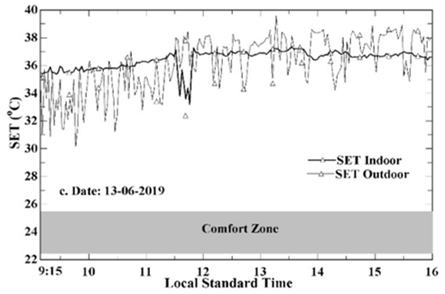
Apart from June 13, outdoor SET values were found higher than that in indoor. Identical to PMV, outdoor SET values also fluctuate more as outdoor environmental parameters changed more frequently. As the time progresses, the SET values inside the classroom approach in a comparatively steady manner (Figure 6).
Figure 6(c) indicates that outdoor SET fluctuates wildly on June 13. Though the outside temperature trend remained comparatively stable, the air velocity frequently fluctuate to a greater extent during that date. For example, between 10:27 and 10:31 on June 13, air velocity was measured as 0.0, 0.90, 0.19, 0.0, and 0.54 ms-1 respectively along with 30.8℃, 30.7℃, 30.7℃, 30.7℃, and 30.7℃ air temperature. The calculated SET values during this period also varied largely in response to change in air velocity. Similar fluctuations in outdoor SET values were also observed on other measurement dates in response to the change in air velocity. Because of higher air temperature and very low air velocity, the maximum outdoor SET value was determined as 40oC on June 12 followed by 39.7℃ on June 11. Outdoor SET values were lower up to 11:30, June 13 with a minimum SET value of 30.3℃ and ‘Warm’ in sensation scale. An outside condition during this period was cloudy, and air temperature; globe temperature found comparatively lower with notable air velocity (1.22 ms-1). SET values inside the classroom were also found comparatively lower up to 11:50 than those of June 11 and 12. The lowest SET value was found as 32.4℃ (‘warm’ sensation) inside the classroom on June 13. Ceiling fans were in operation during this period, and the maximum air velocity was recorded as 1.11 ms-1. The indoor air temperatures and relative humidity were higher on June 12, and the highest SET value was estimated at 37.7℃. This SET value indicates “Very Hot” sensation which is very uncomfortable for the occupants.
Figure 6. SET trend in different dates
3.4 Design Considerations
The Both PMV and SET values indicate that the thermal environment of the classroom is beyond the recommended comfort zone except the operation period of ceiling fans on June 13. Operating the air conditioner can be a means to achieve the most desirable thermal comfort condition inside the classroom. In the context of Bangladesh, however, energy consumption, operation, and maintenance cost, and the effect on indoor air quality are some serious concerns in an operating air conditioner.
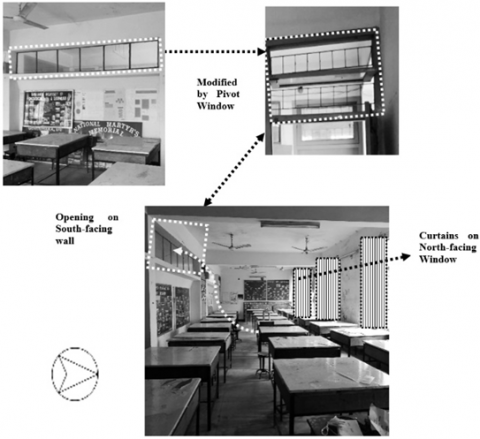
The outdoor air temperatures were found higher than indoor in most of the time other than up to 11:30 on June 13 because of cloudy weather. However, indoor air temperature also tends to increase as the time progress in response to the outdoor air temperature. Usually outdoor and indoor air temperature remain higher between 11:00 and 15:00 and result higher PMV and SET values. Therefore, measures should be taken to avoid the entering of hot outside air into the classroom. The north-facing façade of the classroom has a window area of 19.38m2. A wider sun-shade can be installed on the top of the windows to prevent the direct entering of sunlight into the classroom. Additionally, curtains of white color can be used on the north-facing window sections inside the room during the hot periods (Figure 7).
A significant effect of increased air velocity on thermal comfort indices were observed inside the classroom. On June 13, calculated PMV and SET values found 1.39 and 32.4 respectively which were the closest to the standard comfort zone among the measurement dates. Ceiling fans were operated during this time and air velocity was recorded as 1.11 ms-1. Hence, proper air circulation would be significant concerns in design consideration to improve thermal comfort. This classroom possesses the single-sided ventilation on the north-facing facade. Since there is no window on the south-facing wall, the opening area is limited. However, the opening area on the south-facing wall also can be considered to pass through the hot air from the classroom. The glass frame sections are available on the upper part of the south-facing wall. If these glass frame sections can be modified by installing a ventilation louver or pivot type window (Figure 7), 7m2 more opening area would be added. Such an arrangement of ventilation will increase air circulation as well as rapid heat transfer and thereby enhance the thermal comfort within the classroom.
Figure 7. Design considerations for the classroom
Thermal comfort has been assessed employing PMV and SET models in studio type classroom and its surrounding outdoor space. The PMV and SET values indicate both inside and outside of the classroom are far away from the recommended comfort zone. The usage of air conditioners is a way to achieve a desirable thermal comfort condition. Conversely, energy implication, operation, and maintenance cost, and effect on indoor air quality are some serious matters of concern in this regard.
Calculated PMV and SET values seem to correspond with environmental parameters, air temperature and air velocity in particular. Air temperature inside the classroom incline to increase as the time progresses in response to its outdoor counterpart. Consequently, indoor PMV and SET values tend to increase in accordance with outdoor values. Therefore, wider sun-shed can be put on the top of window section to prevent the direct entry of sunlight into the classroom. Higher PMV and SET values are detected between the periods of 11:00 and 15:00 in response to the higher air temperature. To restrict the transfer of solar radiation and the smooth entry of outside hot air, white color curtains can be used on the window sections especially during the hot periods.
An increase in air velocity can shift the thermal condition closer to the comfort range. By operating ceiling fans air velocity can be increased inside the classroom. Furthermore, opening in the south-facing wall along with the north facade is proposed for the studio type classroom. The provision of double-sided ventilation will augment the air circulation. Hot air can be passed through the south facing opening from the classroom and thereby the heat transfer process will also be stimulated. Thus, articulated approach of limiting the entrance of hot air into the classroom by installing wider sun-shade and using white color curtains, operating ceiling fans, and providing double-sided ventilation (in north facade and south facing wall) is recommended to attain a desirable thermal environment.
This work was funded by the Japanese Government (MEXT) Scholarship (grant type: MEXT PhD Scholarship 2018). Authors would like to acknowledge Japan Government, the Saga University (Japan) and Jahangirnagar University (Bangladesh) for their immense support during the research.
[1] Hamzah, B., Gou, Z.H., Mulyadi, R., Amin, S. (2018). Thermal comfort analyses of secondary school students in the Tropics. Building, 8(4): 56. https://doi.org/10.3390/buildings8040056
[2] Gou, Z., Lau, S.S.Y., Chen, F. (2012). Subjective and objective evaluation of the thermal environment in a three-star green office building in China. Indoor Built Environ, 21(3): 412-422. https://doi.org/10.1177/1420326X11419311
[3] Mendell, M., Heath, G. (2005). Do indoor pollutants and thermal conditions in schools influence student performance? A critical review of the literature. Indoor Air, 15(1): 27-52. https://doi.org/10.1111/j.1600-0668.2004.00320.x
[4] Wargocki, P., Wyon, D.P. (2007). The effects of moderately raised classroom temperatures and classroom ventilation rate on the performance of schoolwork by children (RP-1257). HVAC&R Research, 13(2): 193-220. https://doi.org/10.1080/10789669.2007.10390951
[5] Zomorodian, Z.S., Tahsildoost, M., Hafezi, M. (2016). Thermal comfort in educational buildings: A review article. Renewable and Sustainable Energy Reviews, 59: 898-906. https://doi.org/10.1016/j.rser.2016.01.033
[6] Singh, M.K., Ooka, R., Rijal, H.B. (2018). Thermal comfort in classrooms: A critical review. 10th Windsor Conference 2018: Rethinking Comfort, Cumberland Lodge, The Great Park, Windsor, Berkshire SL4 2HP. Published in Conference Proceedings.
[7] James, A.D., Christian, K. (2012). An assessment of thermal comfort in a warm and humid school building at Accra, Ghana. Intternational Journal of Advances in Applied Science Research, 3(1):535-547.
[8] Wong, H.N., Khoo, S.S. (2003). Thermal comfort in classrooms in the tropics. Energy and Buildings, 35(4): 337-351. https://doi.org/10.1016/S0378-7788(02)00109-3
[9] Ismail, A.R., Jusoh, N., Ibrahim, M.H.M., Panior, K N., Zin, M.Z.M., Hussain, M.A., Makhtar, N.K., (2010). Thermal comfort assessment in computer lab: A case study at Ungku Omar Polytechnic Malaysia. National Conference in Mechanical Engineering Research and Postgraduate Students (1st NCMER 2010), pp. 408-416.
[10] Pellegrino, M., Simonetti, M., Fournier, L. (2012). A field survey in Calcutta. Architectural issues, thermal comfort and adaptive mechanisms in hot humid climates. Proceedings of 7th Windsor Conference: The changing context of comfort in an unpredictable world Cumberland Lodge, Windsor, UK, London: Network for Comfort and Energy Use in Buildings.
[11] Kamaruzzaman, K., Tazilan, M.B.S.A. (2013). Thermal comfort assessment of a classroom in tropical climate conditions. Recent Advances in Energy, Environment and Development. Cambridge, MA, USA, pp. 87-91.
[12] Mishra, K.A., Ramgopal, M. (2014). Thermal comfort in undergraduate laboratories - A field study in Kharagpur, India. Building and Environment, 71: 223-232. http://dx.doi.org/10.1016/j.buildenv.2013.10.006
[13] Rajkumar, S., Amirtham R.L., Horrison, E. (2015). Thermal comfort assessment of a studio classroom in hot and humid climate conditions. ICUC9 - 9th International Conference on Urban Climate Jointly with 12th Symposium on the Urban Environment, Toulouse, France.
[14] Ali, M.S., Matrinson, B., Almaiyah, S. (2017). Evaluating indoor environmental performance of laboratories in a northern Nigerian university. Proceedings of 33rd PLEA International Conference, Design to Thrive, Edinburgh, pp. 591-598.
[15] Subhashinia, S., Thirumaran, K. (2018). A passive design solution to enhance thermal comfort in an educational building in the warm humid climatic zone of Madurai. Journal of Building Engineering, 18: 396-407. https://doi.org/10.1016/j.jobe.2018.04.014
[16] Cheung, T., Schiavon, S., Parkinson, T., Li, P., Barger, G. (2019). Analysis of the accuracy on PMV - PPD model using the ASHRAE Global Thermal Comfort Database II. Building and Environment, 153: 205-217. https://doi.org/10.1016/j.buildenv.2019.01.055
[17] Ye, G., Yang, C., Chen, Y., Li, Y. (2003). A new approach for measuring predicted mean vote (PMV) and standard effective temperature (SET*). Building and Environment, 38(1): 33-44. https://doi.org/10.1016/S0360-1323(02)00027-6
[18] Zhang, Y., Wang, J., Chen, H., Zhang, J., Meng, Q. (2010). Thermal comfort in naturally ventilated buildings in hot-humid area of China. Building and Environment, 45(11): 2562-2570. https://doi.org/10.1016/j.buildenv.2010.05.024
[19] Rahman, F., Tuhin, H.M.M. (2019). Daylight impact on learning environment in classrooms of secondary high school at Ishwardi, Pabna, Bangladesh. International Research Journal of Engineering and Technology, 6(10): 1148-1153.
[20] Singh, M.K., Ooka, R., Rijal, H.B., Kumar, S., Kumar, A., Mahapatra, S. (2019). Progress in thermal comfort studies in classrooms over last 50 years and way forward. Energy and Buildings, 188-189: 149-174, https://doi.org/10.1016/j.enbuild.2019.01.051
[21] American Society of Heating, Refrigerating and Air-conditioning Engineers (ASHRAE). (2017). ASHRAE standard 55-2017: Thermal environmental conditions for human occupancy, Atlanta, GA: Author.
[22] Parsons, K.C. (2006). Human Thermal Environments: The Effects of Hot, Moderate, and Cold Environments on Human Health, Comfort And Performance. Taylor & Francis Inc, ISBN 0-203-34618-1, London and New York.
[23] Tyler, H., Stefano, S., Federico, T., Toby, C., Kyle, S., Alberto, P., Dustin, M. (2019). CBE Thermal Comfort Tool. Center for the Built Environment, University of California Berkeley.
[24] Mondol, M.A.H., Kazi, M.S.I., Rahman, M.F., Rakib, M. R. (2019). Microclimatic study using temperature data of Jahangirnagar University of Bangladesh. Climate Change, 5(18): 108-115.
[25] Nahid, M.I., Begum, S., Feeroz, M.M. (2016). Brood parasitic cuckoos and their hosts in Jahangirnagar University campus. Indian BIRDS, 12 (2&3): 64-69.
[26] Nahid, M.I. (2014). Risk of brood parasitism and predation in relation to human activity in Jahangirnagar University campus, Bangladesh. NTNU-Trondheim, Norwegian University of Science and Technology.