Muhammad Salem* | Naoki Tsurusaki | Prasanna Divigalpitiya | Taher Osman | Omar Hamdy | Emad Kenawy
© 2020 IIETA. This article is published by IIETA and is licensed under the CC BY 4.0 license (http://creativecommons.org/licenses/by/4.0/).
OPEN ACCESS
During the last few decades, sustainable development (SD) has increasingly received attention globally. Therefore, international organizations and researchers sought to assess progress towards SD at different territorial levels. However, most of the studies were conducted at the city level and a very small number of studies has conducted at the urban periphery territory. This study aims to fill the current research gap through assessing the progress towards SD in the urban periphery of Greater Cairo (GC) in Egypt between 1996-2017. Eight composite indicators have been employed to assess the progress towards SD in this territory. These composite indicators were constructed based on the 14 individual indicators associated with sustainable development goals. The results showed meaningful progress achieved in the peripheral municipalities of GC, particularly in infrastructure and education indicators, while the economic and environmental indicators have deteriorated, particularly after the civic revolution of 2011. In addition, the study found a development gap between the urban periphery and the main urban agglomeration in GC, particularly in the infrastructure aspect. These results highlight the deficiencies that exist in the urban periphery of GC which help decision-makers to prepare appropriate policies to improve SD in such territory.
assessing, sustainable development, sustainable development indicator, urban periphery, greater Cairo, Egypt
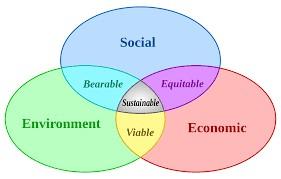
The concept of sustainable development (SD) has received great attention in recent decades [1, 2]. SD can be defined as a multi-dimensional process that involves positive changes in the social system, economic growth and environmental protection [3]. Thus, SD consists of three main aspects: social, economic, and environmental [4] commonly represented by three intersecting circles with overall sustainability at the center [5]. Besides, the intersection between these aspects determines the conditions of development that can be defined as bearable (environment and social), equitable (social and economic), and viable (environment and economic) [3, 5], as shown in Figure 1.
With the increasing importance of SD as a core of government programs, much attention has been focused on assessing SD in cities and its surrounding area [6]. Hence, many academics and scholars sought to assess the progress towards SD in these territories in both developed and developing countries [7-11]. For instance, Nagy et al. [2] have measured the SD in Cluj metropolitan area in Romania, Pires et al. [12] have gauged the SD in a number of cities and municipalities in Portugal and Zulaica has assessed the SD of Mar del Plata city in Argentina [13].
Assessment of SD is a comprehensive term for a process to measure the improvement of social, economic, and environmental aspects for a specific area [14, 15]. This process requires quantification of progress with the help of the appropriate indicators [6, 16]. These indicators are considered an effective tool that allows policymakers to assess the socio-economic and environmental status at various levels [17, 18]. Furthermore, these indicators aim to benchmark SD situations and monitor the progress towards Sustainable Development Goals [14]. International organizations have developed many indicators for assessing progress towards SD at various levels. For instance, the United Nations (UN) has adopted 17 Sustainable Development Goals (SDGs) and a set of 246 indicators to measure the progress towards SD [19-22]. The SDGs provide a framework for indicators in order to enhance SD globally [23]. Hence, at the local level, cities use these goals as a framework for their own sustainability performance.
However, Klopp and Arha et al. claim that many challenges emerge when practical use of SD indicators in the urban periphery of cities due to data limitation [24, 25]. Huang and Tanguay et al. argue that the unavailability of both information and strong data collection institutions leads to difficulty in applying SD indicators in the urban periphery [4, 26]. Rahma added that using individual indicators may serve to measure progress across some goals and targets but not for assessing the overall state of SD [27].
Composite indicators are increasingly used for benchmarking of municipalities and provinces over the years, summarizing in a simple measurement to assess the progress towards SD progress [28]. Plenty of scholars have employed composite indicators to assess SD in both developed and developing countries. For instance, Alen et al. [28] have used composite indicators to assess national progress and priorities for SD in Australia. Panda et al. [29] have used composite indicators for assessing SD in Indian cities. Rahma et al. [27] have used composite indicators for assessing SD in Indonesia. However, most of used composite indicators in previous studies not applicable in the urban periphery due to their unique characteristics as a mixture zone of urban and rural features [30, 31]. Diaz-Chavez argues that indicators related to poverty, health, and infrastructure are considered the most important indicators for assessing SD in the urban periphery. Thus, this study tries to construct a set of composite indicators that accommodates important indicators at the urban periphery (e.g., poverty and health indicators).
The urban periphery is located at the outer ring of cities [32] where urban and rural characteristics are mixed [33]. In some countries, scholars use other terms like Peri-urban, Urban fringe and Outskirt when referring to the urban periphery [34, 35]. Urban peripheries have been negatively influenced by the absence of planning policies, particularly in developing countries [36, 37]. In addition, most of the urban peripheries in developing countries suffer from lack of access to basic services and infrastructure [13]. The rapid loss of agricultural eventually threatens the sustainability in these territories [38]. However, very few studies have undertaken on appropriate indicators for assessing SD in the urban periphery [12, 39-41].
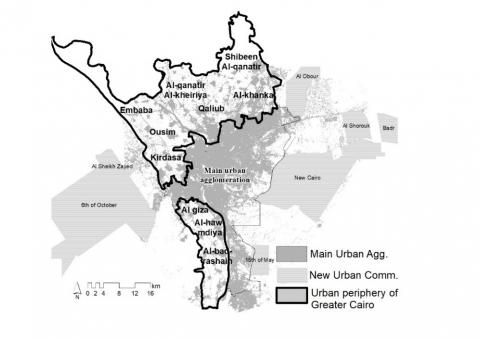
This study seeks to assess the progress towards SD in the urban periphery of Greater Cairo (GC) through a set of selected indicators. These indicators were collected from the official census and international reports from 1996-2017. The values of indicators in the main urban agglomeration have been used as a benchmark for peripheral municipalities to examine the development gap in the study area. The urban periphery of GC located in a range from 10 km to 25 km away from GC. It covers 35% of the total area of the Greater Cairo Region (GCR) and 26% of the total population (approximately 5 million inhabitants). Although after analyzing the state of SD in GC by a few studies [42, 43], the urban periphery was found to be neglected in all of them [34]. Therefore, this study seeks to fill the gap by assessing SD in this territory.
This paper is divided into five sections. Section 1 includes the introduction and research gap. Section 2 presents the study area and the method of the study. Section 3 shows the results of SD assessment. Section 4 discusses the results of the assessment and the limitations of the study. Finally, Section 5 shows the conclusion of the study.
Figure 1. The main aspects of sustainable development Adapted from Tanguay, 2010
2.1 Study area
The boundary of urban periphery of Greater Cairo (GC) has been defined by World Bank in 2008 and Sims in 2011, where it included more than 70 villages and towns [44, 45]. The size of settlements in the urban periphery ranged from less than 5,000 inhabitants to more than 100,000 inhabitants. According to 2017 census, the total population of the urban periphery of GC was 5,102 thousand inhabitants [34] with a total area of 1,048 km2, as shown in Table 1.
Table 1. Urban periphery weights in Greater Cairo Region
|
Greater Cairo Region |
Population(2017) |
Area |
||
|
thousand |
% |
Area (Km2) |
% |
|
|
Urban periphery |
5,102 |
26 |
1,048 |
35 |
|
Main urban Agglomeration |
13,105 |
68 |
507 |
17 |
|
New Urban Communities |
1,079 |
6 |
1,414 |
48 |
|
Total |
19,295 |
100 |
2,970 |
100 |
The boundary of urban periphery includes 10 municipalities (Marakiz) which are: El-Khanka, Shibeen Al-qanatir, Qaliub, Al-qanatir Al-khieriya, Embaba, Ousim, Kirdasa, Al-giza, Al-hawamdiya, and Al-badrashain, as shown in Figure 2.
Figure 2. Study area
2.2 Indicator-based assessment
Indicators are increasingly being an important tool to measure and assess the progress of SD [46, 47]. Indicator-based assessment is the process by which information on indicators is interpreted to produce clear guidance for policymakers [26]. The composite Indicators can provide decision-makers with an overview of the municipalities’ performance over a specific time [46]. To simplify the assessment process, the study has used 8 composite indicators to compare the performance of peripheral municipalities. These composite indicators were formed based on 14 individual indicators related to SDGs. The used indicators were compiled from census and international reports over 1996-2017 to track the changes of SD. Table 2 shows the used indicators in the study area and their relevant SDGs.
Table 2. The used indicators in the study area
|
Composite indicators |
Individual Indicators |
Relevant SDGs |
|
Poverty |
Poverty rate |
Goal 1 (No Poverty) |
|
Health |
Physician density |
Goal 3 (Good Health) |
|
under-5 Mortality rate |
||
|
Education |
+15 Literacy rate |
Goal 4 (Quality of Education) |
|
Total enrolment rate in primary education |
||
|
Equality |
Female enrolment rate in primary education |
Goal 5 (Gender Equality) |
|
Infrastructure |
Households connected to the Water Network |
Goal 6 (Clean Water and Sanitation) |
|
Households connected to the sanitation network |
||
|
Households connected to electricity network |
Goal 7 (Affordable Energy) |
|
|
Economy |
GDP per capita |
Goal 8 (Decent Work) |
|
Unemployment rate |
||
|
Built Environment |
Urban Density |
Goal 11 (Sustainable Communities) |
|
Crowding Rate |
||
|
Environment |
Annual loss of Agriculture lands |
Goal 15(Life on Land) |
The poverty indicator was calculated based on the percentage of the number of poor people living under the poverty line to the total population. The poverty line has been determined by the central agency for public mobilization and statistics (CAPMAS) as an income of 8,827 Egyptian pounds per year (533 USD a year or approximately 1.40 USD a day) [48]. The health indicator was calculated based on two individual indicators which are the density of physicians and under-five mortality rate.
The education indicator was calculated based on two individual indicators which are literacy rate and enrolment rate in primary education. As for equality indicator, the study used the enrolment rate in primary education for females as an indicator for the equality in the peripheral municipalities. The infrastructure indicator was calculated based on three individual indicators which water, sanitary and electricity access.
The economy indicator was calculated based on two individual indicators which are Gross Domestic Product (GDP) per capita and unemployment rate. The built environment indicator was calculated based on two individual indicators which are urban density and crowding rate. As for environment indicator, the annual loss of agricultural land was used to monitor the change in the environment in the peripheral municipalities. The following section will explain the used method to normalize and aggregate of indicators.
2.3 Normalization and aggregation of indicators
Since the indicators of SD have different measurement units, so, it is necessary to bring the indicators to the same standard before any aggregation process. This can be done by normalization of indicators by transforming them into pure numbers [49]. This process aims to make indicators simple and comparable [50]. There are various approaches to normalization, such as Rescaling (Min-Max) standardization, Z-score standardization and ranking standardization [51]. Since rescaling (Min-Max) standardization approach is a common approach and has been used by many organizations and researchers, i.e. the United Nations Development Programme for the Human Development Index (HDI), the African Development Bank for the Africa Gender Equality Index (GEI), and Lemke and Bastini [52] for Multilevel Sustainable Development Index (MLSDI), the study has chosen this approach for normalization of indicators.
The study has rescaled the values of indicators from 0 to 100, with 0 indicating worst performance and 100 indicating the optimum using the formula described in Eq. (1) as follows:
$x i=\frac{x-\min (x)}{\max (x)-\min (x)}$ (1)
where, xi is the normalized value of indicator, x is an actual value of indicator before normalization
Since some indicators have a negative impact on SD, such as poverty, under-5 mortality rate, and the annual loss of agriculture land, they have to be reversed so that they will conform to the positive interpretation of SD. For instance, since poverty has a negative impact on SD in the urban periphery, the indicator will be reversed as 100-poverty value. Similarly, for other indicators which have a negative impact on SD.
After normalizing the indicators, the study has aggregated the normalized indicators to assess the progress towards SD in the study area. The aggregation process of indicators is considered a simple way to explain the whole status of SD to policymakers; therefore, it has been conducted widely for assessing the performance of various administrative units such as municipalities [50]. Kondyli and Carraro have argued that this process can capture regional disparities between municipalities [50, 53]. According to Talukder and Carraro the arithmetic mean is the easiest way to aggregate the indicators [50, 54]. Thus, the study has used the arithmetic mean to aggregate the normalized indicators.
Moreover, the study has compared the values of composite indicators in both the peripheral municipalities and the main urban agglomeration to identify the gap between them in terms of the progress towards SD.
The values of the 8 composite indicators in the peripheral municipalities has changed significantly over 1996-2017 as follows:
3.1 Poverty
The poverty indicator shows a dramatic increase in the percentage of poor people over 1996-2017, particularly in the last statistics of 2017. The highest percentage of poor people has been recorded in Al-badrashain municipality. While Al-khanka municipality has recorded the lowest percentage of poor people in 2017.
However, Al-qanatir Al-kheiriya municipality witnessed the highest increase of poor people, where the percentage of poor people was 17% only in 1996 then increased dramatically in 2017 to reach 50% of total population. Table 3 shows the increase in the percentage of poor people in the peripheral municipalities over 1996-2017.
Table 3. The increase in the percentage of poor people in the peripheral municipalities over 1996-2017
|
Peripheral municipalities (Marakiz) |
percentage of poor people |
||
|
1996 |
2006 |
2017 |
|
|
Al-badrashain |
28 |
45 |
55 |
|
Al-giza |
22 |
40 |
43 |
|
Al-hawamdiya |
15 |
50 |
35 |
|
Al-khanka |
10 |
22 |
20 |
|
Al-qanatir Al-kheiriya |
17 |
55 |
50 |
|
Embaba |
19 |
45 |
42 |
|
Kirdasa |
19 |
33 |
42 |
|
Ousim |
24 |
50 |
45 |
|
Qaliub |
8 |
25 |
27 |
|
Shibeen Al-qanatir |
9 |
33 |
28 |
|
Avg. of peripheral municipalities |
17 |
40 |
39 |
Source: CAPMAS 2017, Egyptian Social Fund for Development (SFD) 2006
3.2 Health
3.2.1 Physician density
Physician density refers to the number of medical doctors, including generalist and specialist medical practitioners, per 1000 population. The indicator of physician density shows a considered improvement in physician density over 2006-2017, particularly in Embaba municipality. Table 4 shows the change in physician density in the peripheral municipalities over 2006-2017.
Table 4. The change in physician density in the peripheral municipalities over 2006-2017
|
Municipalities (Marakiz) |
Physician density 2006 |
Physician density 2017 |
|
Al-badrashain |
0.2 |
0.4 |
|
Al-giza |
0.3 |
0.5 |
|
Al-hawamdiya |
0.9 |
0.9 |
|
Al-khanka |
0.2 |
0.3 |
|
Al-qanatir Al-kheiriya |
0.4 |
0.6 |
|
Embaba |
0.2 |
0.5 |
|
Kirdasa |
0.3 |
0.3 |
|
Ousim |
0.2 |
0.3 |
|
Qaliub |
0.3 |
0.4 |
|
Shibeen Al-qanatir |
0.4 |
0.6 |
|
Avg. of peripheral municipalities |
0.3 |
0.5 |
Source: CAPMAS, World Health Organization (WHO)
3.2.2 Mortality under-5 rate
As for the indicator of under 5 mortality rate, peripheral municipalities witnessed remarkable improvement over 2003-2013, particularly in Qaluib municipality where it declined from 50.5 in 1996 to 15.4 deaths per 1,000 live births in 2017. Table 5 shows the change in -5 mortality rate in the peripheral municipalities over 1996-2017.
Table 5. Mortality rate, under-5 (per 1,000 live births) in the peripheral municipalities
|
Municipalities (Marakiz) |
under-5 mortality rate |
||
|
1996 |
2006 |
2017 |
|
|
Al-badrashain |
24.9 |
16.2 |
15.5 |
|
Al-giza |
24.1 |
16.2 |
15.5 |
|
Al-hawamdiya |
21.7 |
16.2 |
15.5 |
|
Al-khanka |
21.1 |
15.5 |
15.6 |
|
Al-qanatir Al-kheiriya |
24.2 |
15.5 |
15.6 |
|
Embaba |
26.2 |
16.2 |
15.5 |
|
Kirdasa |
21.8 |
16.2 |
15.5 |
|
Ousim |
24.7 |
16.2 |
15.5 |
|
Qaliub |
50.5 |
15.5 |
15.4 |
|
Shibeen Al-qanatir |
28.1 |
15.5 |
15.6 |
|
Avg. of peripheral municipalities |
26.7 |
15.9 |
15.5 |
Source: World Bank report of Egyptian governorates, Census.
3.3 Education
3.3.1 (15+) literacy rate
The results show that (15+) literacy rate in the peripheral municipalities stood at 62.8% in 1996 and increased to 72.2% in 2017. The highest rate of literacy in 2017 was in Al-khanka municipality where it reached 80.4%. However, Shibeen Al-qanatir municipality witnessed the highest increase of literacy rate, where it increased from 63.6% in 1996 to 81.5% in 2017, as shown in Table 6.
3.3.2 Total enrolment rate in primary education
The total enrollment rate in primary education is the ratio between all students enrolled in primary education and the population of official primary education age. The results show that the total enrollment rate in primary education has a considerable increase in the peripheral municipalities from 1996-2017. For instance, the total enrollment rate in Qaliub municipality increased from 63.4% in 1996 to 84.1% in 2017. Table 6 shows the changes of literacy rate and total enrolment rate in primary education in the peripheral municipalities over 1996-2017.
Table 6. The changes of literacy rate and total enrolment rate in primary education in the peripheral municipalities
|
Peripheral municipalities |
% (15+) literacy |
% Total enrolment rate in primary education |
||||
|
1996 |
2006 |
2017 |
1996 |
2006 |
2017 |
|
|
Al-badrashain |
57.9 |
58.4 |
60.0 |
71 |
77.3 |
77.5 |
|
Al-giza |
59.3 |
62.5 |
66.9 |
71.3 |
72.6 |
74 |
|
Al-hawamdiya |
70.8 |
70.3 |
76.0 |
72.7 |
88.9 |
90.1 |
|
Al-khanka |
64.7 |
70 |
80.4 |
87.3 |
88 |
89.1 |
|
Al-qanatir Al-kheiriya |
62.2 |
68.6 |
73.6 |
85.2 |
82 |
83.2 |
|
Embaba |
63.2 |
63.7 |
65.4 |
69 |
74.7 |
76.3 |
|
Kirdasa |
63.2 |
71 |
71.7 |
69 |
72.5 |
76.3 |
|
Ousim |
62.6 |
67.7 |
66.8 |
93 |
84.5 |
85.4 |
|
Qaliub |
60.6 |
64.8 |
77.2 |
63.4 |
83 |
84.1 |
|
Shibeen Al-qanatir |
63.6 |
70.7 |
81.5 |
83.5 |
88 |
89.1 |
|
Avg. of peripheral municipalities |
62.8 |
66.8 |
72.2 |
76.5 |
81.2 |
82.5 |
Table 7. The enrollment rate for females in primary education
|
Peripheral municipalities (Marakiz) |
Enrolment rate in primary education for female |
||
|
1996 |
2006 |
2017 |
|
|
Al-badrashain |
69.1 |
93 |
96 |
|
Al-giza |
69.6 |
93 |
96 |
|
Al-hawamdiya |
71.7 |
93 |
96 |
|
Al-khanka |
85.9 |
84.6 |
86.5 |
|
Al-qanatir Al-kheiriya |
83.8 |
84.6 |
86.5 |
|
Embaba |
67.5 |
93 |
96 |
|
Kirdasa |
67.5 |
93 |
96 |
|
Ousim |
89.6 |
93 |
96 |
|
Qaliub |
77.1 |
84.6 |
86.5 |
|
Shibeen Al-qanatir |
82.2 |
84.6 |
86.5 |
|
Avg. of peripheral municipalities |
76.4 |
89.64 |
92.2 |
3.4 Equality
As for equality indicator, the results show that the enrolment rate for females in the primary education in the peripheral municipalities was better than the total enrollment rate. The average enrolment rate for females has improved from 76.4% in 1996 to 92.2% in 2017, as shown in Table 7.
3.5 Infrastructure
3.5.1 Water access
On average, the percentage of households with access to the public water network increased from 87.7% in 1996 to 96.8% of total households in 2017, as shown in Table 8.
3.5.2 Sanitation access
While access to public water network exceeds 96% in the peripheral municipalities, the access to public sanitation network is quite different. The results show that 54.4% only of the households have access to the public sanitation network, as shown in Table 8.
3.5.3 Electricity access
The results show that more than 95% of households in the peripheral municipalities had access to the public electricity network in 1996 and this percentage has increased to 100% approximately in 2017, as shown in Table 8.
3.6 Economy
3.6.1 GDP per capita
Gross domestic product (GDP) is a monetary measure of the market value of all finished goods and services produced during a specified period of time and commonly used as a reference for the economic condition [51].
The average GDP per capita in the peripheral municipalities has increased from 3928 EGP in 1996 to 6988 in 2017. Embaba municipality has witnessed the highest increase in GDP per capita where it increased from 4069 EGP in 1996 to 8243 EGP in 2017, as shown in Table 9.
3.6.2 Unemployment rate
The indicator of unemployment indicated that the percentages of unemployment had increased in all peripheral municipalities where the average increased to 12.5 % in 2017, as shown in Table 9.
Table 8. The percentages of households connected to infrastructure services in the peripheral municipalities over 1996-2017
|
Peripheral municipalities |
% Households connected to water network |
% Households connected to sanitation network |
% Households connected to electricity network |
||||||
|
1996 |
2006 |
2017 |
1996 |
2006 |
2017 |
1996 |
2006 |
2017 |
|
|
Al-badrashain |
92.0 |
97.6 |
97.1 |
8.1 |
13.2 |
75.1 |
96 |
99.8 |
99.3 |
|
Al-giza |
90.8 |
92.1 |
99.6 |
32.8 |
39.8 |
57.9 |
96.1 |
99.2 |
99.8 |
|
Al-hawamdiya |
92.2 |
99.6 |
98.6 |
13.0 |
24.0 |
35.1 |
96.2 |
99.3 |
99.9 |
|
Al-khanka |
91.4 |
93.2 |
94.8 |
25.9 |
36.0 |
66.6 |
96 |
99.3 |
99.8 |
|
Al-qanatir Al-kheiriya |
89.4 |
95.1 |
93.7 |
19.0 |
28.5 |
48.5 |
96 |
99.3 |
99.8 |
|
Embaba |
92.0 |
97.5 |
95.6 |
13.4 |
19.6 |
36.8 |
96 |
99.1 |
99.9 |
|
Kirdasa |
92.0 |
96.9 |
98.2 |
13.4 |
53.4 |
74.7 |
96.2 |
99.8 |
99.9 |
|
Ousim |
92.1 |
99.9 |
99.9 |
44.7 |
69 |
94.5 |
96 |
99.9 |
99.9 |
|
Qaliub |
69.5 |
97.2 |
99.0 |
32.2 |
32.2 |
25.9 |
96.1 |
99.8 |
99.8 |
|
Shibeen Al-qanatir |
75.2 |
98 |
91.7 |
7.2 |
18.8 |
29.1 |
96 |
99.3 |
99.8 |
|
Avg. of peripheral municipalities |
87.7 |
96.7 |
96.8 |
21.0 |
33.5 |
54.4 |
96.1 |
99.5 |
99.8 |
Source: Censuses of 1996, 2006 and 2017
Table 9. GDP per capita and unemployment rate in the peripheral municipalities over 1996-2017
|
Peripheral municipalities (Marakiz) |
GDP per capita (EGP) |
Unemployment (%) |
||||
|
1996 |
2006 |
2017 |
1996 |
1996 |
1996 |
|
|
Al-badrashain |
4753 |
5492 |
7338 |
4.6 |
6.2 |
12.3 |
|
Al-giza |
5175 |
6688 |
8243 |
5.3 |
8.5 |
12.3 |
|
Al-hawamdiya |
4750 |
5426 |
7248 |
9.4 |
12 |
12.3 |
|
Al-khanka |
2164 |
4280 |
5717 |
5.6 |
7.7 |
12.7 |
|
Al-qanatir Al-kheiriya |
2535 |
4611 |
6159 |
6.1 |
10.6 |
12.7 |
|
Embaba |
4069 |
6903 |
8243 |
7.6 |
9.6 |
12.3 |
|
Kirdasa |
4069 |
5411 |
7228 |
7.6 |
9 |
12.3 |
|
Ousim |
5042 |
5411 |
7243 |
6.2 |
6.6 |
12.3 |
|
Qaliub |
3800 |
4831 |
6453 |
6.1 |
6.7 |
12.7 |
|
Shibeen Al-qanatir |
2919 |
4500 |
6012 |
8.7 |
7.7 |
12.7 |
|
Avg. of peripheral municipalities |
3928 |
5355 |
6988 |
6.7 |
8.5 |
12.5 |
Source: World Bank report of Egyptian governorates, CAPAMAS
3.7 Built environment
3.7.1 Urban density
Urban density is the number of people who live in the city and its peripheries divided into the total urban area. The urban density has increased significantly in the peripheral municipalities over 1996-2017 which reflected negatively on the built environment. The urban density was ranged between 95-195 person/feddan in 1996. While in 2017, the density was ranged between 161-275 person/feddan, as shown in Table 10.
3.7.2 Crowding rate
Crowding is considered one of the major elements affecting built environment and quality of life. The average crowding rate in the peripheral municipalities has decreased from 1.4 to 1.2 person/room over 1996-2017, as shown in Table 11.
3.8 Environment
The environment in the peripheral municipalities has been negatively affected by the rapid loss of agricultural land. The results indicated that unprecedented rate of loss of agricultural has been occurred in the urban periphery of GC, particularly in the last decade. The annual loss of agricultural land in the peripheral municipalities has increased from 9.2% annually during 1996-2006 to 12.2% annually during 2006-2017. Al-khanka and Al-qanatir Al-kheiriya municipalities have recorded the highest rate of annual loss of agricultural land which exceeds than 15% annually, as shown in Table 12.
Table 10. The urban density in the peripheral municipalities over 1996-2017
|
Peripheral municipalities (Marakiz) |
Urban density (person/feddan) |
||
|
1996 |
2006 |
2017 |
|
|
Al-badrashain |
181 |
234 |
211 |
|
Al-giza |
195 |
237 |
273 |
|
Al-hawamdiya |
147 |
166 |
275 |
|
Al-khanka |
116 |
142 |
240 |
|
Al-qanatir Al-kheiriya |
156 |
175 |
226 |
|
Embaba |
142 |
179 |
194 |
|
Kirdasa |
154 |
180 |
247 |
|
Ousim |
154 |
181 |
209 |
|
Qaliub |
125 |
152 |
172 |
|
Shibeen Al-qanatir |
95 |
118 |
161 |
|
Avg. of peripheral municipalities |
156 |
162 |
221 |
Source: Calculated in ARCGIS software
Table 11. The crowding rate in the peripheral municipalities over 1996-2017
|
Peripheral municipalities (Marakiz) |
Crowding rate (person/room) |
||
|
1996 |
2006 |
2017 |
|
|
Al-badrashain |
1.32 |
1.15 |
1.24 |
|
Al-giza |
1.47 |
1.45 |
1.32 |
|
Al-hawamdiya |
1.41 |
1.18 |
1.24 |
|
Al-khanka |
1.28 |
1.15 |
1.16 |
|
Al-qanatir Al-kheiriya |
1.36 |
1.14 |
1.14 |
|
Embaba |
1.32 |
1.16 |
1.30 |
|
Kirdasa |
1.32 |
1.17 |
1.29 |
|
Ousim |
1.53 |
1.41 |
1.35 |
|
Qaliub |
1.31 |
1.29 |
1.21 |
|
Shibeen Al-qanatir |
1.26 |
1.13 |
1.12 |
|
Avg. of peripheral municipalities |
1.4 |
1.2 |
1.2 |
Source: Censuses of 1996, 2006 and 2017
Table 12. The annual loss of agricultural land in the peripheral municipalities over 1996-2017
|
Peripheral municipalities (Marakiz) |
Annual loss of agricultural land |
||
|
1996 -2006 |
2006-2017 |
||
|
Al-badrashain |
13.8 |
14 |
|
|
Al-giza |
7.9 |
12 |
|
|
Al-hawamdiya |
4.35 |
8 |
|
|
Al-khanka |
13.9 |
17 |
|
|
Al-qanatir Al-kheiriya |
15.8 |
16 |
|
|
Embaba |
4.6 |
8 |
|
|
Kirdasa |
11.4 |
13 |
|
|
Ousim |
4.1 |
6 |
|
|
Qaliub |
14.3 |
15 |
|
|
Shibeen Al-qanatir |
1.9 |
9 |
|
|
Avg. of peripheral municipalities |
9.2 |
12.2 |
|
3.9 Overall progress of SD in the peripheral municipalities over 1996-2017
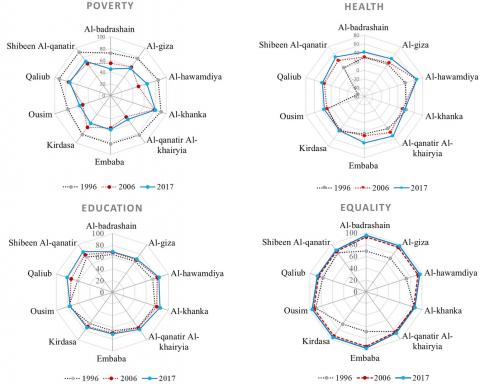
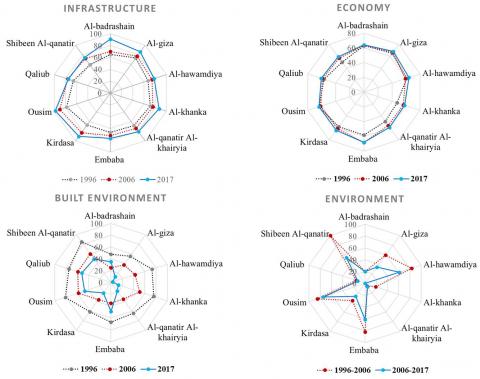
Overall assessment requires a further combination of all composite indicators. Based on the methodology explained earlier in section 2, the study has normalized and aggregated the used indicators to assess the overall progress attained in SD in the peripheral municipalities. Table 13 and Figure 3 show the overall progress of SD indicators in the peripheral municipalities of GC over 1996-2017.
Table 13. Overall progress of SD indicators in the peripheral municipalities of GC over 1996-2017
|
Peripheral municipalities |
Poverty |
Health |
Education |
Equality |
Infra. |
Economy |
B.E. |
Enviro. |
|||||||||||||||
|
96 |
06 |
17 |
96 |
06 |
17 |
96 |
06 |
17 |
96 |
06 |
17 |
96 |
06 |
17 |
96 |
06 |
17 |
96 |
06 |
17 |
06 |
17 |
|
|
Al-badrashain |
72 |
55 |
45 |
29 |
30 |
41 |
64 |
68 |
69 |
69 |
93 |
96 |
65 |
70 |
91 |
63 |
63 |
64 |
48 |
25 |
35 |
20 |
20 |
|
Al-giza |
78 |
60 |
57 |
31 |
35 |
46 |
65 |
68 |
70 |
70 |
93 |
96 |
73 |
77 |
86 |
65 |
67 |
68 |
55 |
37 |
12 |
59 |
34 |
|
Al-hawamdiya |
85 |
50 |
65 |
38 |
65 |
66 |
72 |
80 |
83 |
72 |
93 |
96 |
67 |
74 |
78 |
61 |
59 |
64 |
73 |
43 |
3 |
83 |
61 |
|
Al-khanka |
90 |
78 |
80 |
40 |
31 |
36 |
76 |
79 |
85 |
86 |
85 |
87 |
71 |
76 |
87 |
47 |
56 |
58 |
76 |
51 |
13 |
19 |
1 |
|
Al-qanatir Al-kheiriya |
83 |
45 |
50 |
31 |
41 |
51 |
74 |
75 |
78 |
84 |
85 |
87 |
68 |
74 |
81 |
49 |
56 |
59 |
64 |
35 |
18 |
6 |
7 |
|
Embaba |
82 |
55 |
58 |
25 |
30 |
46 |
66 |
69 |
71 |
68 |
93 |
96 |
67 |
72 |
77 |
58 |
68 |
68 |
67 |
35 |
49 |
82 |
61 |
|
Kirdasa |
82 |
67 |
58 |
38 |
35 |
36 |
66 |
72 |
74 |
68 |
93 |
96 |
67 |
83 |
91 |
58 |
61 |
64 |
61 |
36 |
22 |
36 |
27 |
|
Ousim |
76 |
50 |
55 |
29 |
30 |
36 |
78 |
76 |
76 |
90 |
93 |
96 |
78 |
90 |
98 |
64 |
62 |
64 |
81 |
58 |
47 |
85 |
74 |
|
Qaliub |
92 |
75 |
73 |
-44 |
36 |
41 |
62 |
74 |
81 |
77 |
85 |
87 |
66 |
76 |
75 |
57 |
59 |
61 |
75 |
59 |
52 |
16 |
13 |
|
Shibeen Al-qanatir |
91 |
67 |
72 |
20 |
41 |
51 |
74 |
79 |
85 |
82 |
85 |
87 |
59 |
72 |
74 |
50 |
57 |
59 |
85 |
60 |
49 |
99 |
54 |
Figure 3. Overall progress of SD indicators in the peripheral municipalities of GC over 1996-2017
Table 14. The progress towards SD in the urban periphery versus the main urban agglomeration over 1996-2017
|
Peripheral municipalities |
Poverty |
Health |
Education |
Equality |
Infra. |
Economy |
B.E. |
Enviro. |
||||||||
|
96 |
17 |
96 |
17 |
96 |
17 |
96 |
17 |
96 |
17 |
96 |
17 |
96 |
17 |
96 |
17 |
|
|
Avg. of Peripheral municipalities |
83 |
61 |
24 |
46 |
70 |
77 |
76 |
92 |
68 |
84 |
57 |
63 |
69 |
30 |
51 |
30 |
|
Main Urban Agglomeration |
87 |
78 |
31 |
89 |
84 |
87 |
87 |
98 |
93 |
98 |
76 |
74 |
72 |
42 |
90 |
90 |
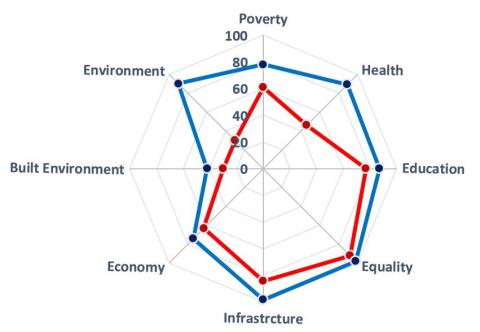
Figure 4. The state of SD in the urban periphery versus the main urban agglomeration
According to the overall progress of SD, Shibeen Al-qanatir is the top performers and seem to be the most sustainable municipality around GC. While the municipalities of Al-badrashain and Al-giza appear to have the least sustainable progress towards SD.
In general, a considered improvement has been achieved in the peripheral municipalities over 1996-2006. However, if we compare the values of SD indicators in the peripheral municipalities with the values in the main urban agglomeration, we found significant differences between them. Table 14 illustrates the progress towards SD in the urban periphery versus the main urban agglomeration over 1996-2017. Figure 4 shows the state of SD in the urban periphery versus the main urban agglomeration based on the overall assessment in 2017.
4.1 Assessing the progress towards SD in the peripheral municipalities
4.1.1 Poverty
The results have shown a dramatic increase in poverty in all peripheral municipalities. The flotation of the Egyptian pound (EGP) in November 2016 has led to devalued of EGP by 33% which reflected on the increase of poverty, particularly in peripheral and rural municipalities. This was exacerbated by rising inflation and the reduction or removal of subsidies which many rely upon for their survival [55]. Furthermore, if we compare the percentage of poor people in the peripheral municipalities (38.7%) to the percentage in the main urban agglomeration (22% in 2017) we will find that these peripheral municipalities are significantly poorer, particularly in Al-badrashain and Al-qanatir Al-kheiriya municipalities.
4.1.2 Health
Although considerable improvement in physician density indicator in the peripheral municipalities over 2006-2017, the current density still lower than standard density. The World Health Organization estimates that at least 2.5 physicians per 1,000 people are needed to provide sufficient coverage of health care. Also, at national level, the average of physician density in the peripheral municipalities stands at 0.5 physician per 1,000 people which is significantly lower compared to the rate in the main urban agglomeration (1.3 physician per 1,000 people). In addition, Egypt’s Central Agency for Public Mobilization and Statistics (CAPMAS) noted in 2017 that the disparity between main urban agglomeration and peripheral municipalities access to health care persists [56]. CAPMAS added that the rapid growing of population creates obstacles to improving health care in the peripheral municipalities.
4.1.3 Education
The reason for low percentage of literacy rate in the peripheral municipalities is the lack of interest in this issue by most of residents who are farmers [23]. However, the enrollment rate in the primary education has witnessed a remarkable improvement in most of the peripheral municipalities due to increasing number of schools in these municipalities over 1996-2017 [23]. On contrary, the enrollment rate in the primary education in Al-qanatir Al-kheiriya municipality has declined due to the rapid increase of number of students in the corresponding age group without the same increase of number of schools in many of villages. The shortage of number of schools has negatively affected on the enrollment rate.
4.1.4 Equality
The census of 2017 showed a remarkable improvement in the enrollment rate for the female, particularly in Embaba and Kirdasa municipalities, where it increased from 67.5% in 1996 to 96% in 2017. However, there is still a gap between peripheral municipalities and the Main urban agglomeration, where the rate in the main urban agglomeration stood at 89.1 in 1996 and increased to 98.0 in 2017.
4.1.5 Infrastructure
Although of high percentage of households with access to the public water network in the peripheral municipalities. Tadamun Social Society (TSS) argues that wide areas still suffer from water outages during the daytime in particular [57].
Regarding sanitation service, 45.6% of households in the peripheral municipalities still use septic tanks as an alternative to the public sanitation network which lead to leak sewage into the ground [57]. Moreover, the deteriorated status of pipes transporting water in these municipalities, sewage from septic tank leakage might even pollute the water source.
Regarding electricity service, almost all peripheral municipalities had access to the public electricity network.
4.1.6 Economy
Although of increase in GDP per capita in all peripheral municipalities, this increase is considered unrealistic increase due to the decrease in local currency value since 2016 and increase in inflation as we have mentioned earlier. On the other hand, political upheaval after the civic revolution in Egypt in 2011 has affected on increasing unemployment and damaging the economy where the growth rate declined from 5.3% before the revolution to 1.8% after the revolution [58].
4.1.7 Built environment
According to Egyptian regulation, the urban density should be less than 250 persons per feddan in urban cities and less than 150 persons per feddan in villages. Therefore, the urban densities in the peripheral municipalities are considered very high. On the other hand, the quantitative analysis of the crowding data indicated that reason for this decline most probably because of the increasing numbers of the vacant houses in the PUA due to real estate speculation in these areas where the percentages of vacant houses reach 22.7 % of the total number of apartments [59].
4.1.8 Environment
According to Food and Agriculture Organization (FAO) the annual loss of agricultural land is considered extremely high if it exceeds 2% annually. The results show that the average annual loss of agricultural land in the peripheral municipalities has exceeded than 12% annually in 2017 which is considered one of the highest rate globally [60]. Salem et al. have noted that this high rate of loss might led to vanish agricultural land completely within the next sixty years [61].
4.1.9 Overall assessment
The assessment shows those municipalities which achieved progress towards sustainability and those which are still lagging. Shibeen Al-qanatir municipality recorded the highest score of sustainability indicators. While municipalities of Embaba, Al-giza and Al-badrashain recorded the lowest score.
Although, the peripheral municipalities have achieved a remarkable improvement in SD indicators over 1996-2006, a development gap still exists between peripheral municipalities and the main urban agglomeration, especially in the infrastructure aspect. This result is compatible with the results of Zhijiang et al. who evaluated the progress in SD at the provincial and municipal levels along China’s Yangzte River Economic Belt [51].
The study noticed an indirect relation between all indicators which mean that the development in one of these indicators influence the progress of the other indicators. This result is compatible with the results of Hoeltl et al. who studied the SD in in Ethiopia [62].
4.2 Data gaps and challenges
In spite of effort to improve the results of the study, a few limitations have arisen as follows: (a) data were limited regarding peripheral municipalities which affected on the number of used indicators. Therefore, adding more indicators may contribute in increasing the accuracy of results. (b) the used indicators were based on census data, which does not give precise and up to date reflections about the state of the municipalities. (c) The study has used Min- Max standardization approach to normalize the indicators. This approach is based on extreme values (maximum and minimum), nevertheless these two values can be outliers, the range of maximum and minimum strongly influences the result [54]. Yet, this approach is acceptable and has been applied in many studies to construct composite indicators, the best-known of which is the Human Development Index (HDI). In addition, composite indicators are considered a simple tool to present complex issues to decision makers.
This study has assessed the progress towards SD at the urban periphery level by measuring 8 composite indicators in the peripheral municipalities of GC over 1996-2017. These composite indicators were constructed based on 14 individual indicators associated with sustainable development goals (SDGs). The results showed that a considered improvement has been achieved in these municipalities, particularly in infrastructure and education. On contrary, the environment and economic indicators have deteriorated particularly since the civic revolution of 2011. On the other hand, the peripheral municipalities had slowly narrowed the gap with the main urban agglomeration in terms of inequality and infrastructure. Nevertheless, a wide gap still exists in health aspect. The study can support decision-makers to detect the underdevelopment municipalities; and therefore, preparing the appropriate strategies to develop these municipalities. A few limitations have faced the study, particularly regarding the availability of data in the peripheral municipalities. However, the study has overcome this limitation by employing a set of composite indicators cover the most important issues related to SD in the study area.
[1] Khalid, A.M., Sharma, S., Dubey, A.K. (2018). Developing an indicator set for measuring sustainable development in India. Natural Resources Forum, 42(3): 185-200. https://doi.org/10.1111/1477-8947.12151
[2] Nagy, J.A., Benedek, J., Ivan, K. (2018). Measuring sustainable development goals at a local level: A case of a Metropolitan Area in Romania. Sustainability (Switzerland), 10(11): 3962. https://doi.org/10.3390/su10113962
[3] Mensah, J. (2019). Sustainable development: Meaning, history, principles, pillars, and implications for human action: Literature review. Cogent Social Sciences, 5(1). https://doi.org/10.1080/23311886.2019.1653531
[4] Tanguay, G.A., Rajaonson, J., Lefebvre, J.F., Lanoie, P. (2010). Measuring the sustainability of cities: An analysis of the use of local indicators. Ecological Indicators, 10(2): 407-418. https://doi.org/10.1016/j.ecolind.2009.07.013
[5] Purvis, B., Mao, Y., Robinson, D. (2019). Three pillars of sustainability: In search of conceptual origins. Sustainability Science, 14(3): 681-695. https://doi.org/10.1007/s11625-018-0627-5
[6] United Nations. (2013). World economic and social survey 2013: Sustainable development challenges. New York, NY, USA. https://www.un.org/en/development/desa/publications/world-economic-and-social-survey-2013-sustainable-development-challenges.html, accessed on Nov. 3, 2020.
[7] Wandl, A., Magoni, M. (2017). Sustainable planning of peri-urban areas: Introduction to the special issue. Planning Practice & Research, 32(1): 1-3. https://doi.org/10.1080/02697459.2017.1264191
[8] Hiremath, R.B., Balachandra, P., Kumar, B., Bansode, S.S., Murali, J. (2013). Indicator-based urban sustainability-A review. Energy for Sustainable Development, 17(6): 555-563. https://doi.org/10.1016/j.esd.2013.08.004
[9] Mori, K., Christodoulou, A. (2012). Review of sustainability indices and indicators: Towards a new City Sustainability Index (CSI). Environmental Impact Assessment Review, 32(1): 94-106. https://doi.org/10.1016/j.eiar.2011.06.001
[10] Shen, L.Y., Jorge Ochoa, J., Shah, M.N., Zhang, X. (2011). The application of urban sustainability indicators - A comparison between various practices. Habitat International, 35(1): 17-29. https://doi.org/10.1016/j.habitatint.2010.03.006
[11] Verma, D., Jana, A., Ramamritham, K. (2019). Transfer learning approach to map urban slums using high and medium resolution satellite imagery. Habitat International, 88: 101981. https://doi.org/10.1016/j.habitatint.2019.04.008
[12] Moreno Pires, S., Fidélis, T., Ramos, T.B. (2014). Measuring and comparing local sustainable development through common indicators: Constraints and achievements in practice. Cities, 39: 1-9. https://doi.org/10.1016/j.cities.2014.02.003
[13] Zulaica, M.L. (2019). Is Mar del Plata (Argentina) a sustainable city? An evaluation of the sustainability of urban and peri-urban areas using indicators. Sustentabilidade Em Debate, 10(2): 10-27. https://doi.org/10.18472/sustdeb.v10n2.2019.20646
[14] Dizdaroglu, D. (2015). Developing micro-level urban ecosystem indicators for sustainability assessment. Environmental Impact Assessment Review, 54: 119-124. https://doi.org/10.1016/j.eiar.2015.06.004
[15] Huang, S.L., Wong, J.H., Chen, T.C. (1998). A framework of indicator system for measuring Taipei’s urban sustainability. Landscape and Urban Planning, 42(1): 15-27. https://doi.org/10.1016/S0169-2046(98)00054-1
[16] Nilsson, K., Pauleit, S., Bell, S., Aalbers, C., Nielsen, T.S. (2013). Peri-urban futures: Scenarios and models for land use change in Europe. Peri-Urban Futures: Scenarios and Models for Land use Change in Europe, Springer-Verlag Berlin Heidelberg, 1-453.
[17] Lützkendorf, T., Balouktsi, M. (2017). Assessing a sustainable urban development: Typology of indicators and sources of information. Procedia Environmental Sciences, 38: 546-553. https://doi.org/10.1016/j.proenv.2017.03.122
[18] Allen, C., Reid, M., Thwaites, J., Glover, R., Kestin, T. (2020). Assessing national progress and priorities for the Sustainable Development Goals (SDGs): Experience from Australia. Sustainability Science, 15(2): 521-538. https://doi.org/10.1007/s11625-019-00711-x
[19] European Commission. (2018). Indicators for sustainable cities. vol. 2015, Brussels, Belgium. https://op.europa.eu/en/publication-detail/-/publication/cbaa6e59-437c-11e8-a9f4-01aa75ed71a1, accessed on Nov. 3, 2020.
[20] UN Habitat. (2013). State of the World’s Cities. Nairobi, Kenya: UN Habitat. https://sustainabledevelopment.un.org/content/documents/745habitat.pdf, accessed on Nov. 3, 2020.
[21] Michalos, A.C. (2014). Sustainability Measurement. Encyclopedia of Quality of Life and Well-Being Research. The Netherlands: Springer, pp. 6496-6496.
[22] Weiland, U., Kindler, A., Banzhaf, E., Ebert, A., Reyes-Paecke, S. (2011). Indicators for sustainable land use management in Santiago de Chile. Ecological Indicators, 11(5): 1074-1783. https://doi.org/10.1016/j.ecolind.2010.12.007
[23] Salem, M., Tsurusaki, N., Divigalpitiya, P., Kenawy, E. (2020). An effective framework for monitoring and measuring the progress towards sustainable development in the peri-urban areas of the greater Cairo region, Egypt. World, 1(1): 1-19. https://doi.org/10.3390/world1010001
[24] Marshall, F., Waldman, L., MacGregor, H., Mehta, L., Randhawa, P. (2008). On the edge of sustainability: Perspectives on peri-urban dynamics. Urban Geography, 29(3): 264-288. https://doi.org/10.2747/0272-3638.29.3.264
[25] James, P., Paul, W. (2014). Urban Sustainability in Theory and Practice. New York: Routledge.
[26] Huang, L., Wu, J., Yan, L. (2015). Defining and measuring urban sustainability: A review of indicators. Landscape Ecology, 30(7): 1175-1193. https://doi.org/10.1007/s10980-015-0208-2
[27] Rahma, H., Fauzi, A., Juanda, B., Widjojanto, B. (2019). Development of a composite measure of regional sustainable development in Indonesia. Sustainability, 11(20): 5861. https://doi.org/10.3390/su11205861
[28] Allen, C., Reid, M., Thwaites, J., Glover, R., Kestin, T. (2020). Assessing national progress and priorities for the Sustainable Development Goals (SDGs): Experience from Australia. Sustainability Science, 15(2): 521-538. https://doi.org/10.1007/s11625-019-00711-x
[29] Panda, S., Chakraborty, M., Misra, S.K. (2016). Assessment of social sustainable development in urban India by a composite index. International Journal of Sustainable Built Environment, 5(2): 435-450. https://doi.org/10.1016/j.ijsbe.2016.08.001
[30] Díaz-Chavez, R. (2006). Measuring sustainability in peri-urban areas: Case study of Mexico City. The Peri-urban Interface: Approaches to Sustainable Natural and Human Resource Use, London, UK: Earthscan, pp. 246-65.
[31] Nallathiga, R., Taneja, S., Gupta, A., Gangal, B. (2018). Sustainability of urban fringe development and management in NCT-Delhi: A case study. In: Mukherjee J. (eds) Sustainable Urbanization in India. Exploring Urban Change in South Asia, Springer, 109-133. https://doi.org/10.1007/978-981-10-4932-3_7
[32] Varkey, A.M., Manasi, S. (2019). A review of peri-urban definitions, land use changes and challenges to development. Urban India, 39(1): 96-111.
[33] La Rosa, D., Geneletti, D., Spyra, M., Albert, C. (2017). Special issue on sustainable planning approaches for urban peripheries. Landscape and Urban Planning, 165: 172-176. https://doi.org/10.1016/j.landurbplan.2017.04.004
[34] Salem, M. (2015). Peri-urban dynamics and land-use planning for the Greater Cairo Region in Egypt. WIT Transactions on the Built Environment, 168: 109-119. https://doi.org/10.2495/SD150101
[35] Ren, X. (2020). Suburbs and urban peripheries in a global perspective. City and Community. https://doi.org/10.1111/cico.12505
[36] Mpofu, G., Darkoh, M.K., Gwebu, T. (2017). Peri-urbanization landuse dynamics: An analysis of evolving patterns and their impacts on Gabane Village, Botswana. GeoJournal, 83: 725-741. https://doi.org/10.1007/s10708-017-9798-3
[37] Westerink, J., Haase, D., Bauer, A., Ravetz, J., Jarrige, F., Aalbers, C.B.E.M. (2013). Dealing with sustainability trade-offs of the compact city in peri-urban planning across European city regions. European Planning Studies, 21(4): 473-497. https://doi.org/10.1080/09654313.2012.722927
[38] Salem, M., Tsurusaki, N., Divigalpitiya, P. (2020). Remote sensing-based detection of agricultural land losses around greater Cairo since the Egyptian revolution of 2011. Land Use Policy, 97: 104744. https://doi.org/10.1016/j.landusepol.2020.104744
[39] Arha, A., Audichya, R., Pant, D.C. (2014). Challenges in the urban and peri-urban transition zones and strategies for sustainable cities: Experiences from selected cities. The Security of Water, Food, Energy and Liveability of Cities, 71-85. https://doi.org/10.1007/978-94-017-8878-6_6
[40] Geneletti, D., La Rosa, D., Spyra, M., Cortinovis, C. (2017). A review of approaches and challenges for sustainable planning in urban peripheries. Landscape and Urban Planning, 165: 231-243. https://doi.org/10.1016/j.landurbplan.2017.01.013
[41] Nilsson, K., Alexander, T., Nielsen, S. (2014). Strategies for sustainable urban development and urban-rural linkages. European Journal of Spatial Development.
[42] Ministry of Housing- Utilities and Urban Communities. (2012). Greater Cairo Urban Development Strategy; Part I: Future Vision and Strategic Directions. Cairo, Egypt: The General Organization for Physical Planning (GOPP).
[43] JICA. (2008). The Strategic Urban Development Master Plan (SDMP) Study for Sustainable Development of the Greater Cairo Region. vol. 1, Ministry of Housing, Utilities and Urban Development.
[44] The World Bank. (2008). Towards an urban sector strategy (Vol. 2). Washington, DC, USA. https://openknowledge.worldbank.org/handle/10986/19487.
[45] Sims, D. (2011). Understanding Cairo. Cairo: The Logic of a City Out of Control. The American University in Cairo Press.
[46] Verma, P., Raghubanshi, A.S. (2018). Urban sustainability indicators: Challenges and opportunities. Ecological Indicators, 282-291. https://doi.org/10.1016/j.ecolind.2018.05.007
[47] Adinyira, E., Oteng-seifah, S., Adjei-kumi, T. (2007). A review of urban sustainability assessment methodologies. International Conference on Whole Life Urban Sustainability and its Assessment, 9(2): 189-212. https://doi.org/10.1016/j.ecolind.2008.05.011
[48] CAPMAS. (2019). Poverty indicators in Egypt. https://www.capmas.gov.eg/Pages/Publications.aspx?page_id=5109&Year=23160, accessed on Nov. 3, 2020.
[49] Li, F., Liu, X., Hu, D., Wang, R., Yang, W., Li, D., (2009). Measurement indicators and an evaluation approach for assessing urban sustainable development: A case study for China’s Jining City. Landscape and Urban Planning, 90(3-4): 134-142. https://doi.org/10.1016/j.landurbplan.2008.10.022
[50] Carraro, C., Cruciani, C., Giove, S., Lanzi, E. (2009). Aggregation and projection of sustainability indicators: A new approach. Methodology, Busan, Korea, pp. 1-11.
[51] Li, Z., Tang, D., Han, M., Bethel, B. (2018). Comprehensive evaluation of regional sustainable development based on data envelopment analysis. Sustainability, 10(11): 3897. https://doi.org/10.3390/su10113897
[52] Lemke, C., Bastini, K. (2020). Embracing multiple perspectives of sustainable development in a composite measure: The Multilevel Sustainable Development Index. Journal of Cleaner Production, 246: 118884. https://doi.org/10.1016/j.jclepro.2019.118884
[53] Kondyli, J. (2010). Measurement and evaluation of sustainable development. A composite indicator for the islands of the North Aegean region, Greece. Environmental Impact Assessment Review, 30(6): 347-356. https://doi.org/10.1016/j.eiar.2009.08.006
[54] Talukder, B., Hipel, K.W., VanLoon, G.W. (2017). Developing composite indicators for agricultural sustainability assessment: Effect of normalization and aggregation techniques. Resources, 6(4): 66. https://doi.org/10.3390/resources6040066
[55] TADAMUN., n.d. Visible Inequality in the Greater Cairo Region: Where the Rich and Poor Live Side-by-Side - Tadamun. http://www.tadamun.co/visible-inequality-greater-cairo-region-rich-poor-live-side-side/?lang=en, accessed on Nov. 3, 2020.
[56] CAPMAS. (2019). National Report for Monitoring Sustainable development Goals in Egypt 2030. Cairo. https://www.capmas.gov.eg/pdf/SDG.pdf?fbclid=IwAR1equ2XA5w0OHxb-zn-6i0gRgfV8zbvpXm-vkGqcibte40YHWlgE3Zyx_U, accessed on Nov. 3, 2020.
[57] TADAMUN. (2016). Planning [In] Justice: Spatial Analysis for Urban Cairo. Cairo. http://www.tadamun.co/wp-content/uploads/2018/09/PlanninginJustice_Final.pdf, accessed on Nov. 3, 2020.
[58] Iwasaki, E., El-Laithy, H. (2013). Estimation of poverty in Greater Cairo: Case study of three ‘unplanned’ areas. African Development Review, 25(2): 173-188. https://doi.org/10.1111/j.1467-8268.2013.12022.x
[59] Salem, M., Tsurusaki, N., Divigalpitiya, P. (2019). Analyzing the driving factors causing urban expansion in the peri-urban areas using logistic regression: A case study of the Greater Cairo Region. Infrastructures, 4(1): 4. https://doi.org/10.3390/infrastructures4010004
[60] Radwan, T.M., Blackburn, G.A., Whyatt, J.D., Atkinson, P.M. (2019). Dramatic loss of agricultural land due to urban expansion threatens food security in the Nile Delta, Egypt. Remote Sensing, 11(3): 1-20. https://doi.org/10.3390/rs11030332
[61] Salem, M., Tsurusaki, N., Divigalpitiya, P. (2020). Land use/land cover change detection and urban sprawl in the peri-urban area of greater Cairo since the Egyptian revolution of 2011. Journal of Land Use Science, 1-15. https://doi.org/10.1080/1747423X.2020.1765425
[62] Hoeltl, A., Brandtweiner, R., Bates, R., Berger, T. (2020). The interactions of sustainable development goals: The case of urban informal settlements in Ethiopia. International Journal of Sustainable Development and Planning, 15(3): 287-294. https://doi.org/10.18280/ijsdp.150304