Yuan Zhai* | Peng Chen
© 2020 IIETA. This article is published by IIETA and is licensed under the CC BY 4.0 license (http://creativecommons.org/licenses/by/4.0/).
OPEN ACCESS
This paper mainly explores the factors affecting the tourist satisfaction with rural homestay inns (RHIs), and offer suggestions to the RHI managers. Firstly, the Word2vec was adopted to extract the features from the online reviews on ctrip.com about the RHIs around Mount Mogan, and to reduce the dimensionality of the extracted features. Then, sentiment analysis was performed to extract the emotions of each class of features, and an econometric model was constructed to disclose the relationship between RHI feature evaluation and tourist satisfaction. The results show that: the tourist satisfaction with RHIs is positively affected by site, appearance, facility, public space, service, individuation, and marketing, especially by service, individuation, and facility; the more the features mentioned in the reviews, the lower the tourist satisfaction. To sum up, this paper clarifies the relationship between the features of RHI reviews and tourist satisfaction from the angle of review text, laying a theoretical basis for the research into the online reputation of RHIs.
rural homestay inns (RHIs), online reviews, sentiment analysis, satisfaction
The earlies online travel agency (OTA) is Expedia, which was founded in 1996. Since then, the concept of OTA has gradually taken shape. Over the years, the OTA has developed into a successful economic model, which provides tourists with cheaper solutions by integrating products and reducing costs [1]. However, there is not yet an official and unified definition of the OTA.
Kim and Lee [2] probed into the OTA earlier than most scholars, and defined the concept as a travel agency offers value-added services to potential consumers via network interfaces. Christodoulidou et al. [3] emphasized that the OTA is a travel agency that earns shares in the travel market by managing hotel room reservations. Phocuswright [4], a tourism research organization, clearly stated that the OTA is a marketing, search and booking tool, which integrates website, mobile devices, apps, and call centers into a platform for consumers to browse and purchase travel products and to share travel information.
To sum up, the OTA is generally recognized as an intermediary that relies on the Internet to provide online services like consultation, review, and reservation. The OTA has changed the purchase model of tourism. To meet the needs of tourists, traditional tourism agencies are competing to enhance the cooperation with the OTA.
In the age of Web 2.0, the boom of e-commerce has turned the user generated content (UGC) of OTA platform users into a major information source of consumers and service providers. The online reviews of the OTA enable potential consumers to make purchasing decisions, and help relevant managers improve the quality of their products or services. Many studies [5, 6] have shown that online reviews can affect the sales and the purchasing decisions of consumers.
The OTA website serves as an important distribution channel for rural homestay inns (RHIs) [7], which first emerged in France in the 19th century. Besides booking rooms, the RHI consumers often rate and comment on their experience on the OTA website right after leaving the RHI. The reviews determine the online reputation of the RHI, and affect the choices of other online consumers.
Facing the fierce market competition and shift in consumption pattern, the RHI industry should analyze the OTA reviews of consumers, and optimize their service quality, in a bid for sustainable development. However, most scholars have only focused on the numerical ratings of online reviews [8]. The numerical ratings alone cannot lead to thorough and accurate evaluation of the UGC, for products and services both have multi-dimensional attributes [9].
The online reviews contain much more reliable information than the star ratings on the OTA website. Besides, the quantitative scoring system of the website cannot reflect some characteristic dimensions that may interest potential users. Therefore, this paper carries out text mining on the online reviews of tourists, and identifies the dimensions of the UGC that truly interest consumers, revealing the true opinions of the RHIs.
The remainder of this paper is organized as follows: Section 2 reviews the relevant literature; Section 3 introduces the research method, including data sources, data preprocessing, Word2vec-based clustering of RHI evaluation dimensions, machine learning (ML)-based feature classification, positioning and extraction of emotional words, and value assignment to emotional words against the emotional word list; Section 4 carries out the descriptive statistical analysis on model variables and discusses the influence of RHI evaluation dimensions on tourist satisfaction; Section 5 puts forward the conclusions.
2.1 RHIs
The RHIs have emerged and evolved along with the tourism mode based on rural tourism and agritainment. The first rural hotels appeared in the 19th century, when French tourists slept over in farmer houses [7]. As China fully implements the strategy of rural revitalization, the RHIs have flourished across the country. According to the Basic Requirements and Evaluation for Homestay Inn (LB/T 065-2019) released by China National Tourism Administration in August 2017, homestay inns refer to the small lodging facilities that provide tourists with a unique experience of the local nature, culture, production method, and lifestyle; the facilities must fully utilize the local featured resources, and their owners must participate in the reception.
For RHIs, it is critical to have a good geographical location and favorable traffic conditions. In addition, a well-operated RHI should meet the following conditions: necessary supporting facilities (e.g. independent toilets) and suitable activity space for consumers; enough rooms to realize operations on the moderate scale; integration into the surrounding natural environment and preserve/highlight the features of traditional culture; mixing agricultural education into sightseeing and entertainment, and providing consumers with high-quality agricultural products; precise market positioning [10, 11]. Due to the limited number of rooms, homestays often do not spend much on marketing. The most common marketing channels for homestays include industry associations, manuals and guides, online publicity, and word-of-mouth publicity. The most important channel is the word-of-mouth publicity [12-14].
2.2 Tourist satisfaction
The concept of consumer satisfaction was created by Cardozo. The relevant research was officially started in the 1970s, the heyday of the concept of consumer first [15]. The early research believes that consumer satisfaction is directly affected by the gap between consumer expectation and perception.
Tourist satisfaction refers to the relative relationship between the early expectation and later perception of tourists for tourism products. This indicator directly bears on the attractiveness and repurchase rate of tourism products [16].
The subsequent research focuses on the impact of perceived quality and other factors on tourist satisfaction. It is generally held that the perceived quality is directly correlated with tourist satisfaction. Tourist satisfaction is more affected by the perceived quality than the gap between expectation and perception [17].
2.3 Impact of review contents on tourist satisfaction
Currently, many methods have been developed to evaluate the effects of lodging industry features on tourist satisfaction based on the review data generated by online users. The bases of these methods mainly include expert opinions, grammar, and model analysis.
The expert-based methods screen and evaluate the hotel features according to the opinions of experts in the hotel field. There are two primary defects with these methods: the expert opinions cannot fully reflect the real experience of consumers; the expert opinions are strongly subjective and biased [18].
The grammar-based methods assume that the importance of a feature is positively correlated with the number of adjective modifiers for the feature word. First, the number of adjective modifiers for each feature word is recognized by syntactic dependence. Then, the adjectives are clustered to obtain the importance of the corresponding feature [19, 20]. The dependence on the number of adjectives greatly limits the applicable scope of this method.
The model-based methods use ML models to learn the feature-target relationship. The learning on massive data prevents the interference of subjective factors, and promotes the universality of these methods [21-23]. For example, Archak et al. [22] relied on a model to explore the influence of emotional polarity on users’ willingness to purchase. However, their model-based method emphasizes emotional polarity over emotional intensity, failing to achieve satisfactory results.
In terms of research method, the previous research mostly resorts to questionnaires or interviews. The two methods are limited in data scale and content richness/objectivity. With the development of social networks, recent years has seen some studies on tourist satisfaction based on consumer reviews [24-26]. These studies managed to set up diverse and refined evaluation indices and a broad data basis, because online reviews are the conscious and spontaneous evaluation of service quality by consumers, and the most direct reflection of consumer experience. However, the outstanding problem is the lack of effective methods to mine the emotional information from the reviews.
To sum up, word-of-mouth is the most common marketing tool for homestays, exerting an obvious impact on tourist satisfaction of homestays [13, 14]. Being an important data source in the big data era, online reviews have been highly recognized for their value in commercial activities like word-of-mouth publicity. Online reviews are the most intuitive, specific, and authentic consumer experience provided by consumers, revealing the contents that concern consumers the most. As a result, online reviews provide a valuable resource for studying the factors affecting consumer satisfaction [27].
Some scholars have investigated tourist satisfaction and online evaluation of homestays. Certain results have been achieved on the satisfaction degree of the lodging industry based on online evaluations. The focus of the current studies includes sentiment analysis on online reviews, and the influencing factors of tourist satisfaction. Overall, the evaluation of hotel service quality is relatively mature, while the evaluation of homestay service quality is severely lacking. The research results on hotel service quality cannot be directly applied to homestay service quality, because homestays pursue personalized development rather than meet the standard of lodging industry.
In view of the above, this paper selects the online reviews of the RHIs on ctrip.com as the targets, mines the factors that affect the RHI satisfaction from the online reviews, and explores how and how much different factors affect the RHI service satisfaction, providing a theoretical basis and operable mode for RHIs to improve tourist satisfaction.
3.1 Data collection
The most popular travel websites in China include ctrip.com, qunar.com, lvmama.com, tuniu.com, and fliggy.com. According to the Quarterly Monitoring Report on China’s Online Travel Market, ctrip.com occupied 48% of the market share of online lodging preservation in the first quarter of 2019, making it the biggest lodging preservation website in China. The online reviews of ctrip.com are very representative, for the website has the largest consumer base and offers the largest number of samples. Besides, a tourist cannot comment about a homestay on the website before he/she checks in, which ensures the credibility of online reviews. Therefore, the LocoySpider (http://www.locoy.com) was adopted to extract the online reviews (January 1-December 25, 2019) on the RHIs around Mount Mogan, Zhejiang province from ctrip.com.
In 2012, Mount Mogan was rated as one of the 45 most visited places in the world in 2012 by Time. It is one of the most famous RHI gathering spots in China. As of July 2019, there were more than 700 homestays around Mount Mogan, offering nearly 10,000 beds. In 2018, the homestays around Mount Mogan received 2.1 million tourists, and achieved an income of RMB 2.05 billion yuan.
After data cleaning, 312,782 online reviews (about 50 million words) were obtained. These reviews were analyzed on Word2vec to generate the vector of each words. Then, 7,324 reviews randomly selected in the calculation model.
3.2 Preprocessing
The short texts collected from the Internet usually contain lots of noise, which hinders the sentiment analysis on these texts. Hence, the texts should be preprocessed before sentiment analysis. In general, text preprocessing includes three steps: word segmentation, part-of-speech (POS) tagging, and stop word removal.
(1) Word segmentation
In linguistics, words, as the smallest independent emotional unit, have rich emotional connotations. The accuracy of word segmentation is the prerequisite for sentiment analysis. Before extracting feature words from the reviews, it is necessary to preprocess the text information. In English, each word is separated by a space. In Chinese, however, there are no fixed spacers (spaces) between words, making word segmentation a necessity before sentiment analysis.
At present, the most frequently-used word segmentation systems for Chinese include the Natural Language Processing & Information Retrieval (NLPIR) system of the Chinese Academy of Sciences, the Fudan NLP word segmentation system of Fudan University, the Language Technology Platform (LTP) of Harbin Institute of Technology, and Paoding Analyzer. Among them, the NLPIR, a.k.a. ICTCLAS2013 is the earliest open-source Chinese word segmentation system. The system was developed based on the multi-layer hidden Markov model. To date, the system has attracted over 200,000 users worldwide, and won numerous awards. Therefore, the NLPIR was selected as the word segmentation tool in our research.
(2) POS tagging
POS describes the role of a word in context, laying the basis for classifying words by their features. There are 14 POSs in modern Chinese, namely, nouns, verbs, auxiliary words, adjectives, adverbs, conjunctions, etc. Based on word segmentation, POS tagging clarifies the POS of each word in the text.
The above-mentioned word segmentation systems can tag POSs after word segmentation. Here, POS tagging is also completed by the NLPIR. Each segmented word was separated by a slash from its POS tag. Take the review “the geographical location is pretty good” for example. The result after word segmentation and POS tagging is “the geographical location/n is/v pretty/adv good/adj”.
(3) Removal of stop words and special symbols
Stop words refer to some meaningless functional words that can be filtered out in natural language processing. Despite their high frequency in the text, these words have no impact on the sentiment analysis of the text. In Chinese, the common stop words include some pronouns, auxiliary words, prepositions, and modal auxiliary words.
In addition, the special symbols were also removed from the text, such as some English characters, numbers, mathematical characters, punctuation marks, emoticons, and special Internet symbols like @, #, and URL.
3.3 Word2vec-based clustering of RHI reviews
Duan et al. [28] extracted frequently occurring nouns in reviews as candidate features of hotels. In this paper, the high-frequency nouns in RHI reviews are obtained through text corpus analysis. As shown in Figure 1, the homestay tourists were mostly concerned about traffic, breakfast, environment, attractions, sanitation, activities, etc.
Figure 1. Word cloud of high-frequency nouns in RHI reviews
Inspired by Hu and Liu [23], the noises were removed from high-frequency words. Specifically, each identified noun was tested by the maximum likelihood ratio. The frequency of the noun in reviews of the related classes (e.g. RHI reviews) was subtracted by that in reviews in unrelated classes (e.g. book reviews). If the likelihood ratio is small, the noun will be removed as an unrated word, that is, noise. Since the likelihood ratio obeys the asymptotic χ2 distribution, the nouns whose threshold is above the p=0.05 were taken as candidate product features. Meanwhile, a group of irrelevant nouns (e.g. homestay and Mount Mogan) were compiled manually, and removed from the candidate nouns. In the end, a total of 44 RHI feature nouns were obtained.
After that, the RHI reviews containing the 50,015,783 words (threads=2, vectors=100, window=12) were processed by Word2vec to obtain the vector of each word. Then, the 44 feature nouns acquired by POS tagging were expressed as vectors. The Euclidean distance between word vectors was defined as the similarity between words.
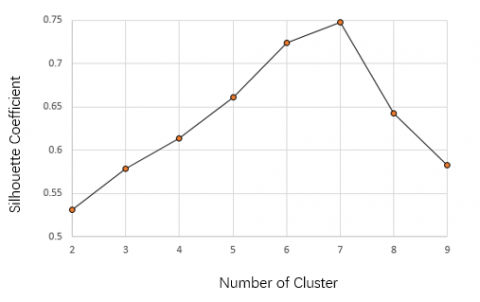
Next, the obtained word vectors were clustered by the k-means clustering (KMC). The clustering quality was evaluated by examining the separation and closeness of clusters with Silhouette Coefficient. The clustering was repeated 10 times, as the number K of clusters increased from 2 to 9. The clustering results are presented in Figure 2 below.
Figure 2. Results on Silhouette Coefficient
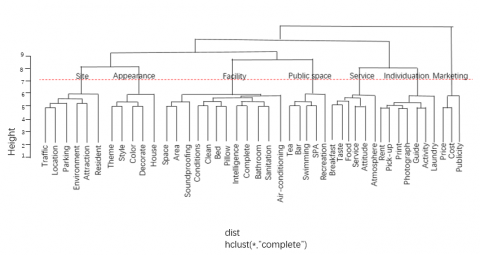
As shown in Figure 2, the Silhouette Coefficient peaked at K=7. By its definition, the greater the Silhouette Coefficient, the better the K value. Then, the dimensionality of spatial vectors was gradually reduced to obtain Figure 3. Through hierarchical clustering, the number of RHI evaluation dimensions was determined as seven: site, appearance, facility, public space, service, individuation, and marketing.
Figure 3. Clustering results of feature nouns for RHI evaluation
3.4 ML-based feature classification
Drawing on the results of Duan et al. [28] and Ganu et al. [29], the objective sentences that do not contain positive or negative emotions were removed, e.g. “my fellow traveler will arrive earlier than me”. Then, the sentences that do not involve evaluations factors were also deleted, e.g. “the tourists to Mount Mogan are advised to choose this inn”. After the removal, a total of 80,000 evaluation units were obtained, with an average word count of 7. Table 1 provides a typical evaluation unit.
The factor class of each evaluation unit was determined by the ML. Both Multinomial I Bayes and support vector machine (SVM) are suitable for the classification. Studies have shown that the SVM can achieve the better classification results [30]. Therefore, this paper uses the SVM to classify all evaluation units.
The SVM is an ML algorithm based on the principle of structural risk minimization [31]. The basic principle of the SVM is to map each vector to a higher-dimensional space, which has a hyperplane with maximum separation. Two parallel hyperplanes parallel are across the hyperplane that separates the data. The hyperplane is divided to maximize the distance between the two parallel hyperplanes. It is assumed that the distance or gap between the parallel hyperplanes is negatively correlated with the total error of the classifier
Table 1. A typical evaluation unit
|
Number |
Assessment Unit |
Number of words |
Factor class |
|
289053 |
The geographical location is pretty good |
6 |
Site |
|
301435 |
The parent-child play room is great |
6 |
Public space |
|
304596 |
High performance cost ratio |
4 |
Marketing |
|
313560 |
The room is in general condition |
6 |
Facility |
|
319890 |
The service is very bad |
5 |
Service |
|
323679 |
The room decoration is special |
5 |
Appearance |
|
334261 |
We can pick up the whole dress for free |
9 |
Individuation |
Recall $=\frac{T P}{T P+F N}$ (1)
Precision $=\frac{T P}{T P+F P}$ (2)
$F=2 \frac{\text {Precision} \bullet \text {Recall}}{\text {Precision}+\text {Recall}}$ (3)
where, TP is the percentage of evaluation units that have been extracted and classified; FN is the percentage of evaluation units that have not been extracted; FP is the percentage of evaluation units that have been classified.
The ML algorithm is implemented in the following process: First, the 80,000 evaluation units were divided into a training set and a test set. In the training set, each evaluation unit has its POS tag. The evaluation units of the training set were taken as the inputs, and the feature classes were defined as the outputs. Through supervised learning, a feature classifier was designed by the ML algorithm. Then, the feature classifier was adopted to identify the class of each evaluation unit in the test set. The classification is considered correct, if the identified classes agree with the actual classes of the evaluation units in the test set, and incorrect if otherwise.
Table 2 shows the classification results of the SVM-based classifier. Obviously, the SVM algorithm reached a high Precision (71.9%), a high Recall (87.3%) and a desirable F-value (0.802).
Table 2. Classification results of the SVM-based classifier
|
Recall (%) |
Precision (%) |
F-Value |
|
87.3 |
71.9 |
0.802 |
3.5 Positioning and extraction of emotional words
Sentiment analysis could be realized by (1) supervised methods, e.g. Ali et al. [32] judged emotional polarity with the SVM and improved fuzzy domain ontology (FDO) method; (2) unsupervised methods, e.g. Hu and Liu [23] relied on unsupervised method to determine the emotional polarity, using multiple clustering algorithms; (3) emotional word dictionary, e.g. Kim et al. [33] conducted sentiment analysis with ROSTEA sentiment dictionary tool.
While feature words are nouns, emotional words contain multiple POSs, particularly adverb and adjective. Based on the location of feature words, a [-s, s] character interval was set up near each feature word as the positioning interval of emotional words. For example, the interval of emotional words near the
In this paper, based on the position of the feature word determined after the comment text is segmented, the [-s, s] character interval is created near the feature word as the emotional word positioning interval. For example, the interval of emotional words for “the geographical location/n is/v pretty/adv good/adj” can be expressed as “pretty/adv good/adj”.
3.6 Matching and value assignment
The extracted words were matched with an emotional word list, and assigned proper values. The review “the geographical location is pretty good” was still taken as the example. The emotional words are behind the feature word: “pretty” is the emotional degree, and “good” is the emotional polarity.
Our RHI emotional word list was prepared from the HowNet emotional word list and NTUSD emotional word list. The words in the list could be expanded manually. Each emotional degree word was rated against a 6-point scale (1 point if no word of degree appears; and 2-5 points if such words appear); each positive emotional word was assigned 2 points, each negative emotional word was assigned -2 points, and each neutral emotional word was assigned 1 point.
The emotional score of each emotional word can be calculated by:
F=w*i
where, w is the score of emotional degree; i is the score of emotional polarity
Table 3. Influencing factors on tourist satisfaction (Part)
|
Number |
Opinion Unit |
Site |
Facility |
Appearance |
Public Space |
Service |
Individuation |
Marketing |
|
289053 |
The geographical location is pretty good |
6 |
0 |
0 |
0 |
0 |
0 |
0 |
|
301435 |
The parent-child play room is great |
0 |
8 |
0 |
0 |
0 |
0 |
0 |
|
304596 |
High performance cost ratio |
0 |
0 |
0 |
0 |
0 |
0 |
1 |
|
313560 |
The room is in general condition |
0 |
1 |
0 |
0 |
0 |
0 |
0 |
|
319890 |
The service is very bad |
0 |
0 |
0 |
0 |
-8 |
0 |
0 |
|
323679 |
The room decoration is special |
0 |
0 |
6 |
0 |
0 |
0 |
0 |
|
334261 |
We can pick up the whole dress for free |
0 |
0 |
0 |
0 |
0 |
2 |
0 |
Take “the geographical location is pretty good” for example. After word segmentation, the review became “the geographical location/n is/v pretty/adv good/adj”. The feature word is “the geographical location”. The emotional degree word “pretty” was given 3 points; the emotional polarity word “good” is positive and was thus assigned 2 points. Hence, the emotional score of this review was 6 in the dimension of site, and 0 in any other dimensions.
After adding up the scores on emotional units in each review, the scores of influencing factors on tourist satisfaction in each dimension were obtained (as shown in Table 3 above).
4.1 Descriptive analysis on model variables
Table 4. Descriptive analysis results on model variables
|
Statistic |
N |
Mean |
St.Dev. |
Min |
Max |
|
Site |
76890 |
1.533 |
0.692 |
-4 |
10 |
|
Appearance |
76890 |
2.478 |
0.836 |
-6 |
8 |
|
Service |
76890 |
2.064 |
0.822 |
-8 |
10 |
|
Public space |
76890 |
1.857 |
0.367 |
-2 |
6 |
|
Facility |
76890 |
1.672 |
0.431 |
-8 |
8 |
|
Individuation |
76890 |
2.674 |
0.562 |
-2 |
10 |
|
Marketing |
76890 |
0.523 |
0.312 |
-4 |
8 |
As shown in Table 4, the emotional expression of tourists was either positive or negative in each dimension. The strongest emotion appeared in the Service dimension, where the minimum value was -8, and the maximum value was 10, that is, the difference between positive and negative was 18. The second strongest emotion appeared in the Facility dimension, where the minimum value was -8, and the maximum value was 8, that is, the difference between positive and negative was 16. The third strongest emotion appeared in Site and Appearance dimensions, whose differences between positive and negative were both 14. Site had greater minimum and maximum values than Appearance. The higher the strength of emotion, the greater the disagreement between evaluations in the dimension.
In terms of mean satisfaction, Individuation scored the highest with 2.674 points, followed by Appearance with 2.478 points, and then Service with 2.064 points. The lowest mean satisfaction (0.523 points) belonged to Marketing. Therefore, the three aspects that best satisfy the tourists of Mount Mogan are Individual, Appearance and Service.
4.2 Effects of RHI evaluation dimensions on tourist satisfaction
Fang and Qu [34] clustered the words in homestay reviews, and extracted the evaluation indices for homestay online reputation, but failed to disclose the intrinsic law of data content. Yang et al. [35] combined domain dictionary and topic mining to analyze the sentiments of homestay reviews, and obtained the positive and negative themes contained in homestay reviews. However, their research only deals with a limited amount of data, and does not consider the semantic relationship between text words.
To overcome the defects of the above research, this paper sorts out and analyzes the online reviews of ctrip.com, summarizes the RHI features that interest consumers, and evaluates their effects on RHI satisfaction. During the analysis, tourist satisfaction was taken as the dependent variable, while site, appearance, facility, public space, service, individuation, marketing, and the number of features in reviews were taken as dependent variables that affect the tourist satisfaction. The regression results are listed in Table 5.
As shown in Table 5, the tourist satisfaction with RHIs is positively affected by dimensions like site, appearance, facility, public space, service, individuation, and marketing. Specifically, the coefficient of service dimension was 0.563 (p=0.698), with an odd ratio (OR) of 1.7559; the coefficient of individuation dimension was 0.455, with an OR of 1.5762; the coefficient of facility dimension was 0.283, with an OR of 1.3271.
The OR reflects how much each unit of growth in an independent variable affects the probability of occurrence. The above results show that service, individuation, and facility had much larger ORs than the other dimensions. This means tourist satisfaction with RHIs is most affected by service quality, followed in turn by individuation and facility, but not greatly affected by appearance and marketing. The number of features in the evaluation text had a negative effect on RHI satisfaction, that is, the more the features in the text, the poorer the tourist satisfaction, and the inverse is also true.
Table 5. Regression results
|
|
Site |
Appearance |
Facility |
Public space |
Service |
Individuation |
Marketing |
Num of feature |
|
correlation coefficient |
0.246*** |
0.084*** |
0.283*** |
0.215*** |
0.563*** |
0.455*** |
0.012*** |
-0.034*** |
|
p |
0.497 |
0.217 |
0.236 |
0.933 |
0.698 |
0.413 |
0.138 |
0.299 |
|
OR |
1.2789 |
1.0876 |
1.3271 |
1.2399 |
1.7559 |
1.5762 |
1.0121 |
|
|
N |
76890 |
|
|
|
|
|
|
76890 |
|
R2 |
0.2653 |
|
|
|
|
|
|
0.4356 |
(Ps.: *p<0.1; **p<0.05; ***p<0.01)
This paper analyzes the text of online evaluations on the RHIs around Mount Mogan from ctrip.com, and summarizes the dimensions of the RHI evaluation: site, appearance, facility, public space, service, individuation, and marketing. Compared with the previous studies [34, 35], this paper performed in-depth mining of text data, created a regression model with sentiment analysis, and discovered that service, individuation, and facility are the leading influencing factors of RHI satisfaction.
In terms of service, breakfast attracted more comments than any other service. It is also the service that most likely to cause dissatisfaction.
In terms of individuation, the personalized services (car rental, laundry, pick-up, printing, photography, etc.) and travel services (route or activity arrangements, booking of scenic spots tickets, free maps, and guide, etc.) add brilliance to homestay experience.
In terms of facility, homestay tourists attach great importance to many aspects of facility, such as the size and sound insulation of the room, the comfort of bedding, the situation of electrical equipment, etc. Good air-conditioning, WI-FI, television, and elevator are essential to creating a comfortable lodging experience. Some homestays provide amusement facilities specifically for children, making tourists very satisfied.
The research results help RHI managers or owners to obtain the highest satisfaction at the lowest cost: the managers/owners should focus on service, individuation, and facility, trying to leave a good first impression and offer an excellent lodging experience to tourists. The future research will compare more reviews on RHIs in different regions, and identify the different interests of their tourists.
[1] Kim, J., Bojanic, D.C., Warnick, R.B. (2009). Price bundling and travel product pricing practices used by online channels of distribution. Journal of Travel Research, 47(4): 403-412. https://doi.org/10.1177/0047287508328658
[2] Kim, W.G., Lee, H.Y. (2005). Comparison of web service quality between online travel agencies and online travel suppliers. Journal of Travel & Tourism Marketing, 17(2-3): 105-116. https://doi.org/10.1300/J073v17n02_09
[3] Christodoulidou, N., Connolly, D.J., Brewer, P. (2010). An examination of the transactional relationship between online travel agencies, travel meta sites and suppliers. International Journal of Contemporary Hospitality Management, 22(7): 1048-1062. https://doi.org/10.1108/09596111011066671
[4] http://www.hospitalitynet.org/news/154000320/4067634.html.
[5] Duan, W., Gu, B., Whinston, A.B. (2008). Do online reviews matter?—An empirical investigation of panel data. Decision Support Systems, 45(4): 1007-1016. https://doi.org/10.1016/j.dss.2008.04.001
[6] Chevalier, J.A., Mayzlin, D. (2006). The effect of word of mouth on sales: Online book reviews. Journal of Marketing Research, 43(3): 345-354. https://doi.org/10.1509/jmkr.43.3.345
[7] Harrison, B. (2005). Tourism, farm abandonment, and the ‘typical’ Vermonter, 1880–1930. Journal of Historical Geography, 31(3): 478-495. https://doi.org/10.1016/j.jhg.2004.03.021
[8] Banerjee, S., Chua, A.Y. (2016). In search of patterns among travelers’ hotel ratings in TripAdvisor. Tourism Management, 53: 125-131. https://doi.org/10.1016/j.tourman.2015.09.020
[9] Jerdee, T.H., Rosen, B. (1974). Effects of opportunity to communicate and visibility of individual decisions on behavior in the common interest. Journal of Applied Psychology, 59(6): 712. https://doi.org/10.1037/h0037450
[10] Monty, B., Skidmore, M. (2003). Hedonic pricing and willingness to pay for bed and breakfast amenities in Southeast Wisconsin. Journal of Travel Research, 42(2): 195-199. https://doi.org/10.1177/0047287503257500
[11] Poorani, A.A., Smith, D.R. (1995). Financial Chanracteristics of Bed-and-Breakfast Inns. Cornell Hotel and Restaurant Administration Quarterly, 36(5): 57-63. https://doi.org/10.1016/0010-8804(95)92251-h
[12] Kaufman, T.J., Weaver, P.A. (1998). Marketing efforts of bed and breakfast operations: Do they influence success? Journal of Travel & Tourism Marketing, 7(4): 61-78. https://doi.org/10.1300/J073v07n04_04
[13] Chen, L.C., Lin, S.P., Kuo, C.M. (2013). Rural tourism: Marketing strategies for the bed and breakfast industry in Taiwan. International Journal of Hospitality Management, 32: 278-286. https://doi.org/10.1016/j.ijhm.2012.07.005
[14] Lee, S.Y., Reynolds, J.S., Kennon, L.R. (2003). Bed and breakfast industries: Successful marketing strategies. Journal of Travel & Tourism Marketing, 14(1): 37-53. https://doi.org/10.1300/J073v14n01_03
[15] Cardozo, R.N. (1964). Customer satisfaction: laboratory study and marketing action. Journal of Marketing Research, 2: 244-249.
[16] Pizam, A., Neumann, Y., Reichel, A. (1978). Dimentions of tourist satisfaction with a destination area. Annals of tourism Research, 5(3): 314-322. https://doi.org/10.1016/0160-7383(78)90115-9
[17] Churchill Jr, G.A., Surprenant, C. (1988). An Investigation into the Determinations of Customer Satisfaction. Journal of Marketing Research, 1(982): 5.
[18] Liu, J., Cao, Y., Lin, C.Y., Huang, Y., Zhou, M. (2007). Low-quality product review detection in opinion summarization. In Proceedings of the 2007 joint Conference on Empirical Methods in Natural Language Processing and Computational Natural Language Learning (EMNLP-CoNLL), pp. 334-342.
[19] Eirinaki, M., Pisal, S., Singh, J. (2012). Feature-based opinion mining and ranking. Journal of Computer and System Sciences, 78(4): 1175-1184. https://doi.org/10.1016/j.jcss.2011.10.007
[20] Abbasi, A., Chen, H., Salem, A. (2008). Sentiment analysis in multiple languages: Feature selection for opinion classification in web forums. ACM Transactions on Information Systems (TOIS), 26(3): 1-34. https://doi.org/10.1145/1361684.1361685
[21] Ganu, G., Kakodkar, Y., Marian, A. (2013). Improving the quality of predictions using textual information in online user reviews. Information Systems, 38(1): 1-15. https://doi.org/10.1016/j.is.2012.03.001
[22] Archak, N., Ghose, A., Ipeirotis, P.G. (2011). Deriving the pricing power of product features by mining consumer reviews. Management Science, 57(8): 1485-1509. https://doi.org/10.1287/mnsc.1110.1370
[23] Hu, M., Liu, B. (2004). Mining and summarizing customer reviews. In Proceedings of the Tenth ACM SIGKDD International Conference on Knowledge Discovery and Data Mining, 168-177. https://doi.org/10.1145/1014052.1014073
[24] Song, B., Lee, C., Yoon, B., Park, Y. (2016). Diagnosing service quality using customer reviews: An index approach based on sentiment and gap analyses. Service Business, 10(4): 775-798. https://doi.org/10.1007/s11628-015-0290-1
[25] Cheng, M., Jin, X. (2019). What do Airbnb users care about? An analysis of online review comments. International Journal of Hospitality Management, 76: 58-70. https://doi.org/10.1016/j.ijhm.2018.04.004
[26] Ban, H.J., Choi, H., Choi, E.K., Lee, S., Kim, H.S. (2019). Investigating key attributes in experience and satisfaction of hotel customer using online review data. Sustainability, 11(23): 6570. https://doi.org/10.3390/su11236570
[27] Floh, A., Koller, M., Zauner, A. (2013). Taking a deeper look at online reviews: The asymmetric effect of valence intensity on shopping behaviour. Journal of Marketing Management, 29(5-6): 646-670. https://doi.org/10.1080/0267257X.2013.776620
[28] Duan, W., Yu, Y., Cao, Q., Levy, S. (2016). Exploring the impact of social media on hotel service performance: A sentimental analysis approach. Cornell Hospitality Quarterly, 57(3): 282-296. https://doi.org/10.1177/1938965515620483
[29] Ganu, G., Kakodkar, Y., Marian, A. (2013). Improving the quality of predictions using textual information in online user reviews. Information Systems, 38(1): 1-15.https://doi.org/10.1016/j.is.2012.03.001
[30] Pang, B., Lee, L., Vaithyanathan, S. (2002). Thumbs up? Sentiment classification using machine learning techniques. arXiv preprint cs/0205070.
[31] Vapnik, V., Vapnik, V. (1998). Statistical learning theory Wiley. New York, 1: 624. https://doi.org/10.1007/978-1-4757-3264-1
[32] Ali, F., Kwak, K.S., Kim, Y.G. (2016). Opinion mining based on fuzzy domain ontology and Support Vector Machine: A proposal to automate online review classification. Applied Soft Computing, 47: 235-250. https://doi.org/10.1016/j.asoc.2016.06.003
[33] Kim, S.M., Hovy, E. (2006). Identifying and analyzing judgment opinions. In Proceedings of the Human Language Technology Conference of the NAACL, Main Conference, pp. 200-207. https://doi.org/10.3115/1220835.1220861
[34] Fang, M., Qu, Y. (2018). Research on the concern degree of online bed & breakfast reputation evaluation based on text review. Areal Research and Development, 5: 22.
[35] Yang, X., Yang, Y.F., Jiao, W. (2020). Sentiment analysis of homestay comments