Hua Ding* | Yanqing Xue | Xingyi Jiang | Xiaonan Li | Wei Zhang
© 2020 IIETA. This article is published by IIETA and is licensed under the CC BY 4.0 license (http://creativecommons.org/licenses/by/4.0/).
OPEN ACCESS
Tourism in China is gradually shifting from sightseeing to recreational tourism. The shift calls for transformation and upgrading of tourism products. Therefore, it is critical to rationalize the spatial distribution of tourist resorts. Targeting 30 national tourist resorts in China, this paper systematically analyzes the spatial distribution of these resorts, using nearest neighbor index (NNI), Gini coefficient, and kernel density estimation (KDE). Besides, a spatial regression model was adopted to identify the influencing factors of the spatial distribution. The results show that: China’s national tourist resorts are mainly concentrated in four hotspots in East, Southwest, South, and Central China; the spatial distribution is strongly influenced by the provincial/regional tourism and capital investment, greatly impacted by infrastructure and economy, and slightly affected by government support and ecological awareness; in the future, China should develop more tourist resorts in the northwest, north and northeast, and set up a multi-core spatial distribution and product system.
China, national tourist resorts, spatial distribution, spatial regression model, influencing factors
The history of tourist resorts can be traced back to the 1930s in Europe. After the end of the WWII, tourism as a global industry flourished thanks to the boom of world economy and the invention of paid holidays. The tourists, no longer satisfied with sightseeing, went on vacations to improve physical and mental health through rest and relaxation. As a result, tourist resorts have sprung up in developed countries of Europe and North America. Over the years, recreational tourism has created a vibrant visitor economy in these countries. Since the 1960s, the studies on tourist resorts have mainly tackled the following aspects: cycle and development process [1-5], types [6-10], environmental impacts [11-23], relevant stakeholders [14-18], management and marketing [19-21].
By contrast, recreational tourism started late in China. The first tourist resorts in the country were developed in 1992. The relevant research mainly explores on the 12 earliest national tourist resorts, from the angles of planning and design [22], tourist satisfaction [23] and marketing strategy [24]. There is no report on the spatial distribution of national tourist resorts.
To make up for the gap, this paper selects 30 national tourist resorts in China as objects, and analyzes their spatial distribution features (e.g. spatial structure and hotspot), using nearest neighbor index (NNI), Gini coefficient, and kernel density estimation (KDE). Besides, a spatial regression model was adopted to identify the influencing factors of the spatial distribution. The research results lay a scientific basis for the reasonable spatial layout and sustainable development of national tourist resorts in China.
2.1 History
In China, the development of tourist resorts can be divided into two phases: the exploratory phase from 1992 to 2008, and the present phase since 2009. In 1992, twelve national tourist resorts were established under the approval of the State Council, in a bid to further open up, attract foreign investment and promote tourism. This marks the first attempt of China to develop recreational tourism. Since then, however, no more tourist resort had been approved for a long time.
In 2009, the Opinions of the State Council on Accelerating the Development of the Tourism (the State Council [2009] 41) were issued, calling for “effectively promoting the construction of national tourist resorts”. The Opinions were followed by a series of documents, namely, the national standard Resort Rating (GB/T 26358-2010) and the Measures for the Management of Tourist Resorts on Different Levels (the National Tourism Administration [2015] 81). Hence, national tourist resorts once again become the focus and highlight of tourism development.
Subsequently, even more policies on tourism were rolled out, including The Outline for National Tourism and Leisure (2013-2020), and the Several Opinions of the State Council on Promoting the Reform and Development of Tourism (the State Council [2014] 31). In 2015, the National Tourism Administration started a new round of evaluation of tourist resorts, aiming to promote the transformation and upgrading of tourism products and satisfy the demand of recreational tourism at home and abroad.
As of December 2019, there are 30 national tourist resorts and 456 provincial tourist resorts across China. In 2018, the 30 national tourist resorts received a total of 96.6754 million tourists, creating a revenue of 62.686 billion yuan. These tourist resorts set a benchmark for all-for-one tourism and excellent travel experience.
2.2 Classification of tourist resorts
According to Resort Rating (GB/T 26358-2010), the natural resources of tourist resorts fall into seven categories: ocean, inland lakes, mountains, ski resorts, forests, hot springs, and grasslands; the human resources of tourist resorts can be divided into five classes: rural areas, traditional settlements, themed sports (i.e. golf and other themed sports in artificial environment), themed entertainment (e.g. horse racing, film cities, and theme parks), and human activities (i.e. traditional customs and intangible heritage with human as the medium).
Considering their main resources and core attractions, the national tourist resorts in China were classified as Figure 1 and Table 1. The classification results show that China’s national tourist resorts belong to seven types. The top four types are inland lakes (9 tourist resorts, 30%), hot springs (5 tourist resorts, 20%), mountains (6 tourist resorts, 16.67%) and ocean (4, 13.33%).
Table 1. Classification of national tourist resorts in China
|
Type of resources |
Tourist resorts |
Type of resources |
Tourist resorts |
|
Inland lakes (9) |
Tianmu Lake, Jiangsu |
Ocean (4) |
Phoenix Island (Qingdao), Shandong |
|
YCH Peninsula, Jiangsu |
Haiyang, Shandong |
||
|
Dongqian Lake, Zhejiang |
Penglai, Shandong |
||
|
Xianghu Lake, Zhejiang |
Yalong Bay, Hainan |
||
|
Taihu Lake (Huzhou), Zhejiang |
Hot springs (5) |
Tangshan Hot Spring, Jiangsu |
|
|
Fuxian Lake, Yunnan |
Bantang Hot Spring, Anhui |
||
|
Yangzhonghai Lake, Yunnan |
Mingyueshan Hot Spring, Jiangxi |
||
|
Taiji Lake, Hubei |
Yaoshan Hot Spring, Henan |
||
|
Qionghai Lake, Sichuan |
Huitang Hot Spring, Hunan |
||
|
Mountains (6) |
Yangxian, Jiangsu |
Mountains and inland lakes (Mixed) (2) |
Yulong River, Guangxi |
|
Lingfeng Mountain, Zhejiang |
Chishui River Valley, Guizhou |
||
|
Xiannv Mountain, Chonqing |
Themed entertainment (2) |
OCT East, Guangdong |
|
|
Qingcheng Mountain, Sichuan |
Bavaria Manor, Guangdong |
||
|
Changbai Mountain rt, Jilin |
Traditional settlements (2) |
Xishuangbanna, Yunnan |
|
|
Guling Mountain, Fujian |
Lulang International Tourist Town, Tibet |
Figure 1. Distribution of different types of national tourist resorts in China
The vector map data were collected from National Geomatics Center of China (NGCC). The point, line and area layers were all projected in the GCS_WGS_1984 Coordinate system. The latitudes and longitudes were obtained by Google Earth, creating a database of geospatial attributes. The spatial distribution maps of national tourist resorts were generated on ArcGIS 10.2.
3.1 Provincial, regional and altitude distributions
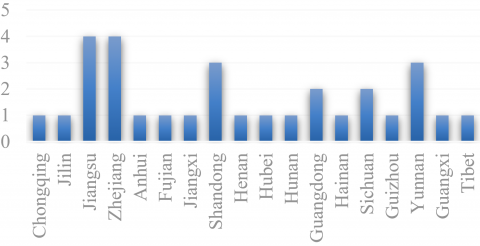
As shown in Figure 2, the national tourist resorts of China are distributed across 18 provincial administrative regions (hereinafter referred to as provinces). Among them, Jiangsu and Zhejiang have the largest number (4), followed by Shandong (3) and Yunnan (3), Guangdong (2) and Sichuan (2), and Chongqing (1), Jilin (1), Anhui (1), Fujian (1), Jiangxi (1), Henan (1), Hubei (1), Hunan (1), Guizhou (1), Hainan (1), Guangxi (1) and Tibet (1). There is no national tourist resort in any of the other 16 provinces.
In terms of geographical regions [25], the national tourist resorts in China are distributed in East China, Southwest China, South China, Central China, and Northeast China. East China has the most national tourist resorts (14), and Northeast China has the fewest (1). No national tourist resort exists in Northwest China and North China (Table 2).
Figure 2. Provincial distribution of national tourist resorts
Table 2. Regional distribution of national tourist resorts
|
Geographical regions |
Provincial distribution |
Type of national tourist resort |
|
East China (14) |
Zhejiang (4) Jiangsu (4) Shandong (3) Anhui (1) Jiangxi (1) Fujian (1) |
Mountains (3) Ocean (3) Hot springs (3) Inland lakes (5) |
|
Southwest China (8) |
Yunnan (3) Sichuan (2) Guizhou (1) Chongqing (1) Tibet (1) |
Mountains (2) Inland lakes (3) Mixed (1) Traditional settlements (2) |
|
South China (4) |
Guangdong (2) Hainan (1) Guangxi (1) |
Ocean (1) Mixed (1) Themed entertainment (2) |
|
Central China (3) |
Henan (1) Hubei (1) Hunan (1) |
Hot springs (2) Inland lakes (1) |
|
Northeast China (1) |
Jilin (1) |
Mountains (1) |
|
North China (0) |
—— |
—— |
|
Northwest China (0) |
—— |
—— |
(Note: Geographically, China can be divided into Northeast China, North China, East China, Central China, South China, Southwest China and Northwest China).
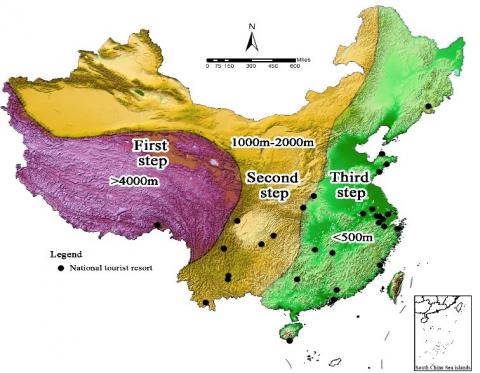
Based on altitude (Figure 3), the national tourist resorts in China are mostly distributed on the second and third steps. On the second step, 7 national tourist resorts dot Sichuan Basin, Eastern Yunnan Plateau and Hubei-Chongqing-Hunnan Mountains; on the third step, 22 national tourist resorts are located in Changbai Mountains, Funiu Mountains, Nanyang Basin, Yangtze-Huai River Plain, Yangtze River Delta Plain, Dongting Lake Plain, Pearl River Delta Plain, Lingnan Hills and Southeastern Hills. Overall, the national tourist resorts are scattered in hills and mountains, and concentrated in plains and basins.
Figure 3. Altitude distribution of national tourist resorts
3.2 Spatial structure
The spatial structure of national tourist resorts in China was analyzed by NNI, Gini coefficient and spatial Lorentz curve.
The NNI refers to the mutual proximity of point-like elements in a specific space. The mean nearest neighbor distance (NND) $\overline{r_i}$ of a space equals the average of the NNDs of all points in that space. If the points are randomly distributed, the NND is the theoretical NND $\overline{r_i}$ [26-28]:
$\overline{r_{E}}=\frac{1}{2 \sqrt{n / A}}=\frac{1}{2 \sqrt{D}}$ (1)
where, A is the area of the space; n and D are the number and density of national tourist resorts respectively. The NNI R is the ratio of the mean NND to the theoretical NND:
$R=\frac{\overline{r_i}}{r_{E}}$ (2)
If R>1, the point elements tend to be uniformly distributed; if R=1, the point elements tend to be randomly distributed; if R<1, the point elements tend to be concentrated in local areas.
Here, national tourist resorts are abstracted as point-like elements, and the NNI is calculated on ArcGIS 10.2. The straight-line distance between two points was computed as Euclidean distance. Through the calculation, the mean NND $\overline{r_i}$ was 174.85 km, the theoretical NND $\overline{r_E}$ was 225.15km, and the NNI R=0.776593<1. The results show that national tourist resorts in China are concentrated in local areas.
The Gini coefficient is often used to measure the distribution difference and change law of point-like elements in the geographic space. The measurement is more contrastive and convincing by the comparison with distribution average degree from Lorentz curve of space [29]. The Gini coefficient Gini can be defined as:
$H=-\sum_{i=1}^{N} p_{i} \ln p_{i}$
$H_{m}=\ln N \quad G_{i n i}=H / H_{m}$ (3)
$C=1-G_{i n i}$
where, C is the distribution uniformity; Pi is the percentage of the number of national tourist resorts in a province/region out of the total number of national tourist resorts; N is the number of regions. The $G_{i n i} \in[0,1]$ is positively correlated with concentration, and negatively with C.
On the provincial level, it can be calculated that Gini =0.7712 and C=0.2288. Hence, national tourist resorts are concentrated in local areas, and non-uniformly distributed. The provincial Lorenz curves (Figure 4) indicate that most (60%) national tourist resorts belong to Jiangsu, Zhejiang, Shandong, Yunnan, Guangdong and Sichuan. Thus, the distribution of national tourist resorts in China is extremely unbalanced.
Figure 4. Provincial Lorenz curves of national tourist resorts in China
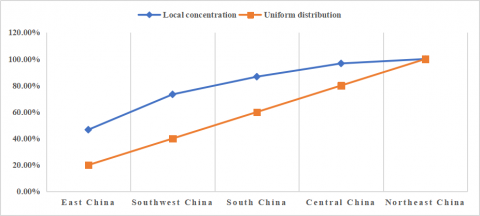
Figure 5. Regional Lorenz curves of national tourist resorts in China
On the regional level, it can be calculated that Gini =0.6786 and C=0.3214, indicating that national tourist resorts are concentrated in local areas, and non-uniformly distributed. The regional Lorenz curves (Figure 5) reveal that most (73.33%) national tourist resorts are concentrated in East and Southwest China, while none exists in North and Northwest China. There is a great regional difference in the distribution of national tourist resorts.
3.3 Hotspots of spatial distribution
The KDE was selected to determine the hotspots in the spatial distribution of China’s national tourist resorts. The KDE algorithm can automatically search for the hotspots of event distribution, and measure the change of event density based on complex distance attenuation. The geographic information system (GIS)-based KDE mainly computes and outputs the point or linear density of each grid with the aid of a moving window. This method visually displays the point elements on a map, and then identifies the hotspot of point distribution in the space. Events are more likely to occur in an area with a high point density, and such an area tends to have a dark color.
Let x1, x2,...xi,...xn be independent and identically distributed samples extracted from the distribution density function as a population. Then, the Parzen–Rosenblatt kernel density fn(x) at point x can be expressed as [30]:
$f_{n}(x)=\frac{1}{n h} \sum_{i=1}^{n} k\left(\frac{x-x_{i}}{h}\right)$ (4)
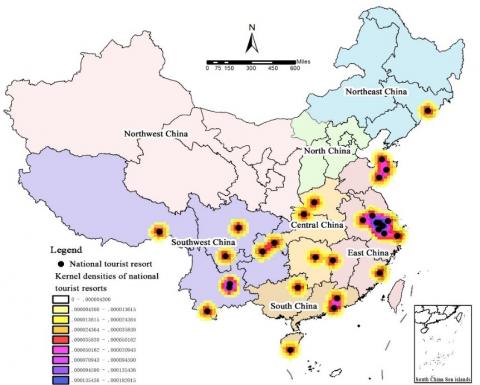
According to the kernel densities (Figure 6), there are four hotspots in the spatial distribution of national tourist resorts in China: the Yangtze River Delta (northern Zhejiang and southern Jiangsu) in East China, the minority settlement area in South China (central Yunnan), the Yellow River Delta (Jiaodong peninsula) in East China, and the Pearl River Delta (central Guangdong) in South China.
Figure 6. Kernel densities of national tourist resorts
4.1 Background
There are two distinct features of the spatial distribution of national tourist resorts in China.
(1) National tourist resorts are concentrated in local areas, showing an extremely unbalanced distribution. From the provincial perspective, 60% of all national tourist resorts belong to only six provinces. Jiangsu and Zhejiang boast the largest concentration of national tourist resorts. There is no national tourist resort in economically developed provinces like Beijing and Shanghai, not to mention other provinces like Tianjin, Hebei, Shanxi, Liaoning, Heilongjiang, Shaanxi, Gansu, Qinghai, Inner Mongolia, Ningxia, and Xinjiang. From the regional perspective, 73.33% of national tourist resorts are concentrated in East and Southwest China, while only a few exist in western and northern regions.
(2) There is a dislocation between national tourist resorts and regional resources. China is generally a mountainous country. Most mountains are located in West and Central China. However, mountain tourist resorts are concentrated in East China, and mixed tourist resorts are distributed in South China (Guizhou and Guangxi). Besides, most hot springs in China lie in South China (Fujian and Guangdong) and Southwest China (Sichuan and Tibet), but hot spring tourist resorts are mainly situated in Central China. Despite a 18,000km-long coastline, ocean tourist resorts in China appear at the two ends of the coastline (Shandong Peninsula and Hainan Island).
Globally speaking, the dominant types of tourist resorts are ski resorts and oceanic (Mediterranean coast, Caribbean coast, Southeast Asia and South Asia). By contrast, most national tourist resorts in China belong to the category of inland lakes.
Therefore, regional resources are not the only consideration before setting up a national tourist resorts in China. It is very meaningful to check if the spatial distribution of national tourist resorts is correlated with other factors (e.g. terrain, economy, infrastructure, tourism, and government support), and evaluate the degree of correlation.
4.2 Analysis on influencing factors
4.2.1 Modelling
Multiple regression was adopted to identify the factors affecting the provincial/regional proportion of national tourist resorts and their contributions. The traditional regression model overlooks the correlation effect between units. To improve the fitting results, the spatial effect was introduced to the traditional econometric model. The popular spatial econometric models include spatial lag model (SLM) and spatial error model (SEM).
The SLM, also known as. spatial autoregressive model, can be expressed as:
$y=\rho W_{y}+X \beta+\varepsilon$ (5)
where, y is the dependent variable; X is the independent variable; ρ is the spatial regression coefficient, which measures the degree of spatial interaction between observations; β is the parameter vector; W is the spatial weight matrix constructed by the adjacency principle; ε is the white noise.
The SEM mainly measures the impact of random errors from other units on the observations:
$y=X \beta+\varepsilon ; \varepsilon=\lambda \beta+\mu$ (6)
where, ε is regression residual vector; W is the spatial weight matrix constructed by the adjacency principle; λ is the autoregressive coefficient to measure the spatial dependence of observations.
4.2.2 Variable selection
In this paper, the provincial/regional proportion of national tourist resorts y is calculated by:
$y=N_{i} / N_{t}$ (7)
where, Ni is the number of national tourist resorts in the i-th province/region; Nt is the total number of national tourist resorts.
Then, the set of all influencing factors can be defined as: X={Hi,Ei,Fi,Ti,A i,C i,Gi}, where H is terrain (altitude); E is economy (per capita GDP); F is infrastructure (mileage of expressways, national highways and provincial highways); T is tourism (annual tourism income); A is ecological awareness (annual ecological expense); C is capital investment (annual tourism investment); G is government support (the number of policies on tourism and tourist resorts issued by local government).
4.2.3 Data sources
The data on the variables of each province/region were collected and sorted out from the following sources: The altitude data were downloaded from the database of geospatial attributes based on Google Earth; the economic data were acquired from China Statistical Yearbook 2018, China Statistical Yearbook on Science and Technology 2018, The Yearbook of China Tourism Statistics 2018, the CEInet Statistics Database, and the official websites of provincial bureau of statistics. The data on each province/region were derived from the mean value of each province.
4.2.4 Results analysis
Formulas (6) and (7) were regressed separately, and the results were recorded. As shown in Table 3, the SEM outperformed the SLM in the value of regression coefficient and significance. Thus, the SEM is more convincing than the latter.
Four conclusions can be drawn from the data in Table 3: First, provincial/regional tourism and capital investment have greater impacts on the spatial distribution of national tourist resorts in China than other variables. The regression coefficients of the two factors were 0.943 and 0.9113, both passing the 1% significance level. Therefore, national tourist resorts tend to cluster in the provinces/regions that have developed tourism well and invested heavily on this industry. In 2018, the following provinces in China earned over 1 trillion yuan from tourism: Guangdong (1.36 trillion), Jiangsu (1.32 trillion), Shandong (1.05 trillion), Sichuan (1.01 trillion), and Zhejiang (1.00 trillion). These provinces respectively own 2, 4, 3, 2 and 4 national tourist resorts. Moreover, the provinces that earned between 0.8 and 1 trillion (Guizhou, Yunnan, Hunan, Jiangxi, and Henan) have a total of 7 national tourism resorts. There are 22 national tourist resorts in the top ten provinces in terms of tourism income, and 28 in the top twenty provinces. Meanwhile, the vitality and investment of tourism capital are extremely important, for national tourism resorts need largescale funds to invest in high-quality facilities, environment, hotels, and recreational projects.
Table 3. Regression results on the influencing factors of provincial/regional spatial distribution
|
Variables |
SLM |
SEM |
|
Landform (H) |
-0.0895(0.7966) |
-0.0914(0.8456) |
|
Economy (E) |
0.814**(0.0104) |
0.859***(0.0100) |
|
Infrastructure (F) |
0.852***(0.0081) |
0.877***(0.0095) |
|
Tourism (T) |
0.928***(0.0011) |
0.943***(0.0018) |
|
Ecological awareness (A) |
0.653*(0.0796) |
0.688*(0.0875) |
|
Capital investment (C) |
0.9001***(0.0069) |
0.9113***(0.0081) |
|
Government support (G) |
0.239**(0.0200) |
0.254**(0.0120) |
Note: The bracketed values are p-values; ***, ** and * are the significance levels of 1%, 5% and 10%, respectively.
Second, provincial/regional infrastructure and economy exert relatively high influence on the spatial distribution of national tourist resorts in China. The regression coefficients of the two factors were 0.877 and 0.859, both passing the 1% significance level. The development of national tourist resorts relies on the tourists with high per capita consumption. The provinces/regions with convenient infrastructure (e.g. transport facilities) and high per capita disposable income could provide a large group of potential consumers. That is why about 2/3 of all national tourist resorts are in economically developed city clusters, such as the Yangtze River Delta city cluster, the Shandong Peninsula city cluster, the central Guizhou city cluster, and the central Yunnan city cluster.
Third, government support and ecological awareness have a certain impact on the spatial distribution of national tourist resorts in China.
Fourth, the landform has little to do with the spatial distribution of national tourist resorts in China.
5.1 Develop more national tourist resorts in Northwest, North and Northeast China
There is a common law in tourism: the area of recreational tourism will dawn, once the per capita GDP surpasses 3,000 USD. In 2018, China was standing on the threshold to that era, as the per capita GDP reached 9,732 USD (64,644 RMB). Thus, it is imperative to optimize the spatial distribution of national tourist resorts, and satisfy the new demand of tourists.
Our research shows the imbalance in the spatial distribution of China’s national tourist resorts. To catch up with other regions, more national tourist resorts should be developed in Northwest, North and Northeast China. These regions enjoy excellent resources like grasslands, ethnic customs, as well as ice and snow. These resources should be fully utilized by attracting tourism capital, improving infrastructure, and stepping up government support. The national tourist resorts in these regions should be developed in synergy with national strategies, such as the Silk Road Economic Belt, the coordinated development of Beijing-Tianjin-Hebei region, and the All-around rejuvenation of Northeast China.
5.2 Construct a multi-core spatial distribution and product system
China has been operating national tourist resorts for 17 years. However, there is not yet a well-connected spatial network of national tourist resorts. The existing national tourist resorts cannot fully demonstrate the provincial/regional features of vacation resources. For instance, there are only 6 mountain tourist resorts and 4 oceanic tourist resorts, although 43% of the country is covered by mountains and over 11,000 islands are off the 18,000km-long coastline. Many mountains and islands have not been well utilized. Similarly, China only has two themed entertainment tourist resorts, and two traditional settlement tourist resorts.
In the future, different provinces/regions should strengthen cooperation and exchanges, and cultivate tourist resorts around city clusters with high per capita GDP and active capital markets, forming a multi-core spatial distribution and product system. The possible themes of the future resorts include ski resorts, rural areas, traditional settlements, themed sports, study travel and camping.
The spatial distribution of national tourist resorts in China is critical to the design of the future supply system for recreational tourism. Our research shows that China’s national tourist resorts have developed through two phases. Most of them belong to categories like inland lakes, mountains, hot springs and ocean. These resorts are mainly concentrated in four hotspots in East, Southwest, South, and Central China. The spatial distribution is greatly affected by the provincial/regional tourism, capital investment and other factors. The research results lay a scientific basis for the reasonable spatial layout and sustainable development of national tourist resorts in China.
This work is supported by Social Science Fund for Research Project on Major Theoretical and Practical Problems in Shaanxi Province, China, 2019 (Grant No. 2019Z198) and Special Fund of Basic Research and Operating Expenses for Central Universities, Chang’an University (Special Research on Tourist Resorts).
[1] Debbage, K.G. (1990). Oligopoly and the resort cycle in the Bahamas. Annals of Tourism Research, 4(17): 513-527. https://doi.org/10.1016/0160-7383(90)90024-L
[2] Agarwal, S. (2002). Restructuring seaside tourism: the resort lifecycle. Annals of Tourism Research, 29(1): 25-55. https://doi.org/10.1016/S0160-7383(01)00002-0
[3] Priestley, G., Mundet, L. (1998). The post-stagnation phase of the resort cycle. Annals of Tourism Research, 1(25): 85-111. https://doi.org/10.1016/S0160-7383(97)00062-5
[4] Papatheodorou, A. (2004). Exploring the evolution of tourism resorts. Annals of Tourism Research, 31(1): 219-237. https://doi.org/10.1016/j.annals.2003.10.004
[5] Ahn, J., Back, K.J. (2018). Integrated resort: a review of research and directions for future study. International Journal of Hospitality Management, 69: 94-101. https://doi.org/10.1016/j.ijhm.2017.10.017
[6] Garcia-Ayllon, S. (2015). Geographic information system (GIS) analysis of impacts in the tourism area life cycle (TALC) of a Mediterranean resort. International Journal of Tourism Research, 18(2): 186-196. https://doi.org/10.1002/jtr.2046
[7] Poczobut, J. (2016). Revitalization of Sopot-the seaside spa town in Poland. Procedia Engineering, 161: 2036-2039. https://doi.org/10.1016/j.proeng.2016.08.799
[8] Dryglas, D., Salamaga, M. (2018). Segmentation by push motives in health tourism destinations: a case study of Polish spa resorts. Journal of Destination Marketing & Management, 9(9): 234-346. https://doi.org/10.1016/j.jdmm.2018.01.008
[9] Agarwal, S., Jakes, S., Essex, S., Page, S.J., Mowforth, M. (2018). Disadvantage in English seaside resorts: A typology of deprived neighborhoods. Tourism Management, 69: 440-459. https://doi.org/10.1016/j.tourman.2018.06.012
[10] Favre-Bonte, V., Gardet, E., Thevenard-Puthod, C. (2019). The influence of territory on innovation network design in mountain tourism resorts. European Planning Studies, 27(5): 1035-1057. https://doi.org/10.1080/09654313.2019.1588856
[11] Domroes, M. (1993). Maldivian tourist resorts and their environmental impact. Tourism vs Environment: The Case for Coastal Areas. Springer Netherlands, 26: 69-82. https://xs.scihub.ltd/https://doi.org/10.1007/978-94-011-2068-5_6
[12] Kovač-Andrić, E., Gvozdić, V., Herjavić, G., Muharemović, H. (2013). Assessment of ozone variations and meteorological influences in a tourist and health resort area on the island of Mali Lošinj (Croatia). Environmental Science and Pollution Research, 20(8): 5106-5113. https://xs.scihub.ltd/https://doi.org/10.1007/s11356-013-1484-5
[13] Cowburn, B., Moritz, C., Birrell, C., Grimsditch, G., Abdulla, A. (2018). Can luxury and environmental sustainability co-exist? Assessing the environmental impact of resort tourism on coral reefs in the Maldives. Ocean & Coastal Management, 158: 120-127. https://doi.org/10.1016/j.ocecoaman.2018.03.025
[14] Omar Abedalla, A., Ra'ed, M., Omar, J., Ali, A.M., Randa, H. (2018). The impact of customer relationship management on tourist satisfaction: the case of Radisson Blue Resort in Aqaba City. Journal of Environmental Management & Tourism, 9(26): 227-240. https://doi.org/10.14505/jemt.v9.2(26).02
[15] Mirek, J. (2016). Analysis of tourist traffic implemented in health resort "wieliczka" salt mine under health tourism. Ekonomiczne Problemy Turystyki, 3: 223-236.
[16] Carvache-franco, W., Carvache-franco, M., Carvache-franco, O., Hernández-Lara, A.B. (2019). Segmentation of foreign tourist demand in a coastal marine destination: The case of Montañita, Ecuador. Ocean & Coastal Management, 167: 236-244. https://doi.org/10.1016/j.ocecoaman.2018.10.035
[17] Valjarević, A., Vukoičić, D., Valjarević, D. (2017). Evaluation of the tourist potential and natural attractivity of the Lukovska Spa. Tourism Management Perspectives, 22: 7-16. https://doi.org/10.1016/j.tmp.2016.12.004
[18] Page, S.J., Hartwell, H., Johns, N., Fyall, A., Ladkin, A., Hemingway, A. (2017). Case study: wellness, tourism and small business development in a UK coastal resort: Public engagement in practice. Tourism Management, 60: 466-477. https://doi.org/10.1016/j.tourman.2016.12.014
[19] Hącia, E. (2016). The impact of tourist traffic on the functioning of Polish seaside health resorts. Transportation Research Procedia, 16: 110-121. https://doi.org/10.1016/j.trpro.2016.11.012
[20] Retama, I., Sujitha, S.B., Rivera, D.M., Shruti, V.C., Rodríguez-Espinosa, P.E., Jonathan, M.P. (2019). Evaluation and management strategies of tourist beaches in the Pacific Coast: A case study from Capulco and Huatulco, Mexico. Coastal Management. Academic Press, 79-93. https://doi.org/10.1016/B978-0-12-810473-6.00007-8
[21] Hanna, P., Font, X., Scarles, C., Weeden, C., Harrison, C. (2018). Tourist destination marketing: From sustainability myopia to memorable experiences. Journal of Destination Marketing & Management, 9: 36-43. https://doi.org/10.1016/j.jdmm.2017.10.002
[22] Yang, H. (2018). Planning and construction conception of forest tourism resorts. Tourism Overview (second half), 3: 39-40.
[23] Bi, Y.X., Yang, J.D. (2018). Investigation and research on tourist satisfaction in Yangzonghai tourist resort. Education and Teaching Forum, 47: 86-87.
[24] Cheng, H. (2008). Research on marketing strategy of Taiwu Ski resort. Beijing Sport University.
[25] Zhao, J. (1995). Natural geography of China. Beijing: Higher Education Press.
[26] Zhao, L.Q., Li, Y., Wang, Z.N. (2019). Analysis on the characteristics of network spatial structure and influencing factors of Chinese urban agglomerations. Statistics and Decision, 35(14): 87-90.
[27] Li, S.T., Hou, Y.Z. (2004). Mainland China: dividing into 8 socio-economic regions. Theor etical Reference, 7: 10-12, 22. https://doi.org/CNKI:SUN:CKLL.0.2004-07-006
[28] Wang, W.W. (2016). Study on the spatial structure of Chinese class a desert tourism scenic spot. Lanzhou University.
[29] Sun, T. (2018). Research on the correlation between the spatial distribution of high-A tourist attractions in Shaanxi province and the development of regional industrial economy. Chang'an University.
[30] Dai, H., Ding, H., Gou, Q.Q., Li, X.N. (2018). Spatial structure characteristics and location optimization of self-driving camps in Shaanxi province. China Journal of Highway and Transport, 31(11): 205-213.