Sunil K. Amrutkar* | Prashant B. Nehe
© 2026 The authors. This article is published by IIETA and is licensed under the CC BY 4.0 license (http://creativecommons.org/licenses/by/4.0/).
OPEN ACCESS
Methanol steam reforming (MSR) is a potential method for hydrogen generation with sustainability. However, determination of optimum operation parameters represents a difficult task due to the simultaneous impacts of many process parameters on hydrogen (H2) production and Carbon Monoxide (CO) generation. In this work, an approach combining the Aspen Plus–RGibbs reactor model with response surface methodology (RSM) was proposed for the optimization of MSR in thermodynamic equilibrium. For developing quadratic response models for methanol conversion, hydrogen yield, hydrogen selectivity, and CO selectivity, a central composite design (CCD) and analysis of variance (ANOVA) were used. The developed models attained significant R² values for hydrogen yield (0.9973), hydrogen selectivity (0.9957), and CO selectivity (0.9778). The optimum equilibrium conditions at 200 ℃, 1.013 bar, and a steam-to-methanol ratio (SCR) of 3.0 resulted in higher methanol conversion (99.994%), with a hydrogen yield of 99.79%, hydrogen selectivity of 74.96%, and CO selectivity of 0.622%. The comparison with case studies confirmed the consistency in quantitative and qualitative terms, supporting the use of the Aspen Plus–RGibbs–RSM approach in equilibrium analysis and operating condition optimization of MSR.
Aspen Plus, hydrogen production, methanol steam reforming, thermodynamic equilibrium, response surface methodology, RGibbs, optimization
The world’s energy demand is on an upward trend owing to industrialization, population explosion, and technological evolution. On the other hand, environmental threats and the shortage of fossil fuels have hastened the shift towards the development of sustainable and renewable energy systems [1]. In recent years, studies on sources of renewable energy like solar energy, wind power, hydroelectricity, and biomass energy have increased extensively, but they have certain drawbacks like intermittency, geographical dependency, use of land, or storage problems [2]. Therefore, the search for efficient energy carriers that can store and transmit energy has become an important area of study. The hydrogen energy carrier has gained prominence as it can be sourced from several feedstocks, stored for prolonged periods of time, transmitted efficiently, and also utilized to produce electrical energy without releasing greenhouse gases in fuel cell systems [3].
In the current era, about 98% of the world’s hydrogen (H2) is produced from fossil fuels via methods like partial oxidation, steam reforming, and autothermal reforming, etc. [4]. Though these techniques are proven, they are inefficient due to large amounts of carbon emissions and heavy reliance on non-renewable resources. Hence, many studies nowadays concentrate more on developing methods incorporating low-carbon or renewable feedstocks to generate clean hydrogen from alternative sources [5]. Among different types of hydrogen-rich fuels, attention is given to methanol because it contains no carbon–carbon bonds and has a high hydrogen-to-carbon ratio (4:1), low sulfur content, a relatively low reforming temperature (200–300 ℃), and convenient storage and transportation characteristics [6]. In addition, methanol can be produced through the use of renewable sources like syngas derived from biomass and carbon dioxide (CO2), which provides an excellent energy carrier for sustaining hydrogen production [7].
There exist various ways through which hydrogen can be produced from methanol using different catalysts, such as methanol decomposition, methanol steam reforming (MSR), oxidative steam reforming, and partial oxidation [8]. The most promising technique is MSR, offering high hydrogen yields at lower temperatures. Unfortunately, there are several other reactions in addition to the main reforming reaction, such as the decomposition of methanol as well as reactions of reverse water-gas shift (WGS), leading to the formation of methane and carbon monoxide (CO) as well as carbon deposition. They have negative impacts on hydrogen purity, affecting hydrogen in fuel cell technologies. Therefore, it is important to define optimum conditions for hydrogen production, reducing undesired products to achieve productive reformer design and operation [9].
Thermodynamic equilibrium modeling has demonstrated a successful approach to the simulation of MSR with no need for detailed reaction-kinetic characteristics [10]. Aspen Plus software is capable of predicting the distribution of equilibrium products by Gibbs free-energy minimization as well as analyzing the impact of various operating conditions, including temperature, pressure, and steam-to-methanol ratio (SCR) [11]. Various aspects of MSR have been explored by researchers in previous investigations. Nehe et al. [12] conducted research on the behavior of an internally heated tubular packed-bed reformer, and Nehe and Kumar [13] studied hydrogen production in a single-channel reformer with cavities. While the Gibbs free energy minimization approach used by Özcan and Akın [14] included response surface methodology (RSM) to optimize the MSR, Achomo et al. [15] focused on thermodynamic as well as exergy features of the reaction. The research conducted proves the importance of optimization along with equilibrium assessment and reactor modeling to understand MSR behavior.
Nevertheless, the different studies vary widely with respect to modeling purposes, operating conditions, reactor designs, and validation approaches [16, 17]. While some studies place emphasis on equilibrium product distributions, other studies may focus on reactor performance, exergy analysis, or optimization studies [18, 19]. There is thus a need for a systematic approach that links equilibrium prediction, multiple response optimization, analysis of parameter interaction, and comparison with selected literature cases. The inclusion of methanol conversion, hydrogen production, hydrogen selectivity, and CO formation in such an approach provides a better foundation for determining thermodynamically feasible operating conditions instead of single-response optimization.
The Aspen Plus software package, the RGibbs reactor, the Soave–Redlich–Kwong (SRK) property methods, and RSM are already employed for the study of MSR. Thus, the novelty of the study lies in the combination of these methods in an approach including equilibrium thermodynamics, sensitivity analysis, response-surface methodology, multi-response optimization, validation, and comparison with literature cases. This approach systematically investigates the impact and interaction of SCR, temperature, as well as pressure on methanol conversion, hydrogen production, hydrogen selectivity, and CO selectivity. The optimal responses are then validated through the use of the Aspen Plus equilibrium model and benchmarked against four selected literature examples under various operating conditions stated in the literature. Through this process, an equilibrium-based understanding of the interactions of operating variables is possible in determining a balanced operating window for hydrogen generation and CO reduction. In other words, the key contribution of the paper is not developing a new thermodynamic or statistical algorithm but the development of an optimized and validated thermodynamic model.
Therefore, the objectives of the work are to (i) construct an Aspen Plus-RGibbs equilibrium model with the SRK property method for MSR; (ii) estimate the effect of individual parameters and interactions between temperature, pressure, and SCR using RSM; (iii) conduct multi-response optimization with respect to methanol conversion, hydrogen yield, hydrogen selectivity, and CO selectivity; and (iv) validate the developed model and optimized values by means of independent Aspen Plus calculations and comparison with typical cases found in the literature. This framework is mainly used to analyze equilibrium modeling and evaluation of process conditions instead of direct prediction of practical reactor performance.
2.1 Thermodynamic modeling and simulation
Aspen Plus (AspenTech) is utilized in the modeling of the MSR process, creating a thermodynamic equilibrium model. The Aspen Plus simulation tool is used for hydrogen production process modeling due to its ability to predict equilibrium composition without the necessity of reaction kinetics data [11, 20]. Thermophysical properties of the reacting mixture were estimated using the SRK equation of state [21], ensuring accurate gas-phase equilibrium prediction in systems including CO, hydrogen, water vapor, CO2, and methanol over a wide range of operating conditions [22].
The reforming reactor was simulated using an RGibbs equilibrium reactor, where the equilibrium composition is defined as a result of the minimization of the overall Gibbs free energy of the reacting mixture with the fulfillment of elemental mass balance requirements. In contrast to the kinetic reactor model, the RGibbs reactor does not need any kinetic parameters of the catalyst or reaction rate equations, which makes it applicable for analysis of equilibrium and MSR optimization [20].
According to the RGibbs approach, MSR is modeled as a system at equilibrium where the composition at the outlet is calculated using the concept of Gibbs free energy minimization under elemental mass balances. This implies that the reaction system has come to equilibrium under the specified operating conditions without any requirement for the kinetic constants of the catalyst being used. Nevertheless, the approach fails to take into account reaction rate limitations, catalyst effectiveness or aging, heat and mass transfer resistances, and finite residence time effects. The output of the model, therefore, is an equilibrium standard and not a prediction of the practical reactor performance. Consequently, the model is applied mainly for the identification of favorable trends, product distribution at equilibrium conditions, and operation regions for multiple response optimization. Experimental reactor performance prediction will involve kinetic, catalyst-specific, and heat and mass transfer studies. Hence, literature comparison has been considered as an indication of consistency with reported behavior instead of thorough experimental assessment.
According to the minimization principle of the Gibbs free energy, the equilibrium composition is calculated as
$G=\sum_{i=1}^N n_i \mu_i$ (1)
where, the total Gibbs free energy G (kJ) of the reacting system, including a total of N chemical species, considers the number of moles ni of species i, with chemical potential μi (kJ mol-1) of species i.
Chemical potentials μi are calculated using the relation,
$\mu_i=\mu_i^0+R T \ln \left(\frac{f_i}{f_i^0}\right)$ (2)
where, μi0, fi, and fi0 are the standard chemical potential (kJ mol−1), fugacity (Pa), and standard-state fugacity (Pa) of species i, respectively, including the universal gas constant R (0.008314 kJ mol−1 K−1) and absolute temperature T (K).
Gibbs free energy minimization is subjected to mass balance of elements,
$\sum_{i=1}^N a_{i j} n_i=b_j$ (3)
where, aij and bj indicate the number of atoms of element j contained in species i, and the total number of atoms of element j supplied to the reactor. This guarantees that the predicted equilibrium composition satisfies thermodynamic equilibrium and mass conservation constraints at the same time [20].
This simulation is based on the assumption of steady-state operation under total thermodynamic equilibrium inside the reformer. The RGibbs reactor model makes such predictions under the above conditions, thus forming a solid foundation for parametric study and process optimization. The main equilibrium reactions included in this simulation are methanol decomposition, MSR, and the water–gas shift reaction. The RGibbs reactors are efficient and reliable to apply thoroughly in Aspen Plus simulations for hydrogen generation from these thermochemical processes. The reactions together control hydrogen production as well as the formation of by-products at equilibrium [23].
The SRK model built into Aspen Plus is utilized to calculate thermodynamic properties as well as phase equilibrium characteristics of the MSR process. The SRK property model was chosen since it can effectively predict non-idealities in the vapor phase of hydrogen-rich gas mixtures at modest temperatures and pressures typically found in reforming systems. Prediction of thermodynamic properties such as fugacity, phase behavior, equilibrium composition, and enthalpy is necessary for accurate modeling of equilibrium reactors as well as optimization.
The widely used SRK equation [21] in hydrogen generation, synthesis gas processing, and reforming applications has the capability to reliably predict gas mixtures with methanol vapor, CO, hydrogen, CO2, water vapor, or light gas.
Mathematically, the SRK equation is described by
$P=\frac{R T}{V-b}-\frac{a \alpha}{V(V+b)}$ (4)
where, pressure P is given by the universal gas constant R, absolute temperature T, and molar volume V of the gas mixture, indicating the effective co-volume b of molecules and the coefficient a of intermolecular attractive forces. Moreover, the temperature-correction term α is given by
$\begin{gathered}\alpha=\left[1+m\left(1-\sqrt{\frac{T}{T_c}}\right)\right]^2, \\ m=0.480+1.574 \omega-0.176 \omega^2\end{gathered}$ (5)
where, Tc, m, and ω signify critical temperature, temperature correction parameter, and acentric factor. The coefficient of attractive forces and co-volume parameters (a and b) can be calculated by the equations:
$a=0.42747 \frac{R^2 T_c^2}{P_c}, b=0.08664 \frac{R T_c}{P_c}$ (6)
with Pc being the critical pressure of the species. The SRK equation of state was found to accurately predict the thermodynamic properties of the vapor phase in hydrogen-containing reforming systems and was thus chosen for Aspen Plus modeling.
Equations indicate the reforming reaction, methanol decomposition, and the WGS reaction.
$\mathrm{CH}_3 \mathrm{OH}+\mathrm{H}_2 \mathrm{O} \rightleftharpoons \mathrm{CO}_2+3 \mathrm{H}_2$ (7)
$\mathrm{CH}_3 \mathrm{OH} \rightleftharpoons \mathrm{CO}+2 \mathrm{H}_2$ (8)
$\mathrm{CO}+\mathrm{H}_2 \mathrm{O} \rightleftharpoons \mathrm{CO}_2+\mathrm{H}_2$ (9)
2.2 Process flow and simulation conditions
The simulation process flow of Aspen Plus includes methanol and steam feed streams, with a heater, mixer, RGibbs reactor, as well as an outlet stream containing products. Initially, methanol and steam are heated up to the required reaction temperature. The preheated feed stream is then fed into the mixer and then supplied to the RGibbs reactor. The feed stream is then fed into the RGibbs reactor to calculate equilibrium composition using the Gibbs free energy minimization method. The reactor output stream includes hydrogen, along with residual steam, CO, CO2, and unreacted methanol.
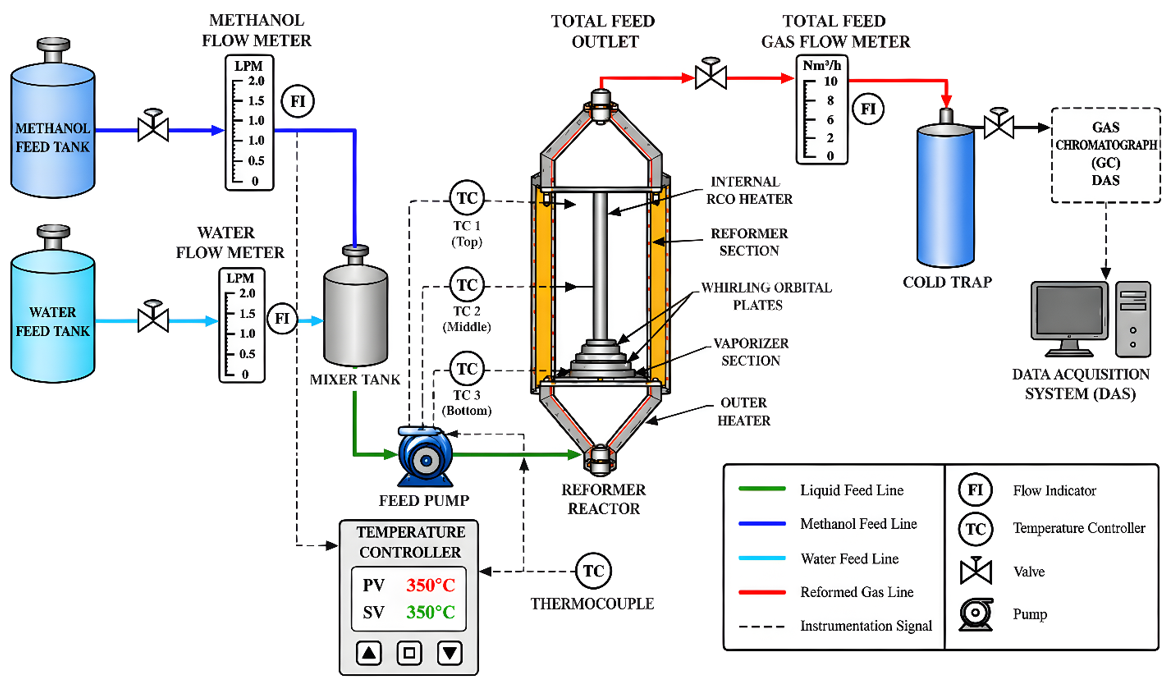
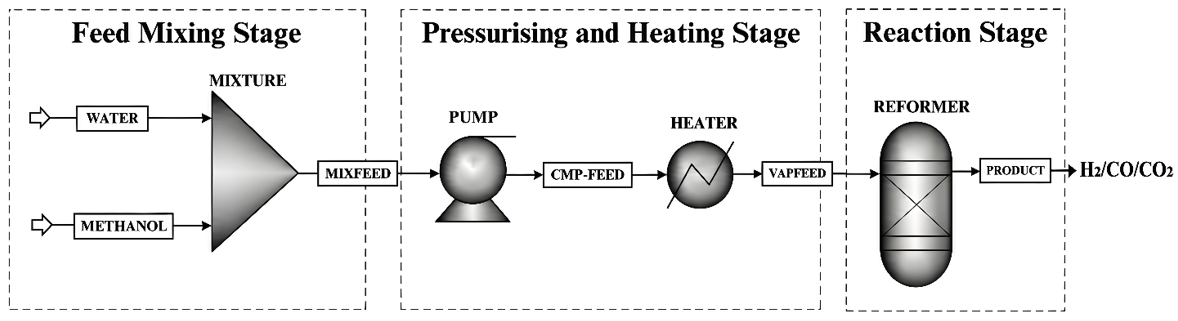
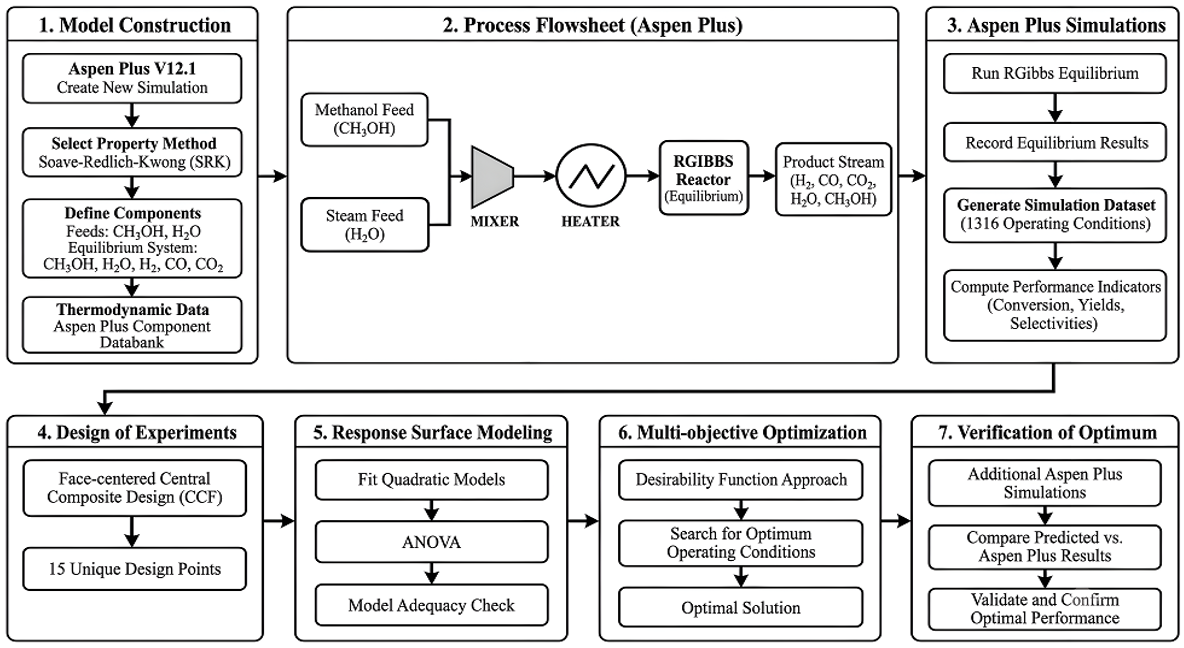
According to previous thermodynamic studies of MSR, the operating conditions in the simulation are chosen [11, 24, 25]. The range of variation of the reaction temperature is 200–300 ℃, reactor pressure 1.013–3.040 bar, and SCR 1.0–3.0. The ranges have been considered according to operating conditions used in past MSR studies that ensure adequate variation for analysis of thermodynamic sensitivity and RSM optimization. However, they are not taken to mean the limits of the catalyst stability or specific industry requirements. It is later utilized for sensitivity analysis, RSM using central composite design (CCD), analysis of variance (ANOVA), and multi-objective optimization. Figures 1 and 2 represent the process flow diagram of MSR and Aspen Plus model selection, while Figure 3 is a flow diagram of the workflow with Aspen Plus-RGibbs-RSM optimization.
For purposes of reproducibility, the models were created using Aspen Plus V12.1 software with the SRK property method and the RGibbs equilibrium reactor. As feed components, methanol and water were identified, while in the equilibrium system, H₂, H₂O, CO₂, CO, and unreacted methanol were included. The pure component thermodynamic parameters were retrieved from the Aspen Plus Databank. A total of 1,316 equilibrium Aspen Plus simulations were carried out within the studied operating region. A 15-level face-centered CCD was applied in developing the quadratic RSM models, which were followed by ANOVA and multi-response desirability optimization. Verification of the optimized predictions was done using additional Aspen Plus equilibrium simulations that were not part of the RSM modeling process (Table 1).
Figure 1. Process flow diagram of the Methanol Steam Reforming (MSR) process
Figure 2. Aspen Plus model selection
Figure 3. Flow diagram of workflow with Aspen Plus-RGibbs response surface methodology (RSM) optimization
Table 1. Simulation using Aspen Plus and response surface methodology (RSM) design
|
Parameter |
Specification |
|
Software |
Aspen Plus V12.1 |
|
Reactor |
RGibbs equilibrium reactor |
|
Property method |
Soave–Redlich–Kwong (SRK) |
|
Feed components |
CH₃OH, H₂O |
|
Equilibrium components |
CH₃OH, H₂O, H₂, CO, CO₂ |
|
Temperature |
200–300 ℃ |
|
Pressure |
1.01325–3.03975 bar |
|
SCR molar ratio |
1–3 |
|
Total Aspen Plus simulations |
1,316 |
|
RSM design |
Face-centered CCD (CCF) |
|
CCD points |
15 |
|
RSM model |
Quadratic |
|
Optimization |
Multi-response desirability |
|
Verification |
Additional Aspen Plus simulations |
2.3 Performance evaluation criteria
The evaluation of the reforming reaction for thermodynamic performance was performed on the basis of hydrogen production, methanol conversion, hydrogen selectivity, as well as selectivity of CO2 and CO.
The methanol conversion XMeOH and hydrogen production (yield) YH₂ were obtained as
$X_{\mathrm{MeOH}}=\frac{F_{\mathrm{CH}_3 \mathrm{OH}, \text { in }}-F_{\mathrm{CH}_3 \mathrm{OH}, \text { out }}}{F_{\mathrm{CH}_3 \mathrm{OH}, \text { in }}} \times 100$ (10)
$Y_{\mathrm{H}_2}=\frac{F_{\mathrm{H}_2}}{3 F_{\mathrm{CH}_3 \mathrm{OH}, \mathrm{in}}} \times 100$ (11)
Selectivity of hydrogen (SH₂), carbon monoxide (SCO), and carbon dioxide (SCO₂) can be obtained as
$\begin{gathered}S_{\mathrm{H}_2}=\frac{F_{\mathrm{H}_2}}{F_{\mathrm{H}_2}+F_{\mathrm{CO}}+F_{\mathrm{CO}_2}} \times 100, \\ S_{\mathrm{CO}}=\frac{\mathrm{F}_{\mathrm{CO}}}{F_{\mathrm{H}_2}+F_{\mathrm{CO}}+F_{\mathrm{CO}_2}} \times 100, \\ S_{\mathrm{CO}_2}=\frac{\mathrm{F}_{\mathrm{CO}_2}}{F_{\mathrm{H}_2}+F_{\mathrm{CO}}+F_{\mathrm{CO}_2}} \times 100\end{gathered}$ (12)
In the above equations, F is the molar flow rate of each chemical species at the outlet of the reactor [25, 26], while inlet (in) and outlet (out) molar flow rates F are indicated as FMeOH,in, FMeOH,out, FH₂,out, FCO,out, and FCO₂,out for methanol, hydrogen, carbon monoxide, and carbon dioxide, respectively. ∑Fproducts indicates the sum of outlet gaseous molar flow rates, while selectivities SH₂, SCO, and SCO₂ are selectivities towards respective products.
2.4 Parametric and sensitivity analysis
A comprehensive sensitivity analysis was performed to study the impact of operational variables on the methanol reforming reaction. Individual variations in pressure, temperature, and the ratio of steam to methanol were also maintained while the other variables were unchanged. Responses obtained from the Aspen Plus simulation at equilibrium include hydrogen yield and selectivity, methanol conversion, and selectivity of CO and CO2. The statistical modeling and optimization were performed on the simulation dataset.
2.5 Response surface methodology
RSM was applied to develop statistical models between the response variables and operating parameters. The CCD approach was selected due to its efficiency in fitting quadratic equations using a small number of simulations while considering the interaction effects between the process parameters [18].
Three independent variables were considered, including the reaction temperature (X1), reactor pressure (X2), and SCR (X3). Methanol conversion, hydrogen yield, hydrogen selectivity, CO selectivity, and CO2 selectivity were the responses. The second-order polynomial equation was used to model the simulation responses, in which Y, Xi, and β indicate the predicted response, independent variables, and regression coefficients.
$\begin{gathered}Y=\beta_0+\sum_{i=1}^3 \beta_i X_i+\sum_{i=1}^3 \beta_{i i} X_i^2+ \sum_{i=1}^2 \sum_{j=i+1}^3 \beta_{i j} X_i X_j\end{gathered}$ (13)
RSM was chosen because of the nature of the current experiment, which involves a few continuous operating parameters and necessitates an interpretation of their interactions. As compared to computationally intensive techniques like artificial neural networks and machine learning models, RSM allows the generation of an easily interpreted quadratic relationship with minimal simulation data. While genetic algorithms are adept at exploring the complexities of the nonlinear space, they involve more computational effort and have no direct interpretation of interactions between the parameters. Hence, the current Aspen Plus simulation scenario can benefit from RSM in a computationally effective way, even though its quadratic form can be less ideal for larger optimization spaces or nonlinear systems.
2.6 Statistical analysis and process optimization
The ANOVA method was employed to assess the adequacy as well as statistical significance of the obtained regression models. The values of p-value, F-value, adjusted R², predicted R², determination coefficient (R²), and lack-of-fit test were used to examine the model's performance. In addition, desirability function-based numerical optimization was conducted to determine optimum conditions for maximizing methanol conversion as well as selectivity and yield of hydrogen while the formation of CO is minimized. The RSM model predicted optimal operating conditions that were confirmed by further Aspen Plus simulations.
2.7 Validation based on case studies
The effectiveness of the proposed approach was investigated by performing four representative case studies from the literature that involved different configurations as well as operating parameters of methanol reforming. For all studies, the stated feed composition, pressure, temperature, and SCR were implemented in Aspen Plus, while equilibrium simulation was carried out using the established model. The obtained methanol conversion, selectivity, and yield of hydrogen, as well as the composition of the product, were compared with outcomes of these studies. The predictiveness of the proposed model was determined based on percentage deviations and comparisons. This comparison indicates qualitative and quantitative thermodynamic consistency across the selected literature cases.
2.8 Comparative performance analysis
Comparative analysis was carried out to determine the general applicability and consistency of the proposed methodology in the four validation cases studied. The comparison considers the conversion of methanol and the production and selectivity of hydrogen, along with the production of CO and CO2, among other thermodynamic performance parameters. This analysis proves the efficiency and suitability of the integrated methodology based on the Aspen Plus, RGibbs reactor, and RSM approaches in thermodynamic modeling, optimization, and performance evaluation of MSR for hydrogen production.
3.1 Thermodynamic performance of Aspen Plus-RGibbs model
The thermodynamic performance of the Aspen Plus-RGibbs model at the specified reference conditions of temperature equal to 250 ℃, pressure equal to 1.013 bar (≈1 atm), and SCR equal to 1.53 is shown in Table 2. This set of conditions was considered as a reference case for the verification of equilibrium properties of the model before performing any parametric and optimization studies.
Table 2. Simulation results under the condition of baseline optimization
|
Parameter |
Value |
Performance Indicator |
Value (%) |
|
Temperature (℃) |
250 |
Methanol conversion |
99.994 |
|
Pressure (bar) |
1.013 |
Hydrogen yield |
98.233 |
|
Steam-to-methanol ratio |
1.53 |
Hydrogen selectivity |
74.665 |
|
Property method |
SRK |
CO selectivity |
5.285 |
|
Reactor |
RGibbs |
CO₂ selectivity |
23.996 |
The model predicts the methanol conversion of 99.994% at the reference conditions. This demonstrates that the steam reforming reaction practically proceeds nearly to equilibrium. The finding is in line with the thermodynamics of the process, since the MSR reaction is extremely beneficial at average temperatures in a low-pressure regime, which results in near-complete methanol conversion. The RGibbs reactor achieved high conversion, successfully determining the equilibrium composition where Gibbs free energy is minimized without the need for reaction kinetics.
Based on the equilibrium product distribution analysis, it can be determined that the yield of hydrogen is 98.233%, as well as the selectivity of hydrogen (74.665%). Thus, the main product of the reforming reaction is hydrogen. There are small amounts of CO (5.285%) and CO2 (23.996%). This is a result of methanol decomposition, WGS reactions, and MSR occurring simultaneously at an equilibrium state. The main carbon-containing product is CO2, and low CO selectivity implies that the chosen operating parameters have the potential to produce the maximum amount of hydrogen without forming unwanted CO.
As seen from the results, the model represents the ideal equilibrium behavior of the MSR process. This is supported by high values of methanol conversion and hydrogen yield while reducing CO selectivity. The obtained results confirm that the created Aspen Plus–RGibbs model accurately represents the equilibrium reforming process, which is the starting point for sensitivity analysis, RSM, and process optimization.
3.2 Impact of operating conditions on the methanol steam reforming
3.2.1 Impact of temperature
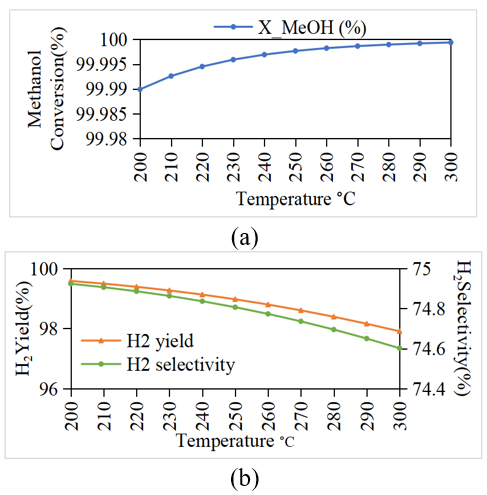
Figure 4 presents the effect of reaction temperature on methanol conversion, hydrogen production, and hydrogen selectivity under a fixed pressure of 1.013 bar and an SCR of 2. With the rise in temperature in the range 200–300 ℃, it improves methanol conversion marginally from 99.9899% to 99.9994%, suggesting that near-equilibrium conversion has been achieved within the entire range of tested temperatures. This slight increase in methanol conversion is due to the fact that the MSR process is endothermic in nature, since an increase in temperature shifts the equilibrium in the direction of product formation.
On the other hand, hydrogen output steadily fell from 99.58% at 200 ℃ to 97.91% at 300 ℃, whereas hydrogen selectivity reduced from 74.92% to 74.60%. This clearly indicates that while the conversion of methanol was close to 100%, the increase in temperature showed the effect of increasing the competing equilibrium reactions, such as the methanol dissociation reaction as well as the reverse WGS reaction. It caused increased production of CO along with a slight drop in hydrogen yield. Therefore, an excessively high temperature does not always lead to higher hydrogen yield even if the methanol conversion is close to 100%. The results demonstrate that a better balance can be obtained through moderate operating temperatures between thorough methanol conversion and a higher yield of hydrogen.
Figure 4. Effect of varying temperature on (a) methanol conversion, (b) hydrogen yield and hydrogen selectivity
3.2.2 Impact of pressure
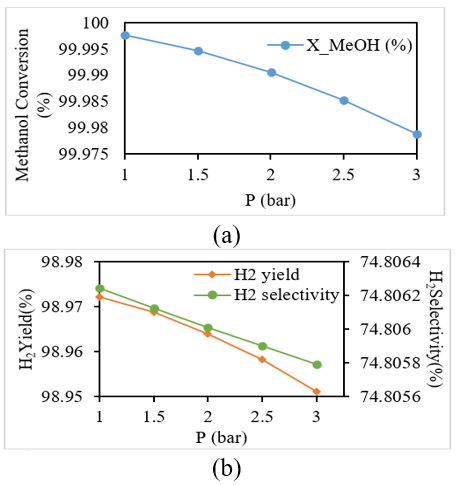
In Figure 5, the effect of the reactor pressure on the performance of methanol reforming is shown at a constant temperature of 250 ℃ with an SCR of 2. Increasing the pressure from 1.013 to 3.040 bar, it led to a slight decrease in methanol conversion from 99.9977% to 99.9787%. Also, hydrogen yield dropped slightly by 0.02 percentage points (98.97–98.95%), while hydrogen selectivity stayed almost unchanged at about 74.81%.
Such an effect could be explained by applying Le Chatelier's principle. As the MSR process results in the formation of more moles of gas than the reactants, rising pressure changes the equilibrium towards the side of the reactants, thus slightly decreasing hydrogen yield and methanol production and conversion. But the changes were not significant, as the range of the studied pressure values was rather narrow and the reaction had a tendency to run almost at equilibrium. According to these results, the impact of pressure on reactor performance is considerably smaller than that of temperature or SCR within the selected operating range.
Figure 5. Effect of varying pressure on (a) methanol conversion, (b) hydrogen yield and hydrogen selectivity
3.2.3 Impact of steam to methanol ratio
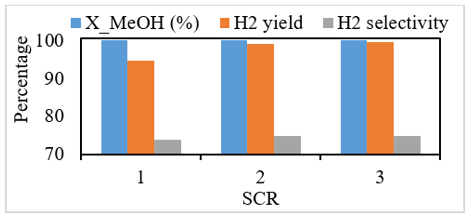
In Figure 6, the study shows the influence of the SCR on hydrogen yield, methanol conversion, and hydrogen selectivity at a temperature and pressure fixed at 250 ℃ and 1.013 bar. Increasing the SCR from 1 to 3 resulted in a marginal increase in methanol conversion (99.9824% to 99.9991%), whereas the hydrogen yield rose by 4.87 percentage points (94.59% to 99.46%) at the same time, with a slight increase of 0.95 percentage points in hydrogen selectivity (73.95–74.90%).
There was a significant drop in CO selectivity (16.18 to 1.61%) due to the rise in SCR (1 to 3). This trend may be explained based on the equilibrium of the key MSR reactions represented by Eqs. (7)–(9). The rising value of the SCR adds more H₂O to the system, thus promoting the forward reaction of MSR (Eq. (7)) and offering extra steam for the WGS reaction (Eq. (9)). Both of these reactions result in CO consumption and H₂ and CO₂ formation. In turn, the methanol decomposition reaction (Eq. (8)) leads to CO and H₂ generation. As methanol decomposition and MSR are endothermic processes, their equilibrium is usually shifted with increasing temperature. On the contrary, the WGS reaction, being exothermic, has the tendency to occur at lower temperatures. Hence, the addition of steam makes the equilibrium move towards the production of hydrogen and the consumption of CO, which explains the increased yield of H₂ and decreased selectivity of CO. Nevertheless, fewer thermodynamic advantages are seen due to excessive steam, but raise the amount of energy needed for the heating of the feed and its vaporization. In conclusion, the best SCR balances reforming and water-gas-shift equilibrium while minimizing excessive steam usage.
Figure 6. Effect of varying steam-to-methanol ratio (SCR) on methanol conversion, hydrogen yield and hydrogen selectivity
3.2.4 Impact of Carbon Monoxide and Carbon Dioxide selectivity
The impact of three factors on the selectivity of CO and CO₂ was observed according to thermodynamics. The increase in temperature favored the generation of CO and decreased CO₂ selectivity due to the favorable decomposition of methanol as well as reverse WGS reactions. The pressure showed no considerable impact on the selectivity of CO and CO₂ since the increase in pressure within the selected range led to a minor rise in CO selectivity and a related decrease in CO₂ selectivity. On the contrary, an increase in the SCR led to a significant reduction in CO selectivity since the increase in this ratio increased the selectivity of CO₂ due to the WGS reaction, resulting in the production of CO₂ and hydrogen. The achieved results indicate that, based on the equilibrium conditions tested, high SCR, low pressures, and moderate temperatures are suitable for minimizing the formation of CO and maximizing the H₂ equilibrium ratio.
Of these three operating variables studied, the SCR was found to have a greater effect on hydrogen yield and suppression of CO production, while the other two variables (temperature and pressure) were less effective, with pressure showing a lower impact than temperature. This is in agreement with the findings of ANOVA discussed further, where it is concluded that the most influential factors are the SCR and temperature, affecting the performance of the reactor. From this thermodynamic study, it can be seen that high hydrogen yield with minimum CO production is possible under conditions of moderate temperatures, low pressures, and high SCR.
3.3 Response surface methodology and analysis of variance analysis
3.3.1 Analysis of variance analysis
In order to investigate the effect of temperature, pressure, and ratio of steam to methanol in the MSR reaction, the quadratic regression models were formulated based on CCD. The developed models were tested for adequacy and significance by ANOVA. Model performance with statistical summary is shown in Table 3 below, including p-value, F-value, R², adjusted R², and predicted R².
Table 3. Results of analysis of variance (ANOVA) test
|
Response |
Model SS |
df |
Mean Square |
F-Value |
p-Value |
R² |
Adjusted R² |
Predicted R² |
|
Methanol conversion |
0.8620 |
9 |
0.0958 |
2.804 |
0.1343 |
0.8346 |
0.5370 |
-1.9399 |
|
Hydrogen yield |
93.8602 |
9 |
10.4289 |
206.552 |
<0.0001* |
0.9973 |
0.9925 |
0.9654 |
|
Hydrogen selectivity |
3.5759 |
9 |
0.3973 |
129.235 |
<0.0001* |
0.9957 |
0.9880 |
0.9615 |
|
CO selectivity |
805.6108 |
9 |
89.5123 |
24.492 |
0.0013* |
0.9778 |
0.9379 |
0.6800 |
Table 4. Residual and statistical results of response surface methodology (RSM) using analysis of variance (ANOVA) test
|
Response |
Residual SS |
Residual df |
Residual MS |
Total SS |
Total df |
|
Methanol Conversion |
0.1707 |
5 |
0.0341 |
1.0327 |
14 |
|
Hydrogen Yield |
0.2523 |
5 |
0.0505 |
94.1124 |
14 |
|
Hydrogen Selectivity |
0.0154 |
5 |
0.0031 |
3.5913 |
14 |
|
CO Selectivity |
18.2777 |
5 |
3.6555 |
823.8886 |
14 |
ANOVA test results indicate that the models are statistically significant for hydrogen yield and selectivity of hydrogen and CO, as the p-value is below 0.05. The model for hydrogen yield is the most statistically significant (F = 206.552) with a high R² coefficient of determination (0.9973), demonstrating that nearly 99.73% of the variance in hydrogen yield is explained by the model depending on the chosen operating variables. Similar to this, the high R² of the models for hydrogen selectivity (0.9957) and CO selectivity (0.9778), along with the adjusted and predicted R² values, confirms the appropriateness of the designed quadratic models to predict the performance of the reactor within the examined operating range.
R² predictions of 0.9654 and 0.9615 for the RSM models of hydrogen yield and hydrogen selectivity, respectively, suggest a strong consistency in predictions and a minimal risk of overfitting since they are relatively close to the adjusted R-squared values. At the same time, the R² prediction of 0.6800 for the CO selectivity RSM model is significantly lower, which indicates a higher level of prediction uncertainty for this response variable. However, the model is still considered adequate, as it has a positive R² prediction and a statistically significant result (Table 4).
On the other hand, the methanol conversion model has a relatively high R² = 0.8346, but it is statistically insignificant (p = 0.1343). In the case of the quadratic model, the negative value of predicted R² = −1.9399 signifies a lack of predictive power. This result is reasonable, as the methanol conversion was maintained over 99% through the majority of the design space, thus providing minimal variance for the regression to work with. Hence, while the methanol conversion is a physically meaningful response variable, the RSM model associated with it is not to be used for predictions due to the low range of variations in the response variable. Therefore, this response variable was chosen as an objective for the optimization, whereas the equilibrium model using Aspen Plus determines the final optimal condition.
Temperature and SCR were the most influential parameters in terms of hydrogen yield and hydrogen selectivity, while pressure showed less influence within the range studied. Quadratic models successfully captured hydrogen yield and selectivity of hydrogen as well as CO in the design space analyzed, even though the R² of the predicted model for CO selectivity was relatively lower. However, methanol conversion could not be accurately predicted as a sole response due to the narrow range of conversion. Hence, methanol conversion was kept in the optimization process due to its significance in nature, while the optimized results were validated through Aspen Plus equilibrium simulation.
3.3.2 Response surface analysis
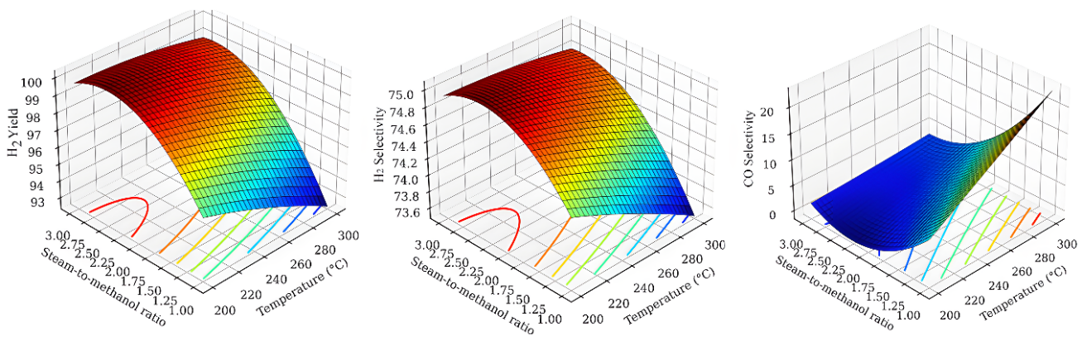
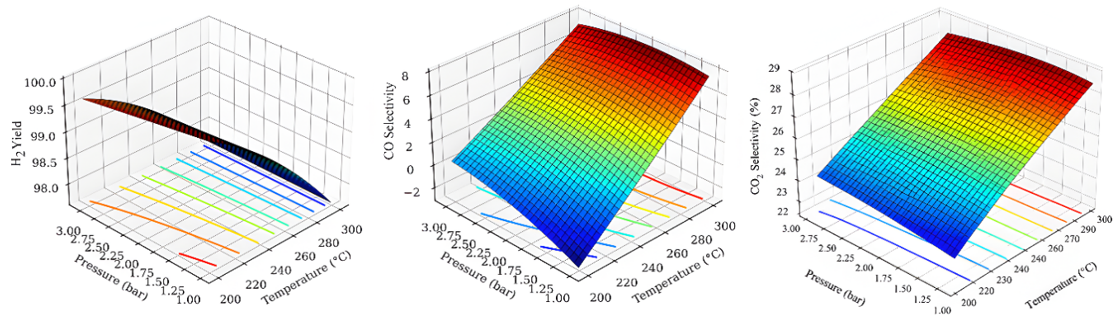
In order to explore the effect of interactions among the operational parameters, three-dimensional plots of the response surfaces based on the obtained quadratic RSM models are presented. These response surface plots (Figures 7 and 8) are based on the established Aspen Plus-RGibbs-RSM models, showing the effects of pressure, temperature, and SCR. They also offer a visual representation of the ANOVA outcomes. The values related to the response surface are tabulated in Tables 5 and 6, whereas the optimum operating point found by the RSM model using Aspen Plus can be seen in Table 5.
Figures 7 (a)–(c) show the impact of both temperature and SCR on hydrogen formation and selectivity. The higher the SCR, the higher the yield of hydrogen. However, the rise in temperature leads to a slight decline in hydrogen yield in the studied interval. The maximum hydrogen yield (99.79%) is achieved at 200 ℃ and SCR = 3.0, while the minimum one is observed at 300 ℃ and SCR = 1.0 (Table 5). This result is supported by ANOVA, as the statistically significant factors include temperature (A), SCR (C), along with the interaction (AC), as well as the quadratic effect of SCR (C²).
There is only a slight variation in hydrogen selectivity in the entire design space, ranging from about 73.8% to 75.0%. An increase in SCR leads to a consistent increase in hydrogen selectivity, while a rise in temperature leads to a decrease in hydrogen selectivity. This suggests that hydrogen selectivity is less sensitive to process variables than hydrogen yield.
CO selectivity, on the other hand, behaves differently. An increase in the SCR significantly reduces the amount of CO produced due to the steam promoting the WGS reaction, which produces more CO₂ and more hydrogen. An increase in temperature under equilibrium conditions, in contrast, favors the production of CO. According to Table 5 and Figure 7, the lowest CO selectivity (0.62%) is observed at 200 ℃ and SCR at 3, while the highest CO selectivity (18.43%) is observed at 300 ℃ and SCR at 1, confirming control of the undesirable CO formation and steam availability as the dominant factor.
As depicted in Table 6 below, the effect of temperature and pressure is illustrated by some examples of response surface results when the SCR is 2.
Table 5. Results of response surface methodology (RSM) for the effect of temperature and steam-to-methanol ratio (SCR)
|
Temperature (℃) |
SCR |
H2 Yield (%) |
H2 Selectivity (%) |
CO Selectivity (%) |
|
200 |
1.0 |
95.12 |
74.02 |
15.84 |
|
200 |
2.0 |
99.58 |
74.92 |
2.74 |
|
200 |
3.0 |
99.79 |
74.96 |
0.62 |
|
250 |
1.0 |
94.59 |
73.95 |
16.18 |
|
250 |
2.0 |
98.97 |
74.81 |
3.08 |
|
250 |
3.0 |
99.46 |
74.90 |
1.61 |
|
300 |
1.0 |
93.80 |
73.79 |
18.43 |
|
300 |
2.0 |
97.91 |
74.60 |
5.46 |
|
300 |
3.0 |
98.49 |
74.71 |
3.71 |
Table 6. Results of response surface methodology (RSM) for effect of temperature and pressure
|
Temperature (℃) |
Pressure (bar) |
H2 Yield (%) |
CO Selectivity (%) |
CO2 Selectivity (%) |
|
200 |
1.013 |
99.58 |
2.74 |
24.77 |
|
200 |
2.026 |
99.53 |
2.91 |
24.77 |
|
200 |
3.040 |
99.47 |
3.07 |
24.77 |
|
250 |
1.013 |
98.97 |
3.08 |
24.42 |
|
250 |
2.026 |
98.96 |
3.08 |
24.42 |
|
250 |
3.040 |
98.95 |
3.08 |
24.42 |
|
300 |
1.013 |
97.91 |
5.46 |
23.80 |
|
300 |
2.026 |
97.83 |
5.66 |
23.80 |
|
300 |
3.040 |
97.74 |
5.87 |
23.80 |
Figures 8(a)–(c) present the relationship between temperature and pressure, keeping the SCR constant at 2.0. While an increase in pressure from 1.013 to 3.040 bar leads to only a small drop in hydrogen yield, the effect of temperature on hydrogen productivity is greater, hence making the response surface steeper in the temperature direction than the pressure direction. This indicates temperature as the dominant factor impacting hydrogen production. The trend of the CO₂ selectivity surface decreases slightly with an increase in temperature because of the increasing contribution of the inverse WGS reaction occurring at high temperature. While pressure has little effect on responses, as shown by the response surface of CO₂ selectivity that is nearly flat with respect to pressure.
Similar observations were made regarding CO selectivity. CO selectivity increases with higher temperature, but it only increases slightly with an increase in pressure. Parallel contour lines with respect to pressure demonstrate that pressure affects CO selectivity marginally within the tested operating window. These conclusions agree with the ANOVA results indicating pressure is not recognized as a statistically significant factor.
3.4 Optimization and validation
The optimization was done to find optimum conditions for maximum methanol conversion, hydrogen yield, and selectivity of hydrogen and minimum selectivity of CO. Optimized operating conditions based on the desirability function are shown in Table 7. Optimum conditions found included a reaction temperature of 200 ℃, a pressure of 1.0 atm, and an SCR of 3.0. Further, the Aspen Plus–RGibbs model is used for verification of these optimum operating conditions, confirming the reliability of the optimization results.
The table shows that optimum operating conditions resulted in almost complete (99.996%) methanol conversion under equilibrium conditions. A hydrogen yield and hydrogen selectivity were found to be 99.80% and 74.96%, respectively, showing hydrogen as the main product formed during the reforming process. Moreover, the CO selectivity was reduced to just 0.63%, which indicates suppression of CO formation due to increased SCR through the WGS reaction, in addition to enhanced hydrogen production.
The predicted optimal conditions for the equilibrium process of hydrogen production are 200 ℃, 1.013 bar, and an SCR of 3.0. The simulation results using Aspen Plus conducted under these conditions correlated very well with the results obtained from the response surface model, with the absolute deviation ranging from 0.002 to 0.01% for all response variables (Table 7). This good correlation indicates the validity of the Aspen Plus–RGibbs–RSM model used. Generally, based on the response surface analysis, it can be concluded that the process at relatively low temperature, atmospheric pressure, and high SCR will give the optimal equilibrium state for maximum hydrogen production and minimal CO formation. Thus, the proposed methodology is validated as an efficient thermodynamic optimization tool for MSR.
The optimization analysis shows that low-pressure operation, medium reaction temperature, and high SCR create favorable thermodynamic conditions for hydrogen generation and CO inhibition. Despite being an endothermic reaction, higher levels of steam in MSR have a greater effect on hydrogen yield and CO reduction compared to higher temperatures. This high similarity between optimized conditions and results from the Aspen Plus software proves the consistency of the proposed Aspen Plus–RGibbs–RSM approach in predicting high-equilibrium hydrogen yield with reduced CO formation.
Table 7. Validated performance at optimized operating conditions (temperature 200 ℃, pressure 1.013 bar, steam-to-methanol ratio (SCR) 3.0)
|
Performance Indicator |
RSM Prediction (%) |
Aspen Plus Validation (%) |
Absolute Error (%) |
|
Methanol Conversion |
99.996 |
99.994 |
0.002 |
|
Hydrogen Yield |
99.80 |
99.79 |
0.01 |
|
Hydrogen Selectivity |
74.961 |
74.96 |
<0.01 |
|
CO Selectivity |
0.63 |
0.622 |
0.008 |
|
CO2 Selectivity |
23.998 |
23.996 |
0.002 |
3.5 Validation based on case studies
To assess the predictive ability of the developed Aspen Plus–RGibbs model, the results were compared to those from four published case studies. These case studies consist of both experiments conducted within a reactor as well as thermodynamic equilibrium analysis of reactors with various operational parameters. To validate the model, the operational parameters from these cases were replicated in Aspen Plus, and the methanol conversion obtained was compared with that reported. Hydrogen yield and CO formation (where applicable) were also compared as shown in Table 8.
Table 8. Validation of Aspen Plus–RGibbs model using published case studies
|
Case Study |
Temperature (℃) |
Pressure |
Steam-to-Methanol Ratio |
Methanol Conversion (%) |
H₂ Yield (%) |
CO (%) or ppm |
Agreement |
|||
|
Re |
Pr |
Re |
Pr |
Re |
Pr |
|||||
|
Nehe et al. [12] |
240 |
Atmospheric |
- |
72.72 |
73.18 |
70.0 |
70.6 |
3.0 |
3.1 |
Good |
|
Nehe and Kumar [13] |
250 |
1 atm |
1.1 |
98.00 |
98.47 |
75.0 |
74.9 |
928 |
910 |
Excellent |
|
Özcan and Akın [14] |
246 |
1 atm |
5.6 |
≈100 |
99.99 |
Max. H₂ production |
Similar trend |
Low CO (30–1700 ppm) |
Similar trend |
Trend agreement |
|
Achomo et al. [15] |
200 |
1 bar |
1.0 |
99.87 |
99.91 |
96.9 |
96.8 |
Low CO trend |
Similar trend |
Excellent |
Table 9. Validation of quantitative result comparison
|
Case Study |
Methanol Conversion Deviation (%) |
H₂ Yield Deviation (%) |
CO Deviation (%) |
Agreement |
|
Nehe et al. [12] |
0.63 |
0.86 |
3.33 |
Good |
|
Nehe and Kumar [13] |
0.48 |
0.13 |
1.94 |
Excellent |
|
Achomo et al. [15] |
0.04 |
0.10 |
- |
Excellent |
Experimental results of Nehe et al. [12] and Nehe and Kumar [13] support the proposed thermodynamic model. Nehe et al. [12] reported that the methanol conversion rose from 46.62 to 72.72% (200–240 ℃), along with a reformate composition of around 70% H₂, 27% CO₂, and 3% CO. Under the reported operating conditions (240 ℃), the Aspen Plus model estimated the methanol conversion rate at 73.18%, 70.6% hydrogen, and 3.1% CO, providing high accuracy in comparison with experimental data. In turn, the microchannel reformer investigated by Nehe and Kumar [13] produced around a 98% methanol conversion rate at 250 ℃ and 1.1 SCR, yielding 75% hydrogen and 928 ppm CO. The differences between the experimental and Aspen Plus simulation results were negligible, which proves the applicability of the equilibrium model.
Moreover, Özcan and Akın [14] and Achomo et al. [15] conducted thermodynamic studies and provided additional validation of the equilibrium characteristics predicted by the proposed model. Özcan and Akın [14] observed the optimal operational parameters of 246 ℃, 1 atm, and an SCR of 5.6, which led to the almost full conversion of methanol along with the minimum concentration of CO produced. These equilibrium tendencies were confirmed by the present model based on similar equilibrium conditions, including full conversion of methanol, higher hydrogen production, and lower concentration of CO. Moreover, Achomo et al. [15] observed that an increase in temperature and SCR positively affect the conversion of methanol and hydrogen production, while an increase in pressure decreases the reactor efficiency. Thus, the proposed Aspen Plus simulation demonstrated consistent thermodynamic behavior, verifying the uniformity of the Gibbs free energy minimization approach.
Table 9 indicates the deviation of the proposed study and case studies. Relative deviation was determined from (P-R)/R , where P and R are the present model value and reported value, respectively. Percent deviations were found to be less than 1% for methanol conversion and H₂ yield, and CO deviations for Nehe et al. [12] and Nehe and Kumar [13] were less than 4%, which reflects the high numerical consistency of the cases presented. Qualitative cases were compared based on the reported trend. Due to the differences in reactor design, parameters, and conditions used in these studies, the comparison provides thermodynamic consistency validation.
The results from the validation process demonstrate adequate consistency between the Aspen Plus-RGibbs modeling and the corresponding thermodynamic and experimental studies under the specified conditions. This agreement encourages the use of the equilibrium model for investigation of trends in operating parameters and distribution of equilibrium products. However, since these studies are conducted using various reactor setups and catalyst conditions, the process of validation can be viewed only as an indication of the thermodynamic accuracy of the model and not as a direct validation of reactor performance.
The optimized conditions are interpreted in terms of the framework employed for equilibrium modeling in the study. Although the RGibbs model is capable of establishing favorable operation conditions from a thermodynamic perspective, it does not consider catalyst deactivation, kinetics of reactions, heat transfer constraints, material balance, cost of equipment, and stability of operations. Hence, the optimized temperature, pressure, and SCR are favorable equilibrium conditions and cannot directly predict the performance of the industrial reactor. Based on engineering criteria, the optimized conditions are viewed as thermodynamic target operating conditions but not as real reactor conditions. Low pressure decreases the need for compression, while the high SCR raises the energy consumption for producing steam and heating the feed. In practice, limitations on the operating conditions of the catalyst, reactor heat transfer capability, reactor volume, and thermal aspects have to be taken into account as well. Moreover, its implementation needs energy, kinetic, techno-economic, and experimental assessments.
A thermodynamic model (Aspen Plus–RGibbs–RSM model) of the MSR process was developed with Aspen Plus software along with an RGibbs reactor coupled with RSM for optimizing hydrogen generation at equilibrium conditions. In this study, the impact of pressure, temperature, and SCR on methanol conversion, selectivity, and generation of hydrogen, as well as CO formation, was systematically analyzed. Quadratic models developed for this study show excellent predictive performance in terms of hydrogen generation (R² = 0.9973) and selectivity (R² = 0.9957), along with CO selectivity (R² = 0.9778). This verifies the appropriateness of the proposed methodology for process optimization. The results from the response surface analysis indicate that higher SCR and lower pressure were favorable in the production of hydrogen and the inhibition of CO formation. But temperature increase was favorable for methanol conversion while unfavorable for hydrogen production due to the reverse WGS reaction. Optimization by desirability revealed 200 ℃, 1.013 bar, and SCR of 3 as the optimum operating conditions, producing 99.994% methanol conversion, 99.79% hydrogen production, 74.96% hydrogen selectivity, and 0.622% CO selectivity. The predicted trends in thermodynamics were similar to the findings of existing experimental studies, indicating that the proposed methodological approach of the Aspen Plus–RGibbs–RSM model is useful in hydrogen production process optimization.
The current investigation involves the use of equilibrium thermodynamic modeling through the RGibbs reactor in Aspen Plus, excluding the aspects of reaction kinetics, deactivation of the catalyst, and transport limitations. The optimization was carried out within the range of temperature, pressure, and SCR, considering the assumption of equilibrium. Even though the model developed was verified from previously published work, experimental verification was not carried out under similar operational conditions. Thus, further research can involve the integration of kinetic reactor modeling with thermodynamics. The laboratory-scale investigation for MSR systems will also provide an additional step to validate the proposed model. While this current optimization addresses hydrogen production, methanol conversion, hydrogen selectivity, and CO reduction, for any sustainable process evaluation, carbon emissions, steam generation energy, energy requirements, and methanol supply should be taken into account. Therefore, future research should incorporate energy and exergy optimization, carbon emission evaluation, and use of renewable methanol along with current thermodynamic optimization. Moreover, other analyses such as energy, exergy, and economic analyses can also be included to assess the sustainability of the system. The proposed methodology can also be used in the optimization of catalysts, reactors, and integrated hydrogen production with methanol-based systems.
|
a |
attractive parameter of the SRK equation of state, Pa·m⁶·mol⁻² |
|
aij |
number of atoms of element (j) in species (i) |
|
b |
co-volume parameter of the SRK equation of state, m³·mol⁻¹ |
|
bj |
total number of atoms of element (j) entering the reactor |
|
F |
molar flow rate, mol·s⁻¹ |
|
fi |
fugacity of species (i), Pa |
|
fi0 |
standard-state fugacity of species (i), (Pa) |
|
G |
total Gibbs free energy, kJ |
|
m |
SRK temperature correction parameter |
|
N |
total number of chemical species |
|
ni |
number of moles of species (i), mol |
|
P |
pressure, bar |
|
Pc |
critical pressure, bar |
|
S |
selectivity |
|
R |
universal gas constant, J·mol⁻¹·K⁻¹ |
|
T |
absolute temperature, K |
|
Tc |
critical temperature, K |
|
V |
molar volume, m³·mol⁻¹ |
|
X |
methanol conversion |
|
Y |
yield |
|
Greek symbols |
|
|
α |
temperature correction factor in the SRK equation of state |
|
μi |
chemical potential of species (i), kJ·mol⁻¹ |
|
μi0 |
standard chemical potential, kJ·mol⁻¹ |
|
ω |
acentric factor |
|
Subscripts |
|
|
c |
Critical condition |
|
i |
Chemical species |
|
j |
Chemical element |
|
0 |
Standard state |
[1] Lian, M., Li, J., Li, L., et al. (2026). Structural relationships and the synergistic catalytic mechanism of CuO/ZnO/Ga₂O₃ ternary catalysts in low-temperature methanol steam reforming. Reaction Chemistry & Engineering. https://doi.org/10.1039/d6re00092d
[2] Garcia, G., Arriola, E., Chen, W.H., De Luna, M.D. (2021). A comprehensive review of hydrogen production from methanol thermochemical conversion for sustainability. Energy, 217: 119384. https://doi.org/10.1016/j.energy.2020.119384
[3] Zaccara, A., Petrucciani, A., Matino, I., et al. (2020). Renewable hydrogen production processes for the off-gas valorization in integrated steelworks through hydrogen intensified methane and methanol syntheses. Metals, 10(11): 1535. https://doi.org/10.3390/met10111535
[4] Ranjekar, A.M., Yadav, G.D. (2021). Steam reforming of methanol for hydrogen production: A critical analysis of catalysis, processes, and scope. Industrial & Engineering Chemistry Research, 60(1): 89-113. https://doi.org/10.1021/acs.iecr.0c05041
[5] Lv, Y., Liu, F., Wang, Y., Gong, Y., Zhou, J., Sui, J. (2024). Efficient hydrogen production through a novel methanol steam reforming system coupled with a two-stage heat pump and carbon capture: A thermodynamic and thermoeconomic study. International Journal of Hydrogen Energy, 88: 858-877. https://doi.org/10.1016/j.ijhydene.2024.09.234
[6] Panchuk, A., Panchuk, M., Sładkowski, A., Kryshtopa, S., Kryshtopa, L. (2024). Methanol potential as an environmentally friendly fuel for ships. NAŠE MORE: Znanstveni časopis za more i pomorstvo, 71(2): 75-83. https://doi.org/10.17818/NM/2024/2.5
[7] Sollai, S., Porcu, A., Tola, V., Ferrara, F., Pettinau, A. (2023). Renewable methanol production from green hydrogen and captured CO2: A techno-economic assessment. Journal of CO2 Utilization, 68: 102345. https://doi.org/10.1016/j.jcou.2022.102345
[8] Farhan, S.M., Wang, P., Yin, J., Chen, Z. (2025). Emerging trends in innovative catalysts for methanol steam reforming for hydrogen production: A review of recent advances. Energy, 332: 137042. https://doi.org/10.1016/j.energy.2025.137042
[9] He, J., Guo, S., Zeng, H., et al. (2026). Design and optimization of an integrated system for efficient methanol-to-hydrogen conversion. Applied Thermal Engineering, 294: 130566. https://doi.org/10.1016/j.applthermaleng.2026.130566
[10] Xing, S., Zhao, C., Ban, S., Liu, Y., Wang, H. (2020). Thermodynamic performance analysis of the influence of multi-factor coupling on the methanol steam reforming reaction. International Journal of Hydrogen Energy, 45(11): 7015-7024. https://doi.org/10.1016/j.ijhydene.2019.12.192
[11] Zhang, H., Yang, Y., Li, C., Li, Q., Liu, H., Huang, Z. (2024). Investigation on a combined system with methanol on-board hydrogen production and internal combustion engine. Fuel, 375: 132586. https://doi.org/10.1016/j.fuel.2024.132586
[12] Nehe, P., Reddy, V.M., Kumar, S. (2015). Investigations on a new internally-heated tubular packed-bed methanol–steam reformer. International Journal of Hydrogen Energy, 40(16): 5715-5725. https://doi.org/10.1016/j.ijhydene.2015.02.114
[13] Nehe, P., Kumar, S. (2013). Methanol reformation for hydrogen production from a single channel with cavities. International Journal of Hydrogen Energy, 38(30): 13216-13229. https://doi.org/10.1016/j.ijhydene.2013.07.119
[14] Özcan, O., Akın, A.N. (2019). Thermodynamic analysis of methanol steam reforming to produce hydrogen for HT-PEMFC: An optimization study. International Journal of Hydrogen Energy, 44(27): 14117-14126. https://doi.org/10.1016/j.ijhydene.2018.12.211
[15] Achomo, M.A., Muthukumar, P., Peela, N.R. (2025). Thermodynamic, energy and exergy analysis of steam reforming of methanol for hydrogen production. International Journal of Hydrogen Energy, 149: 150040. https://doi.org/10.1016/j.ijhydene.2025.150040
[16] Li, Y., Ma, Z., Qi, Z., Xue, Z., Zhou, X., Guo, H. (2025). Investigation of methanol steam reforming reactors with different catalyst support structures on hydrogen production efficiency and methanol conversion. Fuel, 393: 135079. https://doi.org/10.1016/j.fuel.2025.135079
[17] Gao, F., Zhan, H., Zeng, Z. (2023). A methanol autothermal reforming system for the enhanced hydrogen production: Process simulation and thermodynamic optimization. International Journal of Hydrogen Energy, 48(5): 1758-1772. https://doi.org/10.1016/j.ijhydene.2022.10.067
[18] Agrawal, K., Sharma, S., Kumar, B., Verma, P. (2024). Hydrogen an environmental revolution toward clean energy transition: A green concept for current and future perspectives. Clean Technologies and Environmental Policy, 27(2): 607-648. https://doi.org/10.1007/s10098-024-03015-6
[19] Zahid, U., Khalafalla, S.S., Alibrahim, H.A., Ahmed, U., Jameel, A.G.A. (2023). Techno-economic evaluation of simultaneous methanol and hydrogen production via autothermal reforming of natural gas. Energy Conversion and Management, 296: 117681. https://doi.org/10.1016/j.enconman.2023.117681
[20] Cao, Y., Bai, Y., Du, J. (2025). Numerical simulation of hydrogen production from co-gasification of biomass and refuse-derived fuel using ASPEN Plus. International Journal of Hydrogen Energy, 165: 150928. https://doi.org/10.1016/j.ijhydene.2025.150928
[21] Adil, A., Shivapuji, A.M., Rao, L. (2022). Thermodynamic analysis for methanol synthesis using biomass-derived syngas. Biomass Conversion and Biorefinery, 12(5): 1819-1834. https://doi.org/10.1007/s13399-022-02338-y
[22] Rostami, M., Farajollahi, A.H., Amirkhani, R., Farshchi, M.E. (2023). A review study on methanol steam reforming catalysts: Evaluation of the catalytic performance, characterizations, and operational parameters. AIP Advances, 13(3): 030701. https://doi.org/10.1063/5.0137706
[23] Tabat, M.E., Omoarukhe, F.O., Güleç, F., et al. (2023). Process design, exergy, and economic assessment of a conceptual mobile autothermal methane pyrolysis unit for onsite hydrogen production. Energy Conversion and Management, 278: 116707. https://doi.org/10.1016/j.enconman.2023.116707
[24] Hu, C., Xu, C., Xi, X., He, Y., Wang, T. (2024). Thermodynamic and techno-economic performance comparison of methanol aqueous phase reforming and steam reforming for hydrogen production. Energies, 18(1): 81. https://doi.org/10.3390/en18010081
[25] Mosayebi, A., Eghbal Ahmadi, M.H. (2022). Combined steam and dry reforming of methanol process to syngas formation: Kinetic modeling and thermodynamic equilibrium analysis. Energy, 261: 125254. https://doi.org/10.1016/j.energy.2022.125254
[26] Silva, J., Rocha, C., Soria, M.A., Madeira, L.M. (2022). Catalytic steam reforming of biomass-derived oxygenates for H2 production: A review on Ni-based catalysts. ChemEngineering, 6(3): 39. https://doi.org/10.3390/chemengineering6030039