Yasheng Wang
© 2026 The author. This article is published by IIETA and is licensed under the CC BY 4.0 license (http://creativecommons.org/licenses/by/4.0/).
OPEN ACCESS
High-rise buildings exhibit complex structural configurations, leading to thermodynamic evolution and fluid spread patterns of fire smoke that differ significantly from those in single-story structures. Full-scale fire experiments face considerable challenges in reproducing realistic flow fields and heat transfer processes. To quantitatively characterize the coupled effects of ambient wind, fire source, and building openings on smoke heat transfer and flow behavior, this study adopts a typical 25-story office building as a prototype. A high-fidelity numerical simulation framework was established by integrating Building Information Modeling (BIM)-based refined 3D geometric modeling with Pyrosim and the Fire Dynamics Simulator (FDS) solver, enabling the systematic capture of time-dependent temperature fields in corridors and vertical smoke flow evolution throughout the fire course. Through multi-scenario comparative analysis, the regulatory mechanisms of three key variables—fire heat release rate (HRR), window aspect ratio of the fire compartment, and headwind speed—on smoke spill plume heat transfer and buoyant diffusion were quantitatively investigated. The results indicate that the proposed BIM-FDS coupled modeling approach accurately reproduces smoke convective heat exchange and multiphase fluid transport under the constraints of vertical shafts and partition obstructions, outperforming conventional simplified numerical models in simulation fidelity. An increase in fire power synchronously enhances smoke convective heat flux, expands the coverage of high-temperature fields, and aggravates the vertical transport of toxic components. Smoke spillage and external heat transfer are governed by the coupling of indoor thermal buoyancy and external positive wind pressure: at low wind speeds, enhanced entrainment intensifies convective heating and smoke accumulation in upper adjacent rooms, whereas high wind speeds counteract thermal buoyancy through dynamic pressure, significantly suppressing vertical heat transfer and interlayer smoke diffusion. Exterior façade plume temperature exhibits a stratified attenuation pattern along the horizontal distance, while CO concentration demonstrates a high synchronous thermodynamic response to flow field temperature and convection intensity. The revealed smoke heat transfer and fluid dynamic evolution laws provide quantitative thermodynamic data for thermal safety design and smoke control strategies in high-rise buildings, offering theoretical insight into the coupled heat-mass transfer mechanism between ambient wind and fire-induced smoke.
thermodynamics, convective heat transfer, high-rise building smoke movement, wind environment, Pyrosim, Building Information Modeling, fire dynamics simulation
High-rise buildings are characterized by large volume and high occupant density, making fires prone to causing major casualties and property losses. High-temperature smoke spilling from the fire compartment spreads along interior and exterior façades and is significantly affected by outdoor wind. Studying the laws of smoke spillage and transport can provide theoretical support for the optimization of building smoke control technologies.
At present, extensive research has been conducted on building fire smoke movement using Computational Fluid Dynamics (CFD), resulting in substantial progress in the numerical characterization of thermally driven flow and transport processes. More broadly, recent multiphysics studies have demonstrated the value of numerical frameworks that account for interacting flow and heat-transfer mechanisms when analyzing complex thermal-fluid systems [1]. Parsa et al. [2] systematically reviewed various CFD numerical simulation methods and application scenarios for compartment fires, comparing the adaptability of mainstream simulation tools. Ionescu et al. [3] relied on FDS simulation to investigate the regulatory laws of fire location and ventilation strategies on indoor smoke distribution, providing a numerical basis for smoke exhaust design in enclosed buildings.
Some scholars have carried out refined smoke simulation studies for special buildings and scenarios. Tao et al. [4] constructed a vortex-particle-based detail-enhanced simulation algorithm for ship fire smoke, solving the problem of smoke distortion under low-resolution grids. Sun et al. [5] conducted theoretical and numerical simulations on fires in large-span space structures, revealing the unique evolution laws of smoke stratification and spread under large-space conditions. Wu et al. [6] reviewed human exposure hazards to smoke in underground spaces, clarifying the coupling mechanism of smoke poisoning and thermal injury in confined restricted spaces.
Regarding numerical algorithms for multi-scenario fire smoke and engineering ventilation optimization, many scholars have conducted research in subdivided directions. Wang et al. [7] used numerical simulation to simulate the trajectory of smoke particulate motion, improving the calculation model for fire fine particulate matter diffusion. Ivanov et al. [8] conducted numerical experiments on atrium buildings, proposed an optimization scheme for sustainable natural smoke exhaust systems, and quantified the improvement effect of different ventilation opening sizes on smoke layer height. Moinuddin et al. [9] carried out full-scale water mist fire suppression tests, clarifying effective working conditions for water mist in suppressing hydrocarbon fire smoke diffusion through numerical and experimental comparisons. Zhao and Ren [10] and Zhou and Wang [11] established a ventilation network fire computer simulation model to simulate the dispersion characteristics of harmful smoke under different wind directions and wind speeds. Gao and Yang [12] investigated the temperature field distribution of surrounding rock, clarifying the influence mechanism of high-temperature smoke heat dissipation on the radius of the underground cooling zone. Zhang and Liu [13] optimized ventilation network regulation strategies under fire conditions. Liu and Wang [14] established a Building Information Modeling (BIM)-FDS coupled simulation model and carried out full-process simulation of indoor fire smoke spread in a multi-story teaching building. Zhang et al. [15] analyzed the mechanism of smoke backflow into stairwells induced by fire in adjacent rooms, quantifying the correlation between shaft suction effect and smoke filling rate. Filippi et al. [16] constructed a fire–atmosphere coupled model to simulate long-range transport of wildfire smoke, providing a theoretical reference for large-scale wind–smoke coupling analysis around buildings.
Existing studies mostly focus on smoke movement driven by internal buoyancy and mechanical ventilation, and systematic analysis targeting the coupling effect of external ambient wind is still insufficient. Waly et al. [17] experimentally studied the fire safety separation distance between structures under different wind speed conditions, confirming that ambient wind speed and direction significantly alter smoke diffusion paths. Hayajneh and Naser [18], from the perspective of fluid dynamics, analyzed the synergistic effect of wind field and slope on fire spread for wildland fires. However, the coupling mechanism among external incoming wind, indoor buoyancy, and stack effects in buildings, together with the critical conditions governing smoke backflow under different operating scenarios, has not yet been fully quantified. The analysis of such interacting mechanisms requires a coupled numerical framework capable of resolving thermal transport and fluid-flow responses under complex geometric and boundary conditions, an approach increasingly adopted in multiphysics engineering analysis [19].
In view of this, this paper carries out a numerical study on building fire smoke movement under the action of ambient wind, clarifying the influence laws of wind field parameters on smoke stratification, diffusion, and smoke exhaust performance, and improving building fire smoke prevention and control theory. Comprehensively considering factors such as on-site openings, temperature, and surrounding wind environment during fire occurrence, a typical 25-story public office building is taken as an example. BIM is used to establish a refined building numerical model, Pyrosim software is used to create the fire model, and analysis is conducted from multiple aspects including fire smoke layer height, temperature, and external wind, so as to provide a theoretical basis for fluid dynamic analysis of fire smoke flow and outdoor wind environment in large public buildings.
2.1 Theory of fire smoke spread
In the early stage of a fire, a small amount of smoke rises upward and accumulates under the ceiling of the fire compartment. As the fire grows and enters the fully developed combustion stage, a large amount of smoke is generated. Driven by fire dynamics and pressure imbalance, smoke begins to gush out of the fire compartment and spread toward the corridor, rapidly filling the entire building. Generally speaking, the main factors causing smoke movement inside buildings include the stack effect, external wind action, and heating, ventilation, and air conditioning systems.
(1) Stack Effect
Inside vertical shafts such as stairwells, elevator shafts, and utility shafts in a building, when the indoor temperature is higher than the outdoor temperature, air and smoke naturally rise. This phenomenon is called the stack effect. Under standard atmospheric pressure, the pressure difference generated by the stack effect can be expressed by the following formula:
$\Delta P=K_s\left(\frac{1}{T_0}-\frac{1}{T_i}\right) h$ (1)
In the formula, ΔP denotes the pressure difference; Ks is the coefficient, 3460 $P a \cdot K / m$; $T_0$ is the outside air temperature; $T_i$ is the air temperature inside the shaft; h denotes the distance from the neutral plane.
(2) External Wind Action
Under the action of external wind, a pressure difference is generated between the windward side and the leeward side of the building: the pressure on the windward side increases, and smoke spreads rapidly; on the leeward side, smoke spills out of the fire compartment through natural exhaust, and smoke spreads slowly inside the building.
(3) Influence of Heating, Ventilation, and Air Conditioning Systems
In the initial stage of fire development, heating, ventilation, and air conditioning systems may help occupants detect the fire. However, after entering the fully developed fire stage, heating, ventilation, and air conditioning systems not only rapidly propagate smoke but also deliver fresh air to the combustion zone, intensifying the fire. Therefore, heating, ventilation, and air conditioning systems should be shut down promptly once a fire is detected.
2.2 Principle of fire dynamics simulator numerical calculation method
FDS, namely Fire Dynamics Simulator, takes fluid dynamics as the theoretical basis and can simulate the variation laws of smoke concentration and temperature in fire accidents. The principle applied by this software is Newton’s laws, which essentially involves solving partial differential equations in terms of mass, momentum, and energy. The specific expressions are as follows:
Mass conservation equation:
$\frac{\partial \rho}{\partial t}+\nabla \cdot \rho u=0$ (2)
Momentum conservation equation:
$\rho\left(\frac{\partial u}{\partial t}+(u \cdot \nabla) u\right)+\nabla p=p g+f+\nabla \tau$ (3)
Species conservation equation:
$\frac{\partial}{\partial \mathrm{t}}\left(\rho Y_l\right)+\nabla \cdot \rho Y_l u=\nabla \cdot \rho D_l \nabla Y_l+m_l^m$ (4)
Energy conservation equation:
$\begin{aligned} & \frac{\partial}{\partial \mathrm{t}}(\rho h)+\nabla \cdot \rho h u=\frac{D p}{D t}-\nabla \cdot q_r +\nabla \cdot k \nabla t+\sum_L \nabla \cdot h_l \rho D_l \nabla Y_l\end{aligned}$ (5)
In the formulas, ρ denotes the mass per unit volume of fluid; t denotes time; u denotes the velocity vector; g denotes gravitational acceleration; f denotes the externally applied force vector; τ denotes the viscous stress tensor; p denotes pressure; Y denotes the concentration of the l-th species; Dl denotes the diffusion coefficient of the l-th species; $m_l^m$ denotes the production rate of the l-th species per unit volume; h denotes enthalpy; $q_r$ denotes radiative heat flux; T denotes temperature.
In terms of numerical solution, this study adopts the second-order finite difference method and a staggered grid system to discretize the filtered governing equations, and a second-order explicit predictor–corrector scheme is used for the time variable.
The time discretization of the governing equations is calculated starting from the ambient initial conditions. Before each computational time step, the variable density $\rho^n$, species mass fraction $Y_\alpha^n$, velocity $\vec{u}^n$, the modified pressure term $h^n$, and the background pressure $\bar{p}_m^n$ of the domain $m$ are known, and all variables can be obtained from them. In the derivations below, the superscript $(n+1)_e$ refers to the estimated value of the variable at the $(n+1)$-th time step.
(1) The thermodynamic variables Y and mp at the n+1 time step are estimated using the explicit Euler scheme, for example, density is estimated as:
$\rho^{(n+1)}=\rho^n-\delta t\left(\vec{u}^n \cdot \nabla \rho^n+\rho^n \nabla \cdot \vec{u}^n\right)$ (6)
(2) Assuming the velocity components at boundaries are known, the divergence is solved from the estimated thermodynamic values according to the following formula:
$\begin{aligned} & (\nabla \cdot \vec{u})=\frac{1}{\rho c_p T}\left(q^m-\nabla \cdot q\right) \\ & +\left(\frac{1}{\rho c_p T}-\frac{1}{p_o}\right) \frac{d p_o}{d t} \frac{M}{\rho} \sum_l \nabla \cdot \rho D_t \nabla\left(Y_l / M\right) \\ & -\frac{1}{\rho c_p T} \sum_l h_l \nabla \cdot \rho D_l \nabla Y_t+\frac{1}{\rho} \sum_l\left(\frac{M}{M_L}-\frac{h_l}{c_p T}\right) m_l^m\end{aligned}$ (7)
(3) The pressure expressed by the Poisson equation can be solved directly:
$\nabla^2 h^{(n+1),}=-\left[\frac{(\nabla \cdot \vec{u})^{(n+1)_c}-(\nabla \cdot \vec{u})^n}{\delta t}\right]-\nabla \cdot \vec{F}^n$ (8)
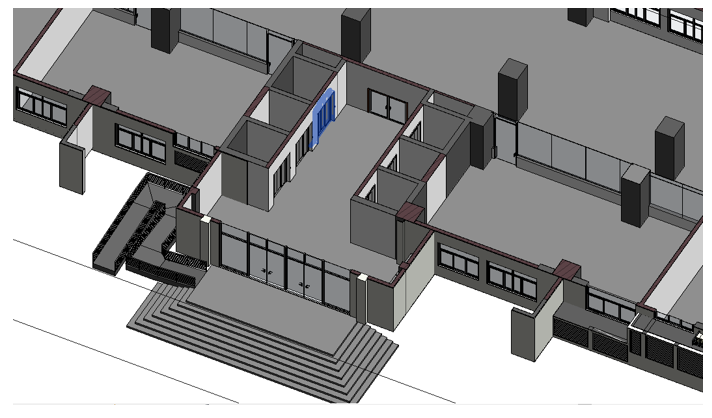
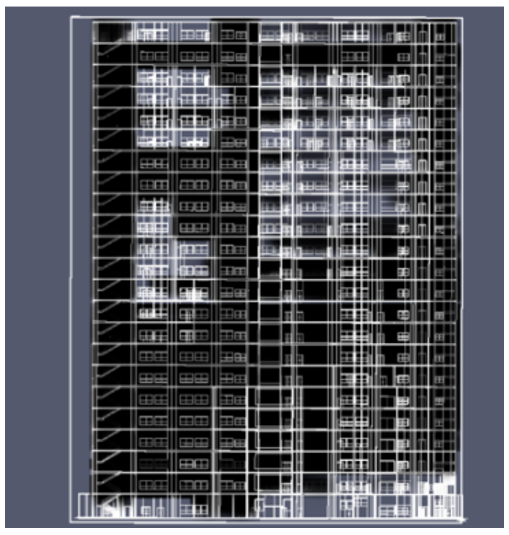
The BIM model can provide an accurate, comprehensive evacuation environment model that is identical to the actual situation for emergency evacuation simulation of high-rise buildings. In actual evacuation simulation, individual building components such as beams, slabs, columns, and walls cannot function independently; they need to be assembled in BIM to form a complete evacuation space, such as corridors, halls, classrooms, stairs, and exits, so as to exert an influence on the evacuation process. The BIM model of the hall level for evacuation is shown in Figure 1.
Figure 1. Building Information Modeling (BIM) evacuation model of the hall level of Mingyuan Building
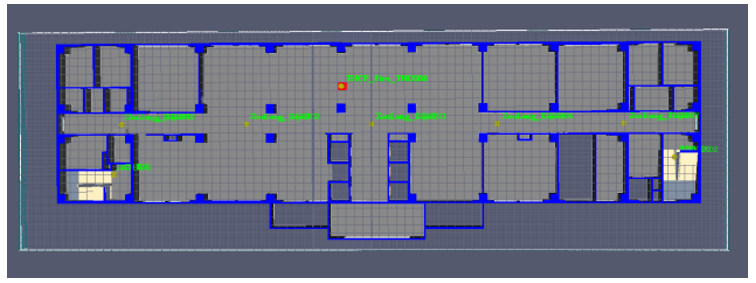
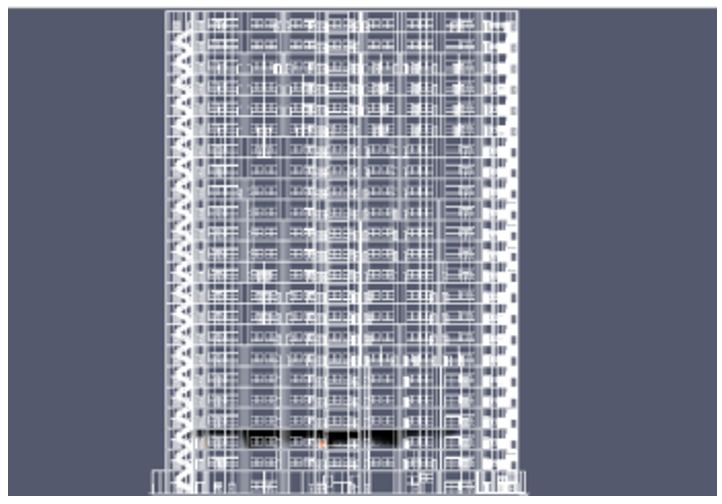
The refined BIM model is imported into Pyrosim to form the numerical model. The building has 25 floors in total, with each floor 76 m long, 19 m wide, and 4.3 m high. Each floor is divided into four sections by the corridor and the atrium, as shown in Figure 2. The upper-left area has two rooms, the upper-right area has three rooms, and the whole area contains 12 independent spaces. At both ends of the floor, there is one staircase respectively, serving as natural smoke vents, through which smoke diffuses from the stairwell to various floors of the non-fire area.
This project adopts a fast $t^2$ fire as the fire source type. A fire point is preset in the open area of the third-floor atrium. Two working conditions are set for the fire source: Working Condition 1 is a 1.5 MW fast $t^2$ fire, and Working Condition 2 is a 6 MW fast $t^2$ fire. According to the formula relating fire HRR Q and $t^2$:
$Q=\alpha t^2$ (9)
Figure 2. Floor sectional plan
Table 1. Fire growth coefficients
|
Fire Type |
Fire Growth Coefficient α |
|
Slow fire |
0.002931 |
|
Medium fire |
0.01127 |
|
Fast fire |
0.04689 |
|
Ultra-fast fire |
0.1878 |
This project simulates a fast fire, taking α = 0.04689 (Table 1). The calculated time to reach a fire power of 1.5 MW is 176.78 s, and the time to reach 6 MW is 353.55 s.
Based on the above data, the simulation environment is set up in Pyrosim to analyze smoke spread, toxic gas concentration, and temperature field distribution inside the building under fire conditions, so as to obtain the fire smoke spread law under the simulated conditions.
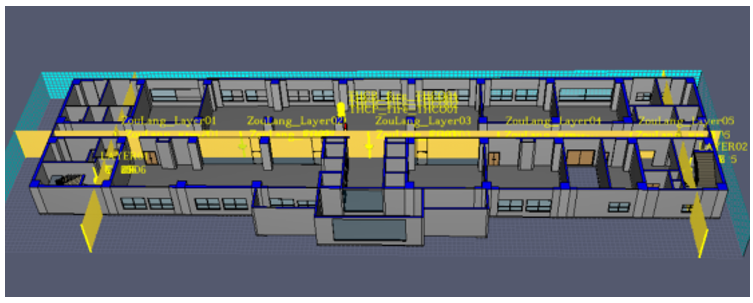
Referring to other performance-based design schemes for office building fire simulation, the duration is generally controlled at 25 min–30 min; therefore, the numerical simulation time for this office building fire is set to 1800 s. Meanwhile, to facilitate post-processing and data analysis after FDS calculation, measurement points are set at 15 m intervals in the corridor on the fire floor (3rd floor), with a total of 5 measurement points in the corridor. Four measurement points are set at 1 m, 1.8 m, 2.6 m, and 3.2 m directly above the fire source, and one measurement point is set in each of the left and right stairwells on each floor. All measurement points are located 2 m above the ground. One slice is set at the corridor centerline Y = 19 m, and one slice is set in each stairwell at X = –32 m and X = 33.5 m, as shown in Figure 3.
Figure 3. Distribution of measurement points and slices
In the material module of Pyrosim, this study refinedly sets core thermophysical parameters—density, thermal conductivity, specific heat at constant pressure, and emissivity—for four types of building envelope components: reinforced concrete floor/vertical shafts, aerated concrete partition walls, single-layer external glass windows, and metal components. Parameter calibration is completed by combining corridor and stairwell temperature time-series curves under 1.5 MW and 6 MW fire conditions with façade plume temperature stratified attenuation contours: the main concrete adopts a thermal conductivity of 1.74 W/(m·K) and specific heat of 880 J/(kg·K) to match long-term heat storage and release of high-power fires and continuous temperature rise in multi-story stairwells; lightweight aerated partition walls adopt a low thermal conductivity of 0.22 W/(m·K) to block lateral heat conduction and restore the spread law of smoke dominantly diffusing vertically along elevator shafts; external window glass is set with a thermal conductivity of 0.76 W/(m·K) to accurately reproduce differences in window spill heat transfer under different positive wind speeds and the trend of temperature and CO concentration in adjacent upper rooms first rising then sharply dropping; metal components are configured with a high thermal conductivity of 45.0 W/(m·K) to characterize local rapid conductive heat exchange. All thermophysical parameters are bound to the refined BIM geometric model and jointly participate in FDS solid transient heat conduction, convection, and radiation coupled solving, effectively avoiding temperature field and smoke diffusion distortion caused by adopting uniform single-material parameters in traditional simulations. This is the key foundation for realizing high-precision reproduction of the whole heat-mass transfer process of high-rise building fires by BIM-FDS co-simulation.
4.1 Analysis of results under working condition 1
Scenario 1 simulates the working condition with a fire source power of 1.5 MW, and the fire location is at the 3rd-floor atrium. Except for the fire compartment, doors of all other rooms are closed, the exterior door on the first floor is open, and external windows on all floors are open. To simulate inter-floor smoke diffusion, the elevator shaft and stairwell entrances are opened.
4.1.1 Smoke spread
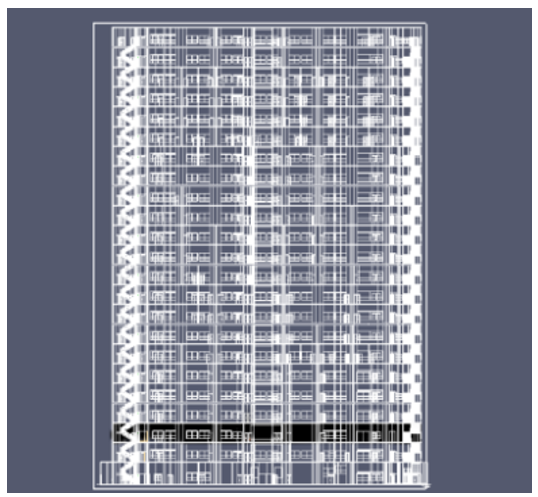
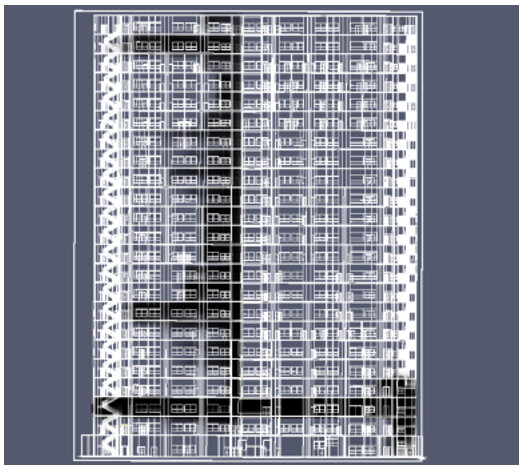
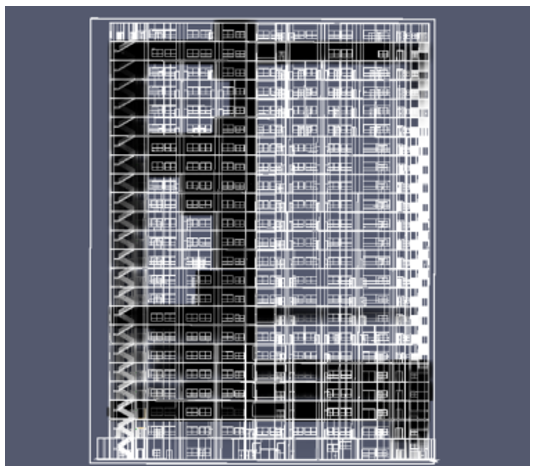
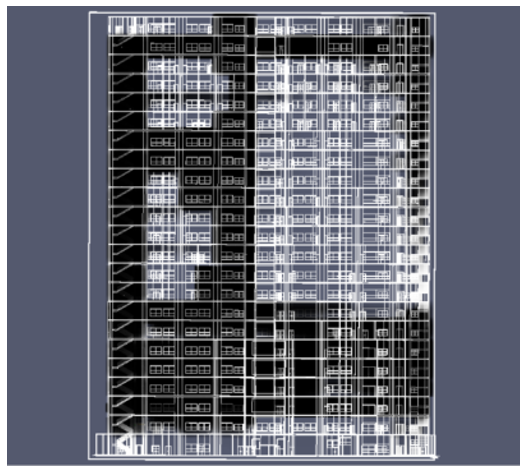
Figures 4–9 show that smoke first fills the 3rd floor, reaches the top floor via the elevator shaft, and then spreads downward along the left staircase. Affected by the shaft location, smoke spread in the right staircase lags behind, and the right stairwell is still not completely filled with smoke even at 1800 s.
Figure 4. Smoke spread diagram at t = 100 s
Figure 5. Smoke spread diagram at t = 200 s
Figure 6. Smoke spread diagram at t = 400 s
Figure 7. Smoke spread diagram at t = 800 s
Figure 8. Smoke spread diagram at t = 1200 s
Figure 9. Smoke spread diagram at t = 1800 s
From an overall perspective, the smoke spread pattern presents an upward propagation from the middle elevator shaft, and after reaching the top floor, a downward propagation along the two side staircases.
4.1.2 Heat release rate
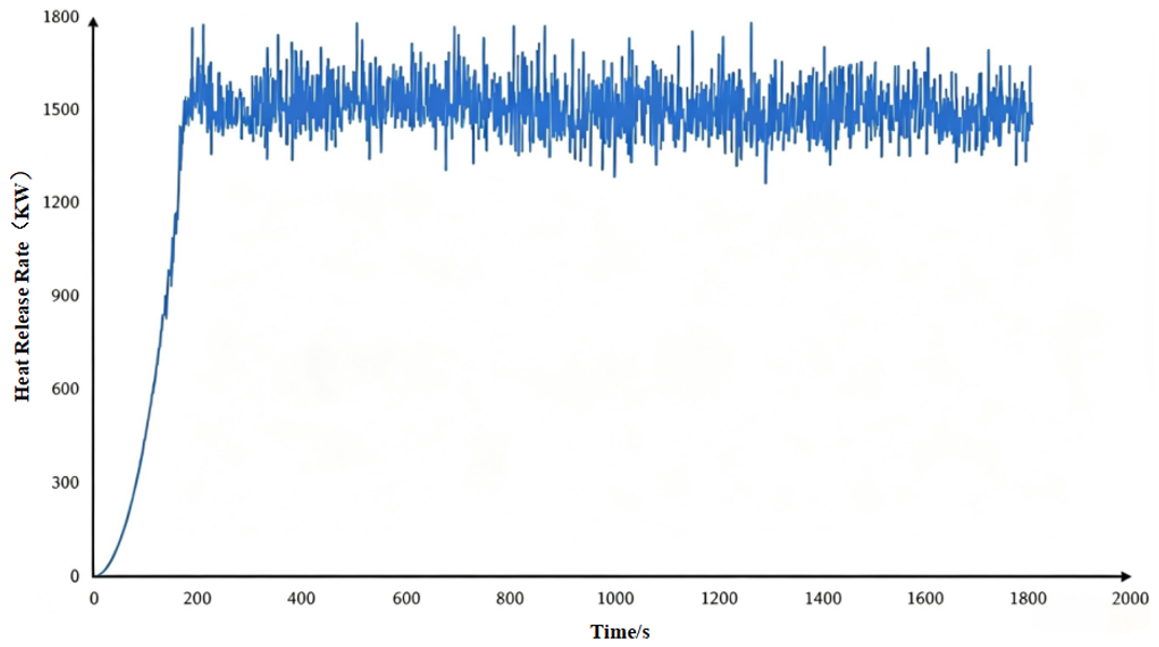
The variation of HRR during the building simulation is shown in Figure 10.
Figure 10 shows that the HRR reaches 1.5 MW at 170 s and fluctuates around this value, indicating that the simulation working condition is consistent with the model assumption.
Figure 10. Variation of heat release rate (HRR) with time
4.1.3 Temperature variation law with time
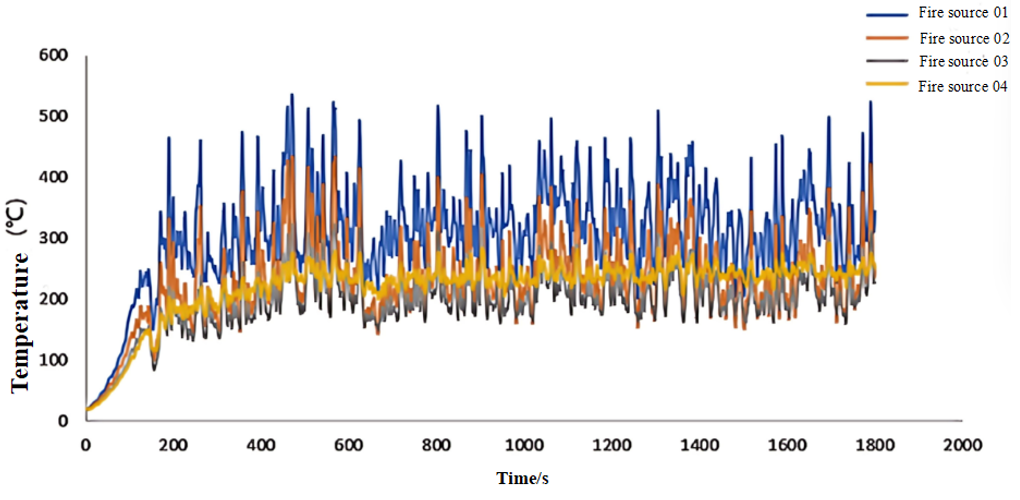
The temperature variation law above the fire source with time is shown in Figure 11. From which, it can be seen that Measurement Point 1 is closest to the fire source and has the highest temperature; its temperature variation trend is basically synchronized with the fire HRR and tends to stabilize after 170 s, with a flame peak temperature of 530 ℃. The temperatures at the remaining measurement points decrease gradually with increasing distance from the fire source.
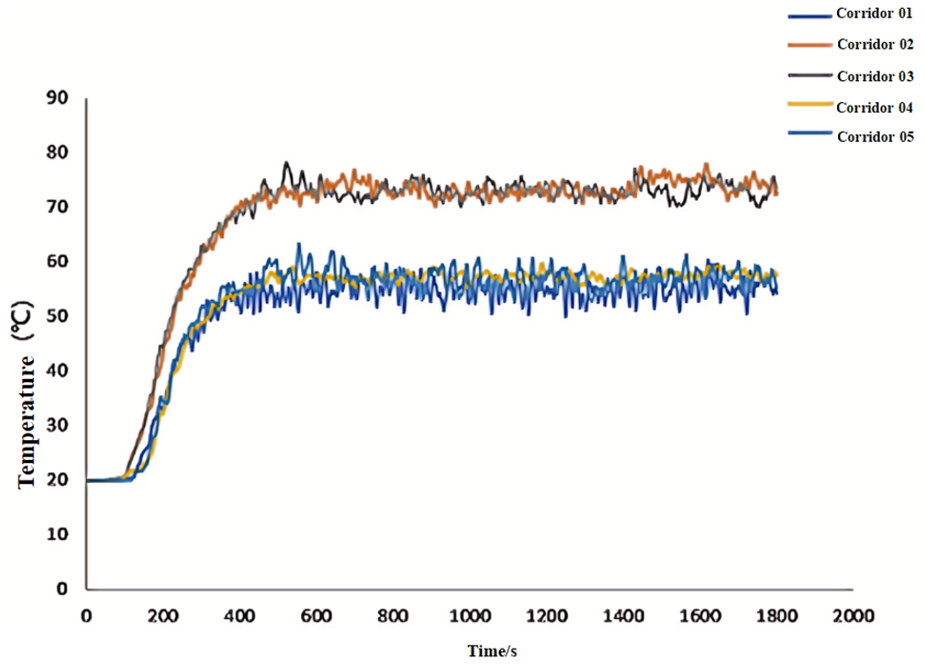
The temperature variation law in the 3rd-floor corridor during the simulation is shown in Figure 12.
Figure 11. Temperature variation trend at the fire source location
Figure 12. Temperature variation trend with time in the 3rd-floor corridor
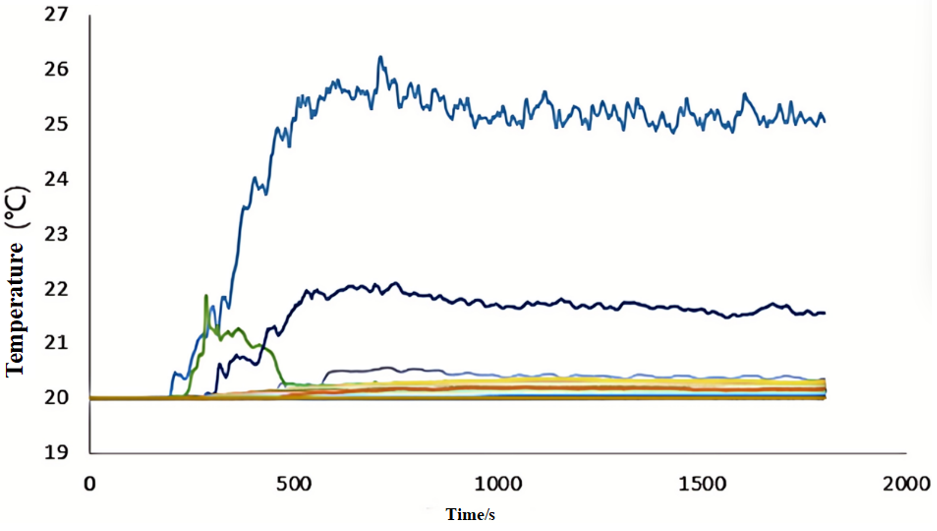
Figure 13. Temperature variation trend with time in floor stairwells
Figure 12 shows that the corridor smoke temperature rises rapidly from 200 s to 400 s after ignition and then tends to stabilize. Measurement Points 2 and 3 in the atrium reach the 60 ℃ danger threshold at 300 s and stabilize at 75 ℃, while the temperatures at the remaining measurement points do not exceed the critical value. Since smoke mainly flows toward the elevator shaft, it is recommended that personnel evacuate the atrium corridor within 300 s.
The temperature variation law in the stairwells of all floors within 1800 s during the simulation is shown in Figure 13.
Figure 13 shows that only the stairwell on the 3rd floor experiences a significant smoke temperature rise, while the temperature rise on other floors is weak, with a temperature difference of less than 1 ℃ throughout the process. After rising to the top floor via the elevator shaft, the smoke flows back downward, continuously cooling during transport, and the temperature is close to room temperature when reaching the stairwells on each floor; therefore, the temperature change is not obvious.
Combined with the FDS momentum and energy conservation equations, the temperature characteristics can be explained: the low-power fire source has a relatively small energy source term, resulting in limited internal energy increment of smoke, so the corridor steady-state temperature is only 75 ℃; in the momentum equation, thermal buoyancy drives smoke to rise along the shaft and then slowly backflow, but the airflow momentum is insufficient, making it difficult for heat to be transported upward across floors, so only the stairwell on the fire floor shows an obvious temperature rise. The simulated temperature curve is consistent with the solution law of the conservation equation system.
4.2 Analysis of results under working condition 2
Scenario 2 simulates the working condition with a fire source power of 6 MW, while the remaining conditions remain unchanged.
4.2.1 Smoke spread
Figures 14–19 show that smoke first fills the 3rd floor, rises to the top floor through the elevator shaft, and then spreads downward along the left staircase; at 800 s, smoke covers the 4th and 5th floors. Affected by the shaft location, smoke spread in the right staircase lags behind; by 1800 s, all stairwells are filled with smoke, and most areas of the building are shrouded in dense smoke.
Figure 14. Smoke spread diagram at t = 100 s
Figure 15. Smoke spread diagram at t = 200 s
Figure 16. Smoke spread diagram at t = 400 s
Figure 17. Smoke spread diagram at t = 800 s
Figure 18. Smoke spread diagram at t = 1200 s
Figure 19. Smoke spread diagram at t = 1800 s
4.2.2 Heat release rate
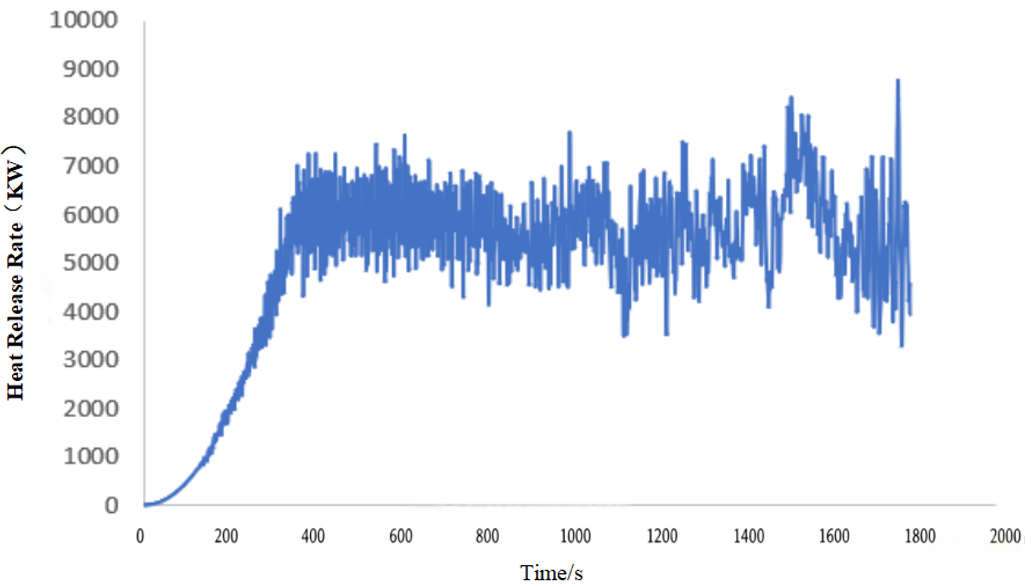
The variation of HRR during the building simulation is shown in Figure 20.
Figure 20. Variation of heat release rate (HRR) with time
Figure 20 shows that the HRR reaches 6 MW at 400 s and fluctuates within this range, which is consistent with the model assumption; after 1500 s, affected by insufficient oxygen supply and incomplete combustion, the fire power decreases to some extent.
Figures 10 and 20 are the HRR curves of the 1.5 MW and 6 MW fast t² fires, respectively. The difference between the curves is a visual reflection of the indoor heat budget balance of the building under the coupling of fire heat generation, envelope heat storage, convective heat dissipation, and ambient wind.
In the early ignition stage, the HRR shows a quadratic growth; the temperature difference between the envelope and the indoor air is small, heat dissipation is weak, and heat continuously accumulates. Under the 1.5 MW working condition, the rated power is reached at 170 s, with a low total heat output, and the walls and shaft do not reach heat storage saturation, so the fire source and corridor temperature rise gently. Under the 6 MW working condition, the target is reached at 400 s; the instantaneous heat output is four times that of the former, with a flame peak temperature of 950 ℃, and the envelope heat storage load is significantly higher.
After the power stabilizes, the building forms a “heat generation–heat storage–multi-path heat dissipation” system, and the slight fluctuation of the curve originates from instantaneous airflow and oxygen supply disturbances. Heat dissipation paths include: heat conduction and storage in the envelope—the corridor steady-state temperature under the high-power condition is 150–180 ℃, far higher than 75 ℃ under the low-power condition; convective heat exchange at shafts and windows, smoke transported upward by the elevator shaft and backflow downward through stairs; at a low wind speed of 2 m/s, smoke spills out and entrains heat to the second floor; at a high wind pressure of 4 m/s, smoke plume spillage is suppressed and heat is confined to the fire floor; radiative heat exchange from flames—the higher the power, the faster the heat storage; smoke interlayer transport heat dissipation—under 1.5 MW only the third-floor stairwell warms up, while under 6 MW heat diffuses to floors 4–9.
After 1500 s under the 6 MW condition, the HRR decays because heat dissipation exceeds heat generation: envelope heat storage saturates and continues to release heat, indoor oxygen deficiency causes incomplete combustion, CO peak concentration is twice that of the low-power condition, and dense smoke covering the whole building expands the heat dissipation area. Under the 1.5 MW condition, oxygen supply is sufficient, the envelope is not saturated, heat generation always exceeds heat dissipation, and the HRR remains stable throughout.
Positive wind speed regulates façade smoke spillage heat dissipation and building heat storage: at a low wind speed of 2 m/s heat accumulates on the second floor with obvious CO accumulation; at a high wind pressure of 4 m/s vertical smoke spillage is blocked, and no obvious temperature rise or toxic gas accumulation occurs on upper floors.
In summary, fire power determines the heat accumulation rate and the upper limit of heat storage; the envelope, shaft, and external windows form a multi-layer heat dissipation system; ambient wind regulates thermal balance through the façade smoke plume; together they determine the fire temperature field and toxic smoke distribution, providing a thermodynamic basis for high-rise building smoke suppression and temperature control design.
4.2.3 Temperature variation law with time
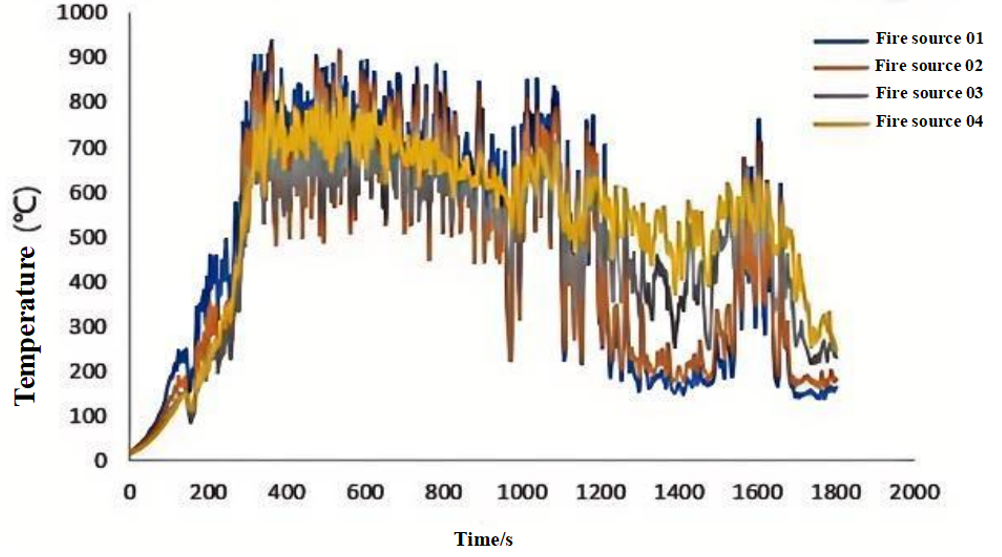
The temperature variation law above the fire source with time is shown in Figure 21.
Figure 21. Temperature variation trend at the fire source location
Measurement Point 1 near the fire source has the highest temperature; its temperature variation is consistent with the trend of the HRR, stabilizes after 400 s, and reaches a peak temperature of 950 ℃. After 1200 s, due to insufficient oxygen supply inside the building, combustion weakens and the temperature gradually drops.
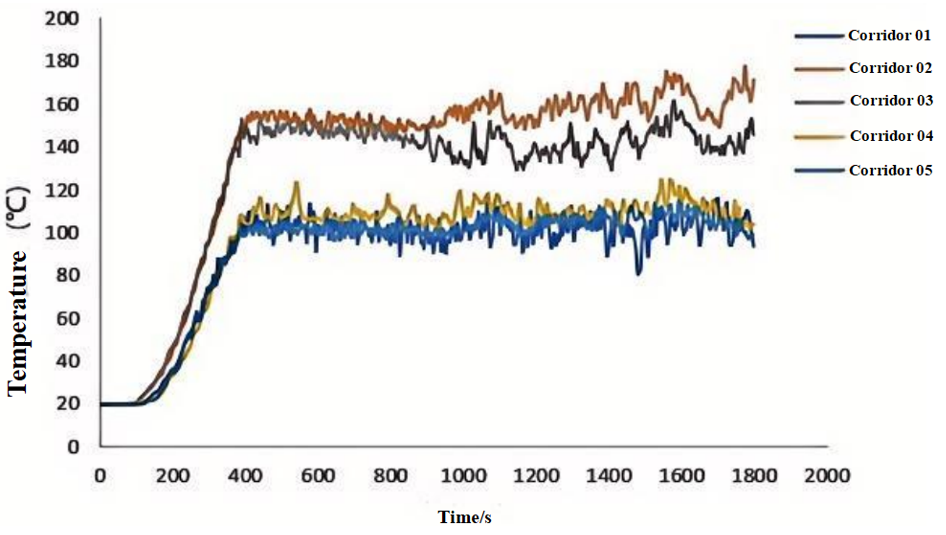
The temperature variation law in the 3rd-floor corridor during the simulation is shown in Figure 22.
Figure 22. Temperature variation trend with time in the 3rd-floor corridor
Figure 22 shows that within 200 s after ignition, the fire power keeps increasing but the corridor temperature does not change obviously. From 200 s to 400 s, the smoke temperature rises rapidly and tends to stabilize after 400 s.
The temperature variation law in the stairwells of all floors within 1800 s during the simulation is shown in Figure 23.
Figure 23 shows that only the stairwells on the 3rd and 4th floors exceed the 60 ℃ smoke temperature threshold; the 3rd-floor temperature reaches a peak of 100 ℃ at 1500 s.
Figure 23. Temperature variation trend with time in floor stairwells
Based on the conservation equations, the high-power high-temperature heat storage mechanism can be explained: under the 6 MW condition, the energy source term is greatly increased, smoke internal energy accumulates rapidly, and the flame peak reaches 950 ℃; enhanced thermal buoyancy increases the momentum of the smoke flow field, allowing heat to diffuse across multiple floors and be stored by the concrete envelope. In the later stage, envelope heat storage saturates and oxygen supply is insufficient, so the energy generation term decreases and the temperature drops synchronously. This evolution law is directly determined by the coupled momentum and energy governing equations.
4.3 Influence of positive wind on smoke spillover
To further study the influence of wind environment on smoke spillover, under different fire powers of Working Condition 1 and Working Condition 2, the external window size is uniformly set as 1.5 m × 1.5 m with a window aspect ratio of 1:1. The temperature distribution characteristics of the upper adjacent room and the external façade, as well as CO concentration, are analyzed.
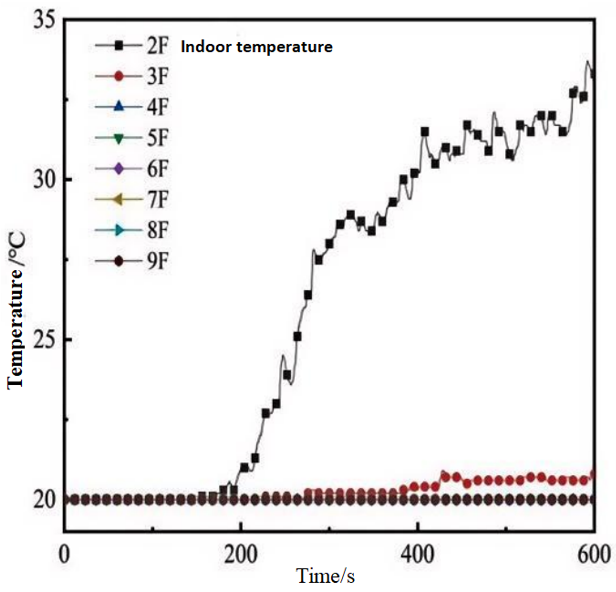
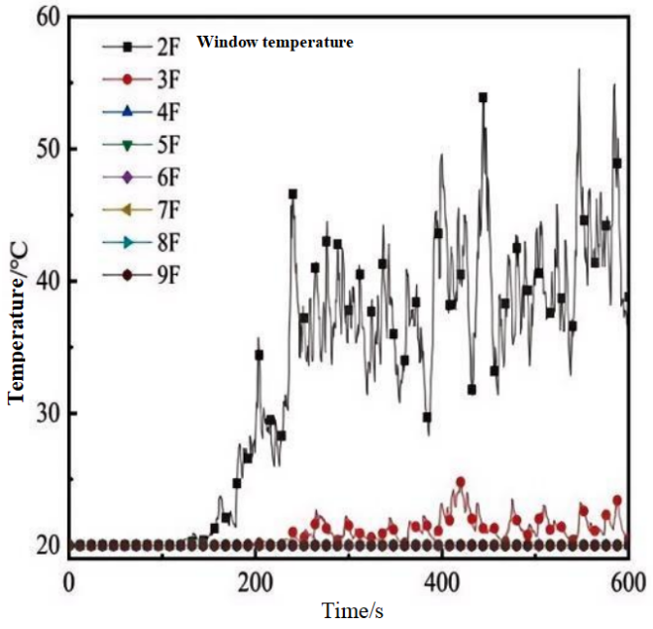
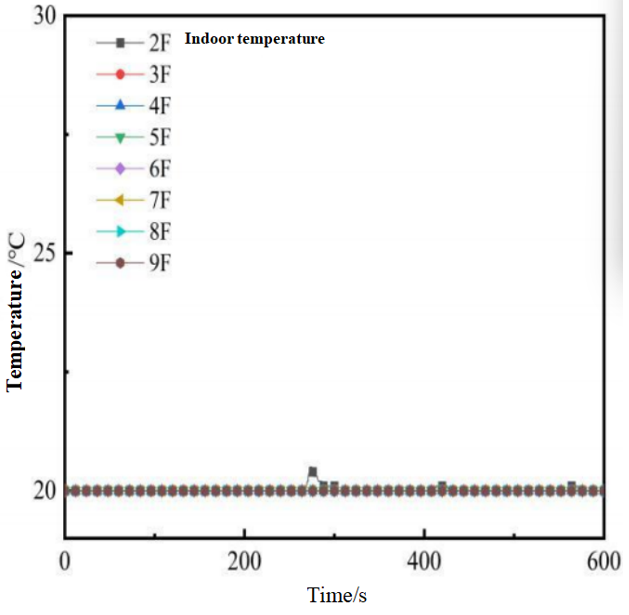
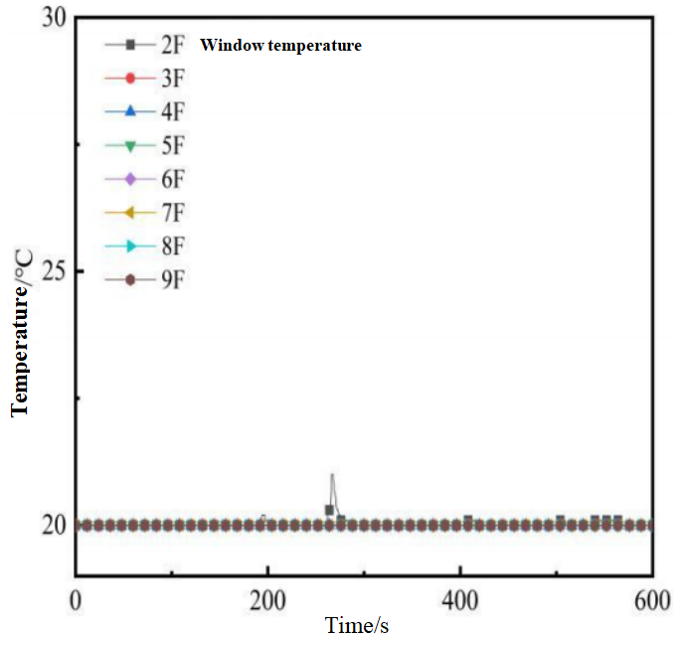
As shown in Figures 24-27, as the positive wind speed increases, the number of adjacent upper rooms affected by upward smoke transport gradually decreases. When the wind speed increases from 0 m/s to 2 m/s, only the room on the 2nd floor shows a relatively obvious temperature change, while rooms on other floors remain at ambient temperature. Meanwhile, the temperature of the 2nd-floor room shows an upward trend compared with the no-wind condition: taking the average indoor temperature during the stable combustion stage (400–500 s), it increases from 27.7 ℃ to 32.3 ℃, a growth of 16.6%. When the wind speed increases from 2 m/s to 4 m/s, the temperature of the 2nd-floor room drops sharply back to normal temperature.
Figure 24. Indoor temperature variation under outdoor wind speed of 2 m/s (Working Condition 1)
Figure 25. Window temperature variation under outdoor wind speed of 2 m/s (Working Condition 1)
Figure 26. Indoor temperature variation under outdoor wind speed of 4 m/s (Working Condition 2)
Figure 27. Window temperature variation under outdoor wind speed of 4 m/s (Working Condition 2)
When smoke spills out from the fire compartment, the driving force depends on the thermal pressure difference ΔP0 caused by the indoor–outdoor temperature difference. When ambient wind exists around the building, the wind exerts an additional wind pressure Pw on the building surface.
When the wind speed is 2 m/s, the thermal pressure difference ΔP0 is greater than the wind pressure Pw, so smoke can overcome the obstruction of wind speed and spill outward. However, as the wind speed increases, wind pressure keeps strengthening, and smoke spreading upward to the 2nd-floor room is blocked and stops spreading further. Nevertheless, under the combined action of positive wind and frontal entrainment effect, more smoke enters the 2nd-floor room, so the temperature of the 2nd-floor room shows an upward trend compared with the no-wind condition. When the wind speed is 4 m/s, the wind pressure is close to the thermal pressure difference, resulting in only a small amount of smoke spilling out, while the upward thermal buoyancy of smoke cannot break through the obstruction of the positive wind; therefore, the temperature of the upper adjacent room shows no change.
With a fixed fire power and fixed window aspect ratio, as the positive wind speed increases, the plume center temperature at 0.5 m from the façade shows a variation trend of “first increasing, then sharply dropping,” while the plume center temperature at 1 m and 1.5 m from the façade keeps dropping sharply, as shown in Figures 28 and 29.

Figure 28. Temperature contour of building façade at 400 s (Working Condition 1)

Figure 29. Temperature contour of building façade at 400 s (Working Condition 2)

Figure 30. Indoor CO variation under outdoor wind speed of 2 m/s (Working Condition 1)
The high-temperature smoke plume on the façade continuously undergoes forced convective heat exchange with external cold air during vertical rise, and the internal heat–mass exchange inside the plume simultaneously changes its temperature profile and spatial scale. High-temperature smoke released by the fire forms an initial thermal plume; in the stage of rising vertically outward from the window, the high-temperature core zone concentrates at the plume center, with a huge temperature gradient relative to the surrounding ambient air, so the boundary layer convective heat exchange intensity is highest and heat is rapidly transferred to the surrounding air. Therefore, an obvious high-temperature accumulation zone exists at the near-field position 0.5 m from the building. As the horizontal distance increases, continuous convective cooling constantly consumes plume heat energy, the high-temperature region contracts in both horizontal and vertical directions, the overall plume temperature drops uniformly, and only a weak high-temperature signal remains at 1.5 m.
Comparing the 1.5 MW and 6 MW working conditions, it can be seen that the high-power fire generates a thermal plume with higher initial temperature, larger volumetric flow rate, greater total internal heat storage, and a significantly increased temperature difference for convective heat exchange with outside air, resulting in a wider high-temperature coverage range at the same distance. Meanwhile, the rising thermal plume is continuously subjected to positive wind shear. Under low wind speed, the airflow only slightly distorts the plume contour, the vertical rise path remains intact, and convective heat exchange is dominated by vertical natural cooling. Under high wind speed, transverse wind pressure strongly shears the thermal plume, destroying its vertical rising form, greatly intensifying forced convective heat exchange, compressing the plume rise height, and leaving no high-temperature zone at a far distance from the façade. This convective heat exchange evolution law directly determines the temperature distribution characteristics of stratified attenuation of the façade plume under different wind speeds and different fire powers.
Based on the analysis results of adjacent room temperature variation, the CO concentration change in the 2nd-floor room under positive wind action is discussed, and a comparative analysis is carried out combining the results of Working Condition 1 and Working Condition 2, as shown in Figures 30–33. With a fixed fire power and fixed fire-room window aspect ratio, as the positive wind speed increases, the CO concentration variation law is similar to that of temperature, both showing a trend of “first increasing, then sharply dropping”.

Figure 31. Window CO variation under outdoor wind speed of 2 m/s (Working Condition 1)

Figure 32. Indoor CO variation under outdoor wind speed of 2 m/s (Working Condition 2)

Figure 33. Window CO variation under outdoor wind speed of 2 m/s (Working Condition 2)
The essence of vertical smoke spillover and interlayer diffusion is the competition and coupling result of two fluid driving forces: the aerodynamics of the external wind field and the indoor smoke thermal buoyancy. From the perspective of fluid mechanics, the temperature difference inside and outside the fire compartment generates thermal buoyancy Fb, driving the low-density high-temperature plume to rise upward and break out of the window to spill over. The positive ambient wind acts on the building façade to form a horizontal wind pressure driving force Fw. The two force vectors are orthogonal, jointly determining the façade plume shape and the degree of upper-room smoke intrusion. Under low wind speed conditions, Fb > Fw, and thermal buoyancy dominates. During plume outward rise, it is entrained by the incoming flow, and the airflow carries heat and toxic components into the second-floor adjacent room, causing heat storage and CO accumulation in the upper room. When the wind speed rises to the critical range, Fw gradually approaches Fb, and the horizontal wind pressure continuously suppresses vertical plume rise, weakening smoke spillage momentum. At high wind speed, $\mathrm{Fw} \gg \mathrm{Fb}$, and the wind field aerodynamics completely offset thermal buoyancy; the plume cannot extend upward and only a small amount of smoke escapes horizontally along the window, with no hot smoke input into upper adjacent rooms. The dynamic balance of these two driving forces directly regulates the window spillage heat flux, the temperature attenuation gradient of the façade plume, and the vertical toxic component transport efficiency. It is also the core fluid-mechanic cause for the “first rising then sharply dropping” variation law of temperature and CO concentration in upper rooms under different wind speeds.
Relying on the BIM–FDS coupled refined simulation system, this paper carries out quantitative analysis on smoke heat transfer and flow field evolution in high-rise building fires through comparisons of two fire power levels and multi-gradient positive wind speed working conditions. Based on the deduction of FDS mass, momentum, and energy conservation equations, the core universal laws of fire thermo-fluid dynamics and envelope heat transfer are extracted. The theoretical conclusions are as follows:
(1) The coupling of building envelope thermophysical properties and fire heat release determines the spatial heat storage balance law. In a confined building cavity, the fire energy source term, wall thermal conductivity, and specific heat jointly control the system internal energy budget: under low HRR conditions, the envelope heat storage rate is lower than the continuous smoke heat generation rate, the high-temperature field is confined to the vertical shaft passage on the fire floor, interlayer fluid momentum is insufficient, and heat is difficult to transport upward; under high HRR conditions, energy input intensity is greatly increased, the envelope gradually enters the heat storage saturation stage, and later the solid phase releases heat back into the room, superimposed with incomplete combustion caused by oxygen deficiency, so the total system internal energy shows an evolution feature of first rising then decaying. Component thermal conductivity exhibits a stratified regulation effect: high-conductivity concrete shafts enhance vertical heat transport, low-conductivity aerated partition walls block lateral heat diffusion, forming a spatial temperature distribution paradigm of “vertical dominance, lateral confinement.” This heat transfer balance mechanism is applicable to various enclosed building cavities with vertical shafts.
(2) The vector competition between indoor and outdoor pressure differences governs smoke spillage heat transfer and species transport. Vertical smoke spillover is a direct result of the competition between two momentum vectors—indoor thermal buoyancy and external positive wind pressure—whose relative magnitudes form two general flow field modes: in the thermal-buoyancy-dominated low-wind-speed regime, the plume has sufficient vertical kinetic energy, and external airflow entrainment intensifies convective heat exchange in upper adjacent rooms, leading to synchronous accumulation of temperature and toxic components; in the wind-pressure-dominated high-wind-speed regime, horizontal external force offsets thermal buoyancy momentum, vertical spillage heat transfer is suppressed, and the internal energy and harmful component concentration in upper space remain at ambient background levels. The dynamic balance between these two driving forces is the underlying fluid dynamic mechanism for façade plume stratified attenuation and synchronous thermo-mass variation in adjacent rooms across building types.
(3) The external façade plume follows the law of distance-gradient forced cooling heat transfer. After spilling from the window, the high-temperature plume continuously undergoes forced convective heat exchange with ambient cold air, forming an orderly temperature attenuation gradient along the horizontal direction: the near-wall 0.5 m zone has high convective heat exchange intensity with a concentrated high-temperature core; as horizontal distance increases, smoke internal energy continuously dissipates and plume momentum decays, the high-temperature coverage shrinks layer by layer, and only a weak thermal signal remains at a far distance. Under the same wind speed, fire HRR is positively correlated with plume peak temperature and high-temperature coverage range. This stratified cooling law is not affected by minor changes in building story height or window size and has general reference value for fluid heat transfer.
(4) The shaft suction effect is the core fluid channel for interlayer smoke transport in high-rise buildings. Driven by the stack effect, high-temperature low-density smoke preferentially completes long-distance vertical transport along elevator and utility shafts, and after reaching the building top, flows back downward through stair shafts under gravity; different spatial positions of shafts form differentiated flow resistances, directly changing smoke diffusion timing. The resistance difference among shaft passages determines the sequence of thermo-mass filling in multi-floor spaces. This vertical-priority transport law is a distinctive thermo-fluid dynamic feature distinguishing high-rise buildings from single-story and large-span buildings.
(5) Smoke temperature and CO toxic components exhibit a synchronous thermodynamic response characteristic. Combustion heat release and convective heat exchange intensity jointly regulate the indoor temperature field and the generation–diffusion rate of toxic gases: the higher the system internal energy, the higher the CO accumulation rate and peak concentration from incomplete combustion; the influence trends of wind speed and fire power on temperature and species concentration are completely consistent, and heat transfer evolution and multiphase species transport follow unified energy and species conservation constraints. The thermal state can serve as an intuitive indicator of smoke toxicity distribution.
[1] Sharma, R.P., Barik, B.K., Praharaj, S., Kumar, V.V., Sharma, A. (2026). Hall-effect-modulated thermal transport enhancement in hybrid nanofluid flow over a stretching surface using Taguchi optimization. Journal of Complex and Multiphysics Engineering Systems, 1(10): 82-97. https://doi.org/10.56578/jcmes010105
[2] Parsa, V., Santiago, A., Laím, L. (2025). Computational fluid dynamics of compartment fires: A review of methods and applications. Applied Sciences, 15(5): 2342. https://doi.org/10.3390/app15052342
[3] Ionescu, D.A., Iordache, V., Ene, I.C., Anghel, I. (2025). Impact of fire source locations and ventilation strategies on indoor environments: An FDS simulation study. Fire, 9(1): 22. https://doi.org/10.3390/fire9010022
[4] Tao, R., Ren, H., Yang, X., Wang, D., Sun, J. (2025). Smoke simulation with detail enhancement in ship fires. Journal of Marine Science and Engineering, 13(1): 101. https://doi.org/10.3390/jmse13010101
[5] Sun, G., Zhang, X., Wu, J., Xiao, S., Xue, S. (2025). Theoretical and numerical simulation research on fire of large-span spatial structures. Applied Sciences, 15(3): 1154. https://doi.org/10.3390/app15031154
[6] Wu, J., Liu, M., Tang, Y., et al. (2025). Assessing human exposure to fire smoke in underground spaces: Challenges and prospects for protective technologies. Sustainability, 17(22): 9922. https://doi.org/10.3390/su17229922
[7] Wang, Z., Bo, L., Fali, H., Wudan, H. (2017). Numerical simulation of smoke particle motion. In 2017 International Conference on Advanced Mechatronic Systems (ICAMechS), Xiamen, China, pp. 131-134. https://doi.org/10.1109/ICAMechS.2017.8316563
[8] Ivanov, M.L., Peng, W., Wang, Q., Chow, W.K. (2021). Sustainable smoke extraction system for atrium: A numerical study. Sustainability, 13(13): 7406. https://doi.org/10.3390/su13137406
[9] Moinuddin, K., Mahmud, H.I., Joseph, P., et al. (2024). Experimental and numerical studies on the efficacy of water mist to suppress hydrocarbon fires in enclosures. Fire, 7(3): 83. https://doi.org/10.3390/fire7030083
[10] Zhao, H., Ren, J. (2025). Dispersion patterns of spontaneous coal combustion fumes in deep open-pit mines effects of wind direction and speed. Scientific Reports, 15(1): 33707. https://doi.org/10.1038/s41598-025-19010-w
[11] Zhou, F., Wang, D. (2008). Computer simulation of mine fire of ventilation network. Metal Mine, 2: 115-117. https://doi.org/10.3321/j.issn:1001-1250.2008.02.029
[12] Gao, J., Yang, M. (2005). Analysis of the factors influencing temperature distribution of surrounding rock and cooled zone radius. China Safety Science Journal, 15(2): 73-76. https://doi.org/10.3969/j.issn.1003-3033.2005.02.017
[13] Zhang, L., Liu, Y. (2024). Research on technology of key steps of intelligent ventilation in mines. Coal Science and Technology, 52(1): 178-195. https://doi.org/10.12438/cst.2023-1987
[14] Liu, M., Wang, G. (2023). Indoor fire simulation in low-rise teaching buildings based on BIM-FDS. Fire, 6(5): 203. https://doi.org/10.3390/fire6050203
[15] Zhang, J., Weng, J., Zhou, T., et al. (2019). Investigation on smoke flow in stairwells induced by an adjacent compartment fire in high rise buildings. Applied Sciences, 9(7): 1431. https://doi.org/10.3390/app9071431
[16] Filippi, J.B., Bosseur, F., Mari, C., Lac, C. (2018). Simulation of a large wildfire in a coupled fire-atmosphere model. Atmosphere, 9(6): 218. https://doi.org/10.3390/atmos9060218
[17] Waly, M.S., Yeoh, G.H., Ghodrat, M. (2026). Wind-driven structure-to-structure fire spread: Validating a physics-based model for outdoor built environments. Fire, 9(3): 119. https://doi.org/10.3390/fire9030119
[18] Hayajneh, S.M., Naser, J. (2025). Wind and slope influence on wildland fire spread, a numerical study. Fire, 8(6): 217. https://doi.org/10.3390/fire8060217
[19] Mirparizi, M. (2026). Coupled thermo-physical processes in porous phase-change energy storage systems with hybrid nanofluids. Journal of Complex and Multiphysics Engineering Systems, 1(1): 70-81. https://doi.org/10.56578/jcmes010104