Hasan F Abd Ali | Siraj A. Nasrullah | Mohammed Abbas Neama | Karrar Adnan Hameed | Wadah Mohammed Mahdi | Jaber O. Dahloos | Muhsen M. Alsilbi*
© 2026 The authors. This article is published by IIETA and is licensed under the CC BY 4.0 license (http://creativecommons.org/licenses/by/4.0/).
OPEN ACCESS
Solar chimney power plant (SCPP) are used to harness solar energy and generate power, but their low conversion efficiency motivates strategies to improve output, such as integrating the collector with photovoltaic (PV) cells. This study presents an experimental and numerical investigation of a hybrid PV/SCPP, in which part of the glass collector is replaced by PV panels while hot-water pipes on the collector floor supply additional thermal gain, and compares its performance with a traditional (glass-covered) solar chimney model under the same conditions. Both configurations were built and tested outdoors in Karbala, Iraq, and the results were compared with a 3D ANSYS FLUENT computational fluid dynamics (CFD) model of the same geometry. The maximum air velocity at the chimney outlet reached 3.33 m/s (hybrid case) and 3.388 m/s (traditional case) in the numerical results, while the overall maximum collector air temperature reached 321.5 K and 326.8 K, respectively; CFD predictions agreed with experimental measurements to within an average absolute error of 0.74%. The results show that covering part of the collector with PV panels reduces the thermal gain available to drive the airflow, and therefore the kinetic power available at the turbine location, compared with the glass-covered case. However, the PV panels' direct electrical output substantially exceeds this kinetic-power reduction, so the hybrid configuration's total power output (kinetic plus PV) is higher than the traditional configuration over the tested period (peaking near 24.4 W at 13:00). This trade-off between reduced thermal/kinetic gain and increased PV electrical output, observed here for a single PV coverage ratio, motivates further study of alternative coverage ratios in future work.
hybrid solar chimney power plant, photovoltaic/thermal collector, renewable energy systems, computational fluid dynamics, air velocity distribution
The transition toward clean and sustainable energy sources offers substantial benefits, including reduced environmental pollution, mitigation of climate change, and decreased dependence on fossil fuels and their associated economic volatility. Consequently, considerable research effort has been directed toward advancing renewable energy technologies across multiple sectors. Wind energy, for example, has received particular attention, with recent studies exploring improved energy extraction at low wind speeds and novel turbine concepts such as Magnus-based wind turbines [1].
Notwithstanding these advances, solar energy remains among the most promising and technically feasible renewable resources, particularly in regions of high solar irradiance such as Iraq. Previous studies have consistently identified solar energy as a principal solution to the global energy crisis, owing to its wide availability, accessibility, and sustainability [2, 3]. Solar energy is also cost-effective and can be harnessed without highly specialized equipment; however, its intermittent availability necessitates complementary storage or heat-retention strategies [4]. Photovoltaic (PV) cells, solar chimneys, and solar ponds are among the principal technologies used to convert solar energy into electricity [5].
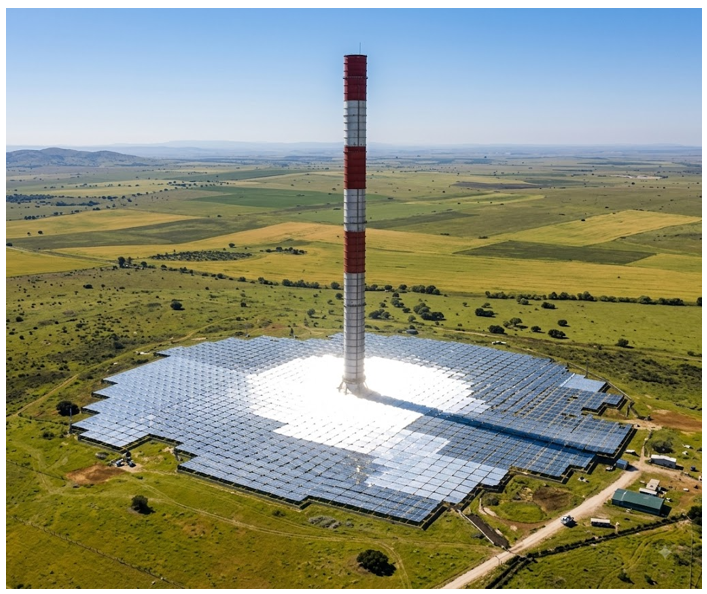
A solar chimney power plant (SCPP) converts solar energy into electricity by combining three main components: a solar collector, a vertical chimney, and a turbine-generator system, an arrangement valued for its structural simplicity and its capacity for economical, reliable power generation [6]. In a typical SCPP, a circular glass collector is positioned above a black-coated absorbing ground surface; solar radiation heats the enclosed air, reducing its density and driving it toward a central chimney, where turbines convert the resulting airflow into mechanical and then electrical energy. The first large-scale SCPP prototype was built in 1982 at Manzanares, Spain (Figure 1), with a 195-meter chimney of 5-meter radius and a 244-meter-diameter collector [7]. Despite this early demonstration, the inherently low conversion efficiency of SCPP remains their principal limitation, motivating ongoing research to improve their performance [8].
Numerous studies have sought to improve SCPP efficiency by combining the basic configuration with complementary technologies [9]. For example, a solar chimney has been coupled with seawater desalination and wind-assisted supercharging to enable combined power and freshwater production [10]. Elsewhere, a transpired solar chimney was proposed, in which the conventional glass cover was replaced by a metal sheet admitting air through its upper surface rather than the perimeter; a prototype tested at Trakya University (Edirne, Turkey) achieved roughly three times the efficiency of a conventional solar chimney [11]. Building on this concept, a hybrid transpired solar chimney combining PV panels with transpired collectors was introduced, covering 42% of the collector area with PV panels and achieving efficiencies of 16-18% [12].
These studies demonstrate that hybridizing solar chimneys with PV panels, desalination units, or transpired-collector designs can meaningfully improve performance. However, most reported hybrid PV/solar-chimney designs rely solely on solar radiation as the thermal input, and few studies directly compare a PV-integrated configuration against an otherwise identical, non-PV baseline under matched outdoor conditions with parallel computational fluid dynamics (CFD) validation. The present study addresses this gap by developing and testing two configurations of a small-scale solar chimney prototype – a hybrid PV/glass collector and a conventional glass collector – both additionally assisted by hot-water pipes at the collector floor to supplement the thermal gain from solar radiation. The specific contribution of this work is threefold: (i) a direct, matched-condition experimental comparison of the hybrid and traditional configurations; (ii) a 3D CFD model of the same geometry, validated against the experimental measurements; and (iii) a quantification of the trade-off between the reduced thermal/kinetic gain and the additional electrical output introduced by covering part of the collector with PV panels.
Figure 1. The solar chimney in Spain [7]
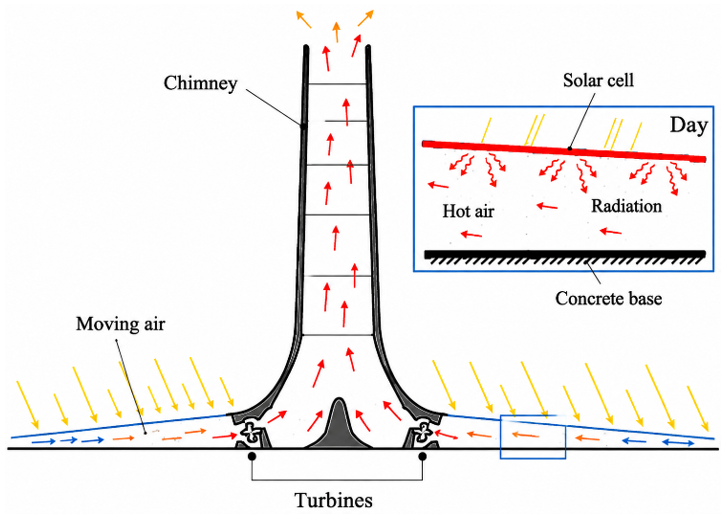
Based on the preceding studies, it is reasonable to conclude that the solar chimney exhibits inadequate power conversion efficiency, thereby motivating researchers to improve its efficiency [9]. From this vantage point, the solar chimney technology and solar cells will be combined. A hybrid PV/solar chimney will be employed in this investigation, as illustrated in Figure 2.
This method uses PV panels to cover the lower portion of the chimney. These panels generate electrical power and serve as energy-absorbing surfaces. The radiant energy emitted from the rear surface warms the air in this configuration, and the hot-water net pipes mounted on the collector's ground provide the heat. By employing a turbine, the kinetic energy of the moving air can, in principle, be converted into mechanical and then electrical power. Tests will also be conducted to determine how air entrainment with these tubes affects solar panel efficiency and electricity output.
In this study, a hybrid solar chimney approach is presented, where the collector cover is partially replaced with PV panels and a hot-water pipe network is integrated at the collector floor to enhance thermal heat gain and airflow kinetic energy.
There are two cases in the study:
1. Case 1 (Hybrid / with PV): PV collector + hot water pipes.
2. Case 2 (Traditional / without PV): Glass collector + hot water pipes.
Figure 2. Hybrid photovoltaic (PV)/solar chimney [13]
2.1 Theoretical model
The thermal efficiency of a thermal system is:
$\eta_{t h}=\frac{Q_{\text {gain}}}{Q_{\text {in}}}$ (1)
It is possible to calculate the solar chimney's thermal efficiency [14]:
$\eta_{t h}=\frac{Q_u}{A_{c o l} I_t}$ (2)
where,
$Q_u$: Useful heat gain by the solar chimney (W),
$I_t$: Total solar radiation on a horizontal surface (W/m2) ,
Acol: Total collector area (m2) .
The heat gain by solar chimney can be determined as [15]:
$Q_u=\dot{m}_{\text {air}} C p_{\text {air}}\left(T_{\text {o air}}-T_a\right)$ (3)
where,
$\dot{m}_{\text {air}}$: Air mass flow rate (kg/s),
$C_{p, \text {air}}$: Specific heat capacity of air (J/kg·K),
$T_o$: The outlet air temperature (K),
$T_a$: The ambient air temperature (K).
The following equation can be used to determine the mass flow rate in the air [15]:
$\dot{m}_{\text {air}}=\rho_{\text {air}} . V_{\text {air}} . A_{\text {chim.}}$ (4)
where,
$V_{\text {air}}$: Average velocity of the outlet air,
$\rho_{\text {air}}$: The density of the air which can be calculated [16, 17].
$\rho_{\text {air}}=1.1614-0.00353 ($Toair -300$)$ (5)
While the air-specific heat can be evaluated as [18]:
$C_{p, a i r}=[1.007+0.00004($ Toair -300$)] * 10^3$ (6)
The electric efficiency of the recently developed solar chimney was assessed as [19]:
$\eta_{\text {ele}}=\frac{P_{p v}+P_k}{I_t A_{c o}}$ (7)
where, $P_{p v}$: The electricity that the solar cells produce, $P_t$: The turbine's electrical power output (denoted Pk in Eq. (7) above and in the Results section; Pt and Pk refer to the same estimated turbine/kinetic power output, obtained equivalently from Eq. (8) or Eq. (11)).
The electrical energy that is produced by the turbine which is placed at the base of the chimney can be determined from the relation with kinetic power [13]:
$P_k=\eta_t \cdot P_w$ (8)
where, $\eta_t$ is the wind turbine's efficiency, which varies (from 50%–90%) [20]. The value of this efficiency will be represented as 85% [21].
The airflow velocity at the entrance of the chimney can be expressed as [10, 20]:
$V_{\text {air}}=\sqrt{2 g H \frac{\Delta T}{T_{\text {out}}}}$ (9)
where,
H: is the chimney height,
∆T: is the temperature difference between the out temperature and the temperature at the base chimney.
The kinetic energy can be based on the equation that follows [22]:
$P_w=\frac{1}{2}\left(m_{\text {air}}\right) V_{\text {air}}^2$ (10)
The turbine converts this kinetic energy to mechanical energy as below [20]:
$P_t=\eta_t \frac{1}{2} m_{\text {air}} V_{\text {air}}^2$ (11)
Eq. (7) above expresses the electrical efficiency relative to the solar input alone. In our study, since the collector also receives heat from the hot-water pipes, the system's overall efficiency (combining both the solar and hot-water thermal inputs in the denominator) can be expressed as:
$\eta_{\text {ele}}=\frac{P_{p v}+P_k}{Q_{\text {in}}+I_t A_c}$ (12)
where, $Q_{\text {in}}$ is the heat supplied by the hot water pipe to the air under the collector roof [23].
$Q_{i n}=\dot{m}_{w a.} C w. \Delta T w$ (13)
where, $C_w$ is the specific heat of water.
While the amount of electricity generated by the solar panels can be calculated as [19]:
$P_{p v}=I . V$ (14)
where, I and V are the current and voltage of the solar panels.
2.2 The experimental work
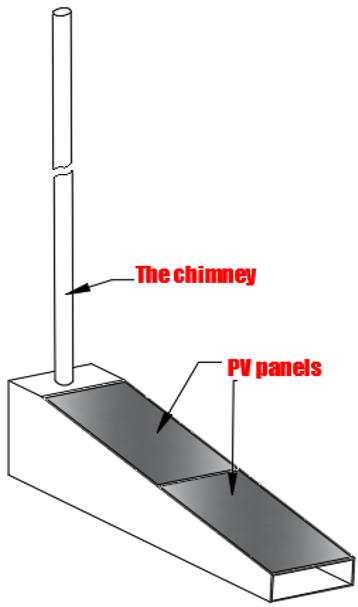
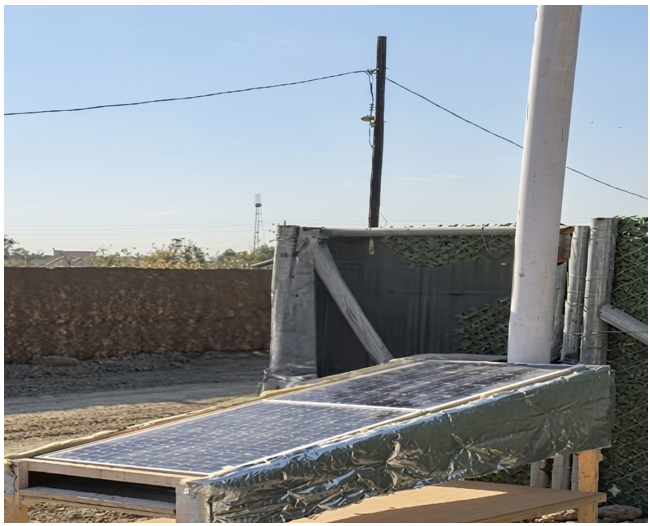
The experimental device was constructed and tested in Iraq in Karbala city (Lat. $32.61389^{\circ}$N and long $44.0250^{\circ}$E) at thirty-two meters above sea level. The experimental model consisted of a collector and a chimney. The differences between the current model and the conventional solar chimney lie in the fact that the glass of the collector is replaced by a PV panels in the present model, as shown in Figure 3.
(a) 3D model
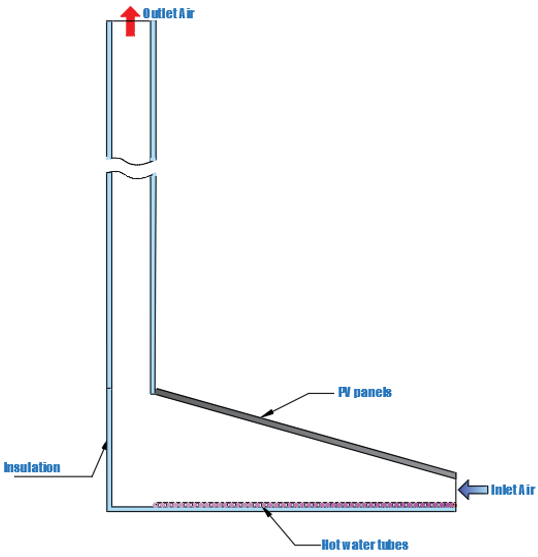
(b) Schematic diagram
Figure 3. The computer-aided design (CAD) model of the experimental hybrid solar chimney power plant (SCPP(
Our system includes the following primary components: 1. Wooden structure 2. Chimney 3. Two PV panels 4. Net of copper pipes for hot water 5. Measuring devices. The tests were conducted in outdoor conditions. Figure 4 displays the experimental model device of our work.
Figure 4. The experimental model of the hybrid solar chimney power plant (SCPP)
The solar energy that enters the collector, which is covered by the solar cells, heats the air inside the current model. The PV panels generate electricity by absorbing the majority of the solar radiation, and the other part of the radiation reaches the air under the cells, which plays a role in heating it. But in this model, the main part of heating the air is caused by the effect of the hot water pipes. Because the hot-water supply is decoupled from direct solar radiation, this heating mechanism could, in principle, allow operation outside daylight hours; however, all measurements reported in this study were taken between 09:00 and 16:00, so this potential is noted here as a direction for future testing rather than a validated finding of the present work. The decrease in air density results in an upward movement of the air towards the tip of the chimney. This air motion serves to lower the solar cell's temperature, thereby enhancing its efficiency. The system consists of the PV panel collector as an absorber with dimensions (138 cm long) and (50 cm wide) with an emissivity of (Ɛ = 0.95) [9]. The base of the collector is made of a wooden panel. The net of black pipes was fixed on the ground of the collector. These pipes were used for the hot water to heat the air passing under the PV absorber panel. In our study, the hot water that is used comes from solar collector devices. It uses a thermal insulator (glass wool) with a thermal conductivity of k = 0.46 W/m·K [9]. Table 1 reports the mean solar radiation intensity and wind speed recorded over the test days and used as representative boundary conditions for the CFD simulations; the corresponding instantaneous, time-varying experimental values are presented later. Table 2 lists the experimental model parameters.
Table 1. Experimental data
|
|
Without PV |
Hybrid with PV |
|
Water temperature range (℃) |
56–65 |
58–65 |
|
Water flow rate (L/min) |
2 |
2 |
|
Solar radiation intensity (W/m²) |
600 |
600 |
|
Wind speed (m/s) |
1.15
|
1.15
|
Table 2. The experimental model parameters
|
Component |
Parameter |
Value |
Unit |
|
Chimney |
Height (H) |
2.00 |
m |
|
Inner diameter (Dc) |
0.10 |
m |
|
|
Wall thickness |
0.005 |
m |
|
|
Material |
Plastic |
- |
|
|
Collector |
Length (L) |
1.38 |
m |
|
Width (W) |
0.50 |
m |
|
|
Air gap height (Hg) – distance between PV/glass and ground |
0.08 |
m |
|
|
Floor material |
Wooden panel with black coating |
- |
|
|
Thermal insulator (glass wool) thickness |
0.03 |
m |
|
|
Hot water pipes |
Material |
Copper |
- |
|
Outer diameter |
0.010 |
m |
|
|
Inner diameter |
0.008 |
m |
|
|
Spacing (pitch) |
0.050 |
m |
|
|
Air flow path |
Inlet area (perimeter gap) |
0.3008 |
m² |
|
Chimney cross-sectional area |
0.00785 |
m² |
Ten temperature sensors were used in the model. The first one was fixed in the air inlet to the model (The collector's inlet) to gauge the air's temperature. Three sensors were fixed in the collector to display the difference in the air's temperature through the collector zone. Two of the sensors were fixed on the PV panels to measure the panel. One sensor was placed in the duct before the entrance of the chimney. In the chimney, three sensors were put in the specified positions, for temperature measuring used a multi-channel temperature data logger (Model: PCE-T 1200).
To measure the air velocity, a hot wire device (Model: R4500SD) was used. Two types of multi-meters (SM-20) were employed to gauge the PV solar cells' electric current and voltage output. In the model, the solar cells are connected in series. The above electrical circuit, it was used batteries to store the power produced and a load to meet the maximum cell load. Table 3 displays the PV solar cell specifications of the panels that are used in this work.
Table 3. Solar cell photovoltaic (PV) specifications
|
Parameter (Symbol) |
Rated Value |
|
Maximum power ($\mathrm{P}_{\max }$) |
50 W |
|
Maximum voltage ($V_{\max }$) |
18.6 V |
|
Maximum current ($I_{\max }$) |
2.69 A |
|
Open voltage (${V}_{\mathrm{oc}}$) |
22.6 V |
|
Type of the solar cell |
Polycrystalline Silicon |
|
Short circuit current (Isc) |
2.92 A |
|
Dimensions |
470 × 670 × 30 mm |
To determine whether a new solar chimney is viable for electricity generation, error analysis is essential. The imprecision of the instruments used in the experimental procedures is shown in Table 4. The following Eq. (15) is then used to assess the imprecision of the results obtained [24].
$\omega_R=\sqrt{\left(\frac{\partial \varphi}{\partial x_1} \times \psi_1\right)^2+\left(\frac{\partial \varphi}{\partial x_2} \times \psi_2\right)^2+\cdots\left(\frac{\partial \varphi}{\partial x_n} \times \psi_n\right)^2}$ (15)
Table 4. Details of the measuring devices
|
Device |
Measuring |
Error |
|
Hot-wire anemometer |
Wind velocity |
±5% |
|
Digital thermometer (Multi-channel temperature data logger) |
Temperature |
±0.4% |
|
Multi-meter |
Direct current (DC) current |
±0.8% |
|
Multi-meter |
DC voltage |
±0.5% |
Table 5. Computational fluid dynamics (CFD) numerical setup specifications
|
Parameter |
Specification |
|
Solver type |
Pressure-based |
|
Time formulation |
Steady-state |
|
Gravity |
9.81 m/s² |
|
Air density model |
Boussinesq approximation (reference temperature: 300 K) |
|
Turbulence model |
Realizable k-ε with Enhanced Wall Treatment |
|
Radiation model |
Discrete Ordinates (DO) with 5 × 5 pixel divisions |
|
Solar load model |
Solar Ray Tracing (activated) |
|
Pressure-velocity coupling |
SIMPLE |
|
Spatial discretization - momentum |
Second Order Upwind |
|
Spatial discretization - energy |
Second Order Upwind |
|
Spatial discretization - k (turbulent kinetic energy) |
Second Order Upwind |
|
Spatial discretization - ε (turbulent dissipation rate) |
Second Order Upwind |
|
Spatial discretization - DO radiation intensity |
First Order Upwind |
|
Under-relaxation factors - pressure |
0.3 |
|
Under-relaxation factors - momentum |
0.7 |
|
Under-relaxation factors - energy |
1.0 |
|
Under-relaxation factors - k (turbulent kinetic energy) |
0.8 |
|
Under-relaxation factors - ε (turbulent dissipation rate) |
0.8 |
|
Under-relaxation factors - DO radiation |
1.0 |
|
Convergence criterion - energy equation |
1 × 10⁻⁶ |
|
Convergence criterion - continuity equation |
1 × 10⁻⁴ |
|
Convergence criterion - momentum equations (x, y, z) |
1 × 10⁻⁴ |
|
Convergence criterion - k (turbulent kinetic energy)
|
1 × 10⁻⁴
|
2.3 Computational fluid dynamics work
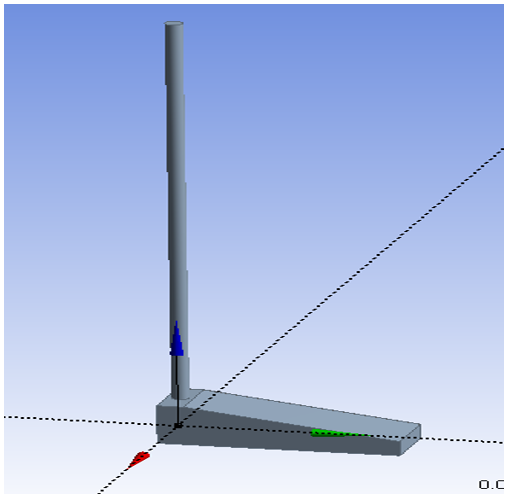
In this study, the numerical method was used to enhance and compare the results that will be obtained with the experimental results reached in this study. A 3D CFD model created to replicate the SCPP model was employed in the numerical procedure. The ANSYS FLUENT program was utilized for the simulation work in our investigation. The ANSYS FLUENT software facilitates the use of the finite volume method to model the natural convection that occurs in the SCPP and the flow of a continuous medium. The employment of the finite volume approach by ANSYS FLUENT is considered to be an optimum technique for resolving the governing equations. The prototype's geometry was built utilizing ANSYS FLUENT CFD. The dimensions of this geometry correspond to those of the experimental design as shown in Figure 5. Table 5 summarizes the CFD numerical setup.
Figure 5. 3D geometrical simulation for the experimental model of the hybrid solar chimney power plant (SCPP)
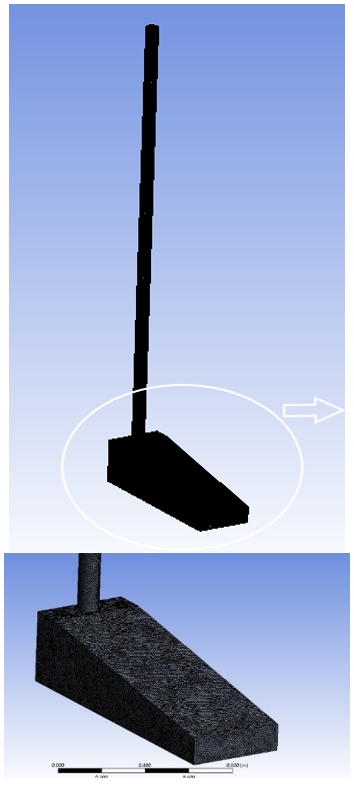
Figure 6. The mesh generation of the models
The generation of the mesh is a pivotal and fundamental step in the simulation process, as it directly influences the accuracy of the analysis and the convergence of the model, as shown in Figure 6. The accuracy of the numerical results is closely linked to the choice of a suitable mesh. The quantity of mesh elements utilized in this investigation is equal to 797163 elements. The structure of the computational grids is Tetrahedral. Five tetrahedral meshes were generated with element counts of 200,000, 400,000, 600,000, 797,163, and 1,200,000. The chimney outlet air velocity was monitored for each mesh. The difference in outlet velocity between the 797,163-element mesh and the 1,200,000-element mesh was less than 2%, confirming mesh independence. Therefore, the fine mesh with 797,163 tetrahedral elements was selected for all simulations.
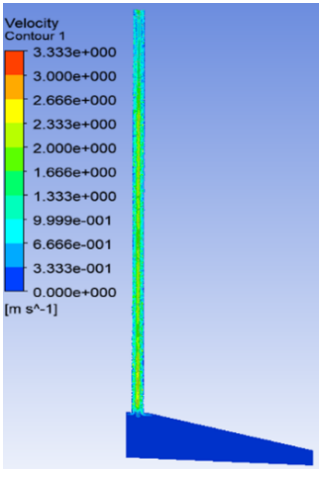
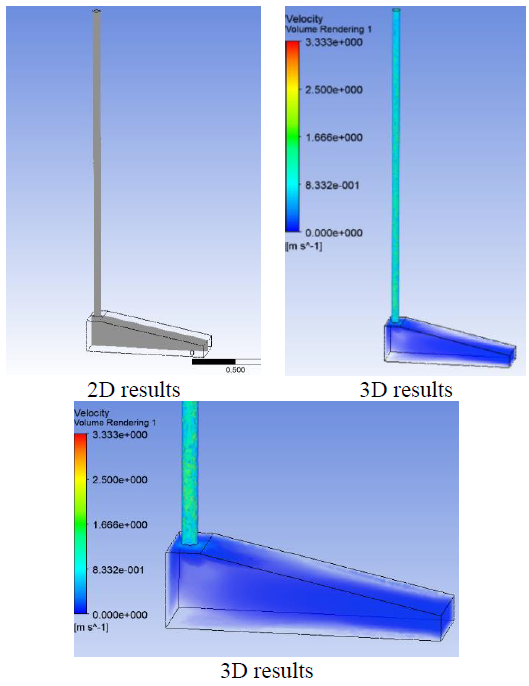
The results of the numerical simulation of the prototype were displayed in two representations: the first 2D and the second 3D. In the 2D numerical results, the velocity and temperature are displayed in the central plane of the SCPP prototype, as shown in Figure 7. Figure 8 shows the airflow pattern in the hybrid SCPP model. This figure shows the airflow’s 2D and 3D results. As shown in the figure, the maximum air velocity is 3.33 m/s. The hot air reaches this velocity value in the chimney.
Figure 7. The plane of 2D numerical results
Figure 8. The velocity distribution of the numerical simulation for the prototype
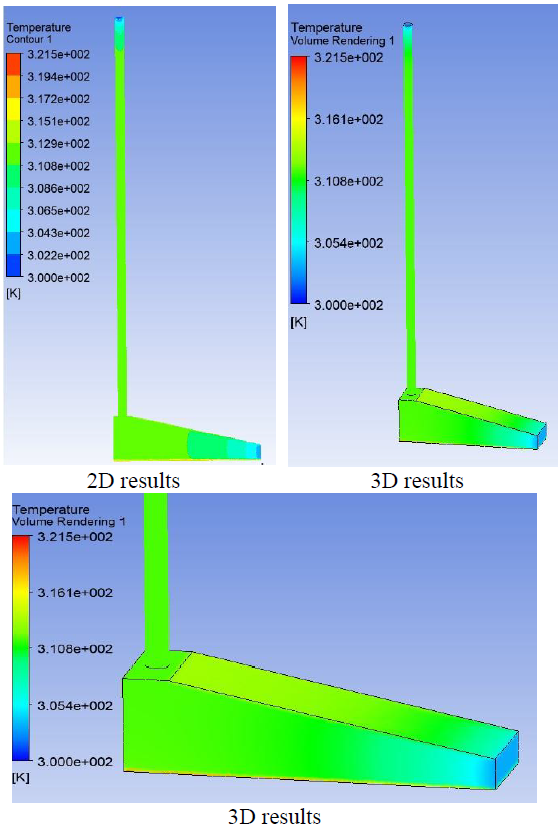
Figure 9 shows the temperature distribution in the numerical model of the laboratory solar chimney. The laboratory model was simulated using CFD, showing 2D and 3D temperature distributions. From the figure, we see that the temperature begins to rise gradually within the model. We can also notice that the temperature peaks near the floor in the collector due to heat transfer from floor-mounted hot-water pipes. Solar radiation also heats the air. We note that the maximum temperature reached is 321.5 K.
Figure 9. The temperature distribution of the numerical simulation for the prototype
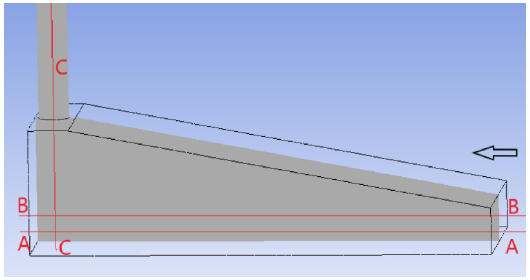
Figure 10. The lines of the studied relations
In Figure 10, the plane in which the distribution of temperature and velocity properties was studied is evident, as it represents the rest of the field due to its symmetry. In the practical aspect of this study, the same level was adopted to study the distribution of properties across it. In the figure, three axes are shown: AA, BB, and CC.
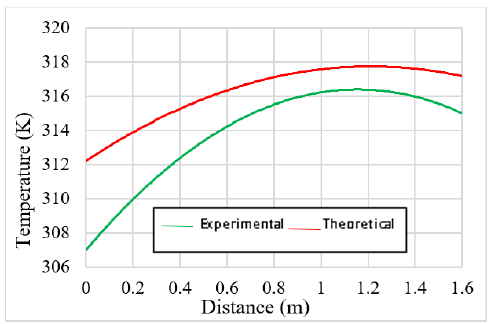
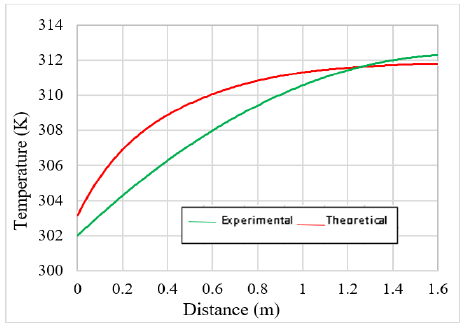
Figure 11 shows a comparison of the experimental and theoretical temperatures as a function of distance along the AA axis. It is evident from the figure that it increases with distance along this axis due to heat gained from the air around the hot water pipes and from solar radiation through the hybrid solar chimney model.
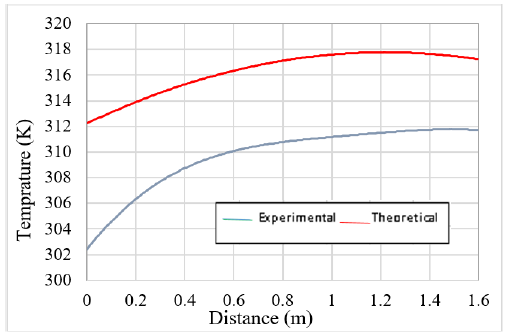
Figure 12 shows the relationship between the theoretical and experimental temperature over the distance through the BB axis. From the figure, it was observed that the temperature in both curves (theoretical and practical) increased with distance and was directly proportional to it. It was also observed that the measured temperature is lower than the theoretical temperature (from the simulation) due to the accuracy of the measuring devices. From the figure, we can see that the temperature along axis BB is lower than that along axis AA, as shown in Figure 10. This is because axis AA is closer to the floor of the model, and thus the effect of the heat transferred from the hot water pipes is greater in this axis than in the axis BB. Figure 13 compares the theoretical temperature distributions along axes AA and BB. From the figure, we observe that temperatures along the AA axis are highest due to heat transfer from the hybrid solar chimney model’s floor.
Figure 14 displays the relationship between the theoretical temperature and the vertical distance through the chimney (CC axis). The CC axis was chosen to study the properties along it because the chimney is symmetrical, so properties can be studied along this axis and considered representative of the entire field. From the figure above, it can be seen that the temperature distribution decreases rapidly as it moves away from the model floor, then stabilizes after entering the chimney at approximately 312 K. It continues to decrease in the last part of the chimney.
Figure 11. The relation between the temperature values and the distance through the AA axis
Figure 12. The relation between the temperature values and the distance through the BB axis
Figure 13. The theoretical temperature values and the distance through the AA and BB axis
Figure 14. The relation between the theoretical temperature and the distance through the CC axis
Figure 15. The relation between the theoretical velocity and the distance through the AA axis
Figure 16. The relation between the velocity and the distance through the BB axis
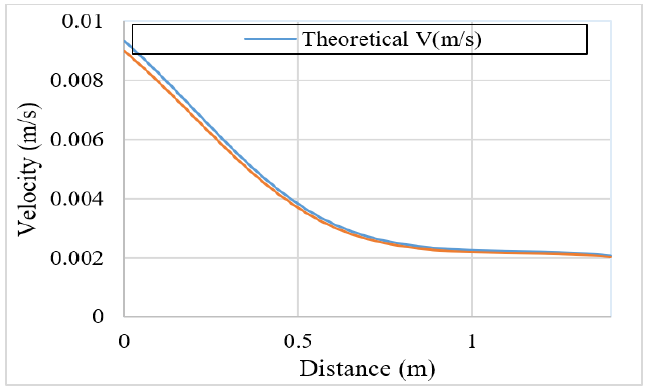
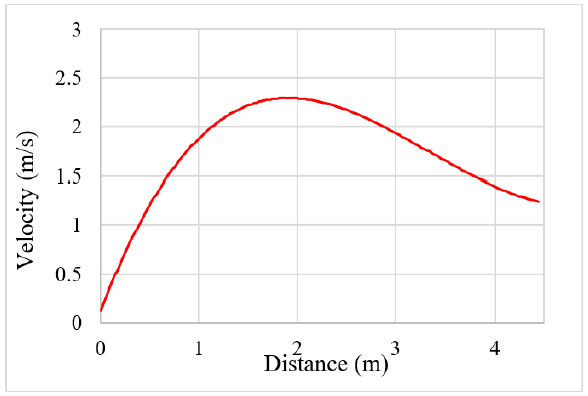
Figure 15 shows the relationship between theoretical and practical velocity with distance through the AA axis. From the figure, it was found that the air velocity decreases with increasing distance along this collector. This decrease in air velocity is a result of the model's shape and the collector’s inclined surface, as the transverse surface area of the flow section increases with distance. From the figure, it can be seen that the theoretical velocity is higher than the experimental values.
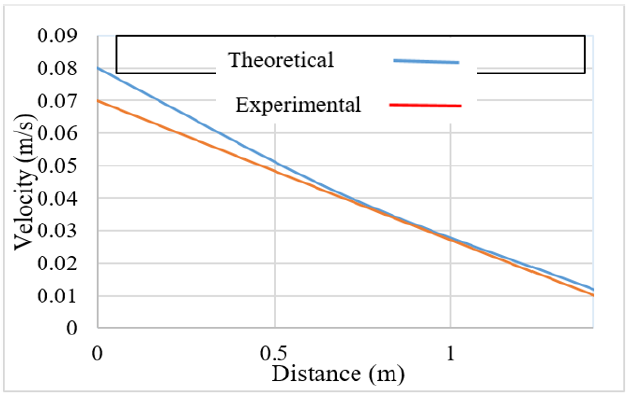
Figure 16 displays the relationship between the practical and theoretical velocities and the distance along the BB axis. From the figure, it can be seen that air velocity decreases with distance, and the practical values are higher than the theoretical values. Figure 17 shows the air-velocity distribution along the vertical (CC) axis. From the curve shown, it is evident that the air velocity along the CC axis is highest near the collector floor and decreases with height through the chimney.
Figure 17. The relation between the velocity and the distance through the CC axis
Figure 18. The relation of the experimental temperature values with time in the AA axis
Figure 19. The relation of the experimental temperature values with time in the BB axis
Figure 20. The relation of the experimental velocity values with time in the AA axis
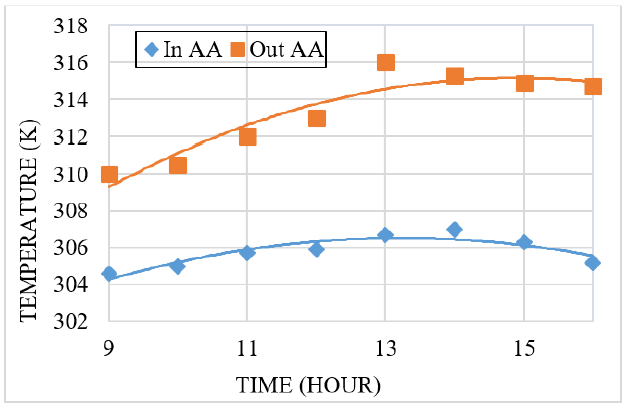
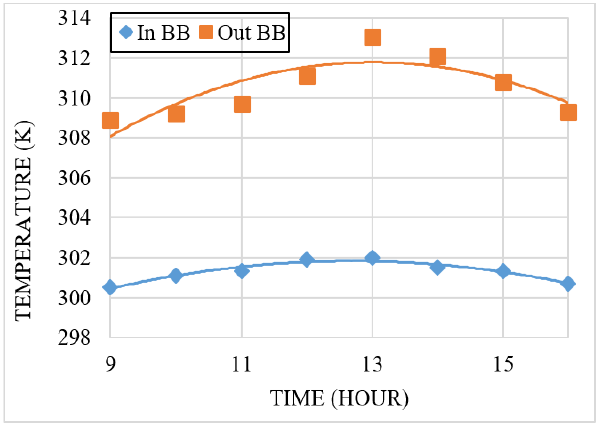
Figure 18 shows the changes in air inlet and outlet temperatures along the AA axis over time during the experiment. From observing the curves, it was found that the air temperature during inlet and outlet changes with time, as it was found to rise until it reaches its peak at approximately 1:00 PM (13:00), as the solar radiation begins to rise and reaches its peak at approximately this time; then the temperature decreases because of the rise in heat loss and the decline in solar radiation. Additionally, the curves illustrate how outdoor air temperature changes during the day in response to variations in solar energy. Figure 19 shows the variation in air inlet and outlet temperatures along the BB axis over time. The figure shows that the air temperature at the inlet and outlet fluctuates over time, rising to a peak, and that the largest difference between the inlet and outlet temperatures is approximately 12 degrees.
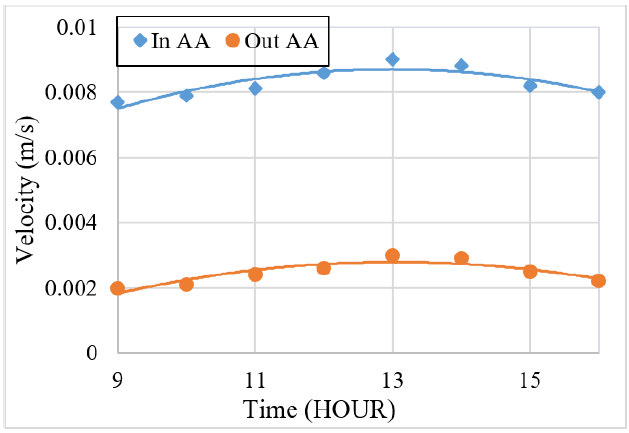
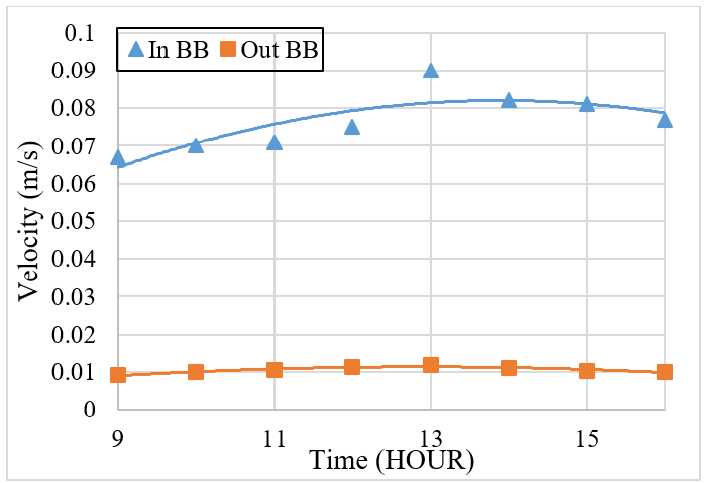
In Figure 20, the change in air velocity between the entrance and exit of air at the AA axis is visible. The picture depicts the change in airspeed as solar radiation peaks at midday, then declines as solar energy diminishes in the afternoon. It is observed that the highest velocity is the speed of air exiting from the sun. The collector is located where the solar collector links to the chimney. Figure 21 depicts how the experimental air velocity measurements vary over time along the BB axis. In this relationship, the velocity rises to its peak between 13:00 and 14:00.
Figure 21. The relation of the experimental velocity values with time in the BB axis
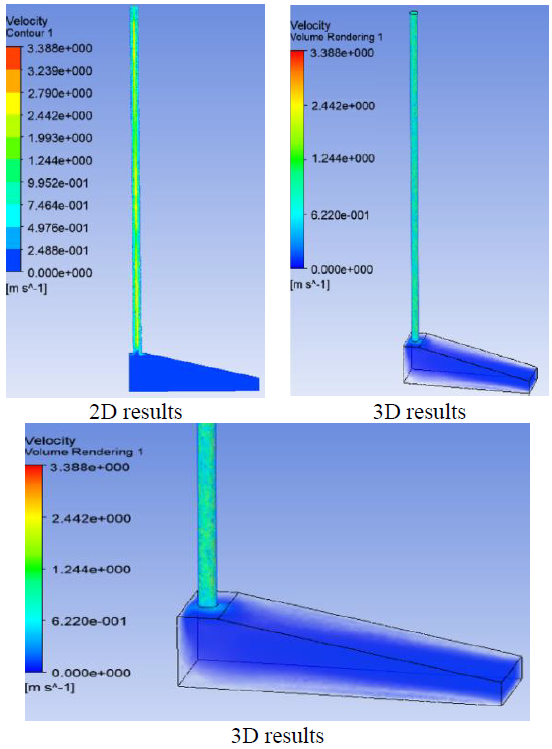
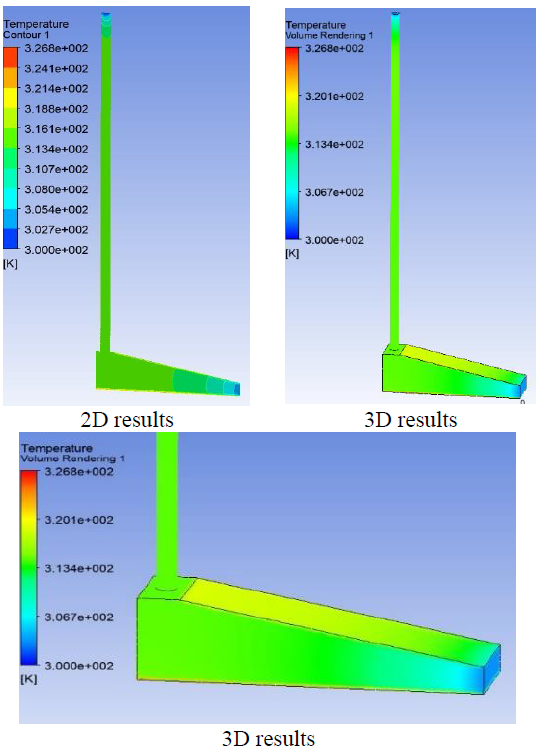
From Figure 22, the 2D and 3D distributions of air velocity in the numerical simulation of the traditional (glass-covered, without PV) SCPP model are shown, obtained with a glass sheet used as the collector cover instead of PV panels. The air velocity, which ranges from 0 to 3.388 m/s, can be seen. The velocity at the base of the chimney (the turbine position) is about 0.75 m/s. In this case, the air velocity differs from the first case (using the PV panels), where the maximum air velocity is 3.33 m/s. This difference between the two air-velocity values is because the heat gained through the glass exceeds that gained through the solar panels. This means that the turbine will produce higher kinetic energy in the plant. The temperature distribution for the traditional (glass-covered, without-PV) SCPP prototype is shown in Figure 23. The maximum temperature reaches 326.8 K. The range of temperature increase in this case is higher than in the first case (with PV panels).
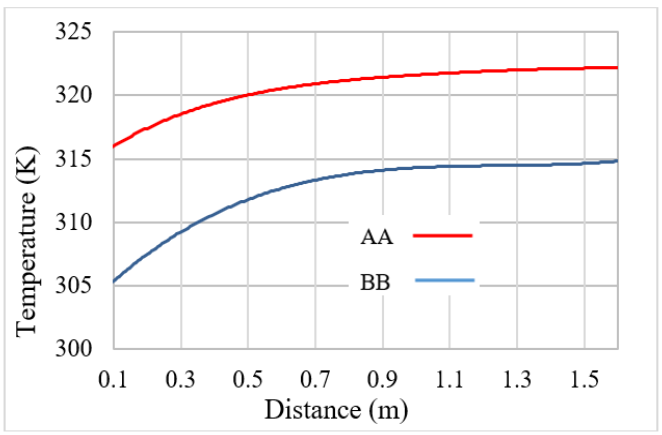
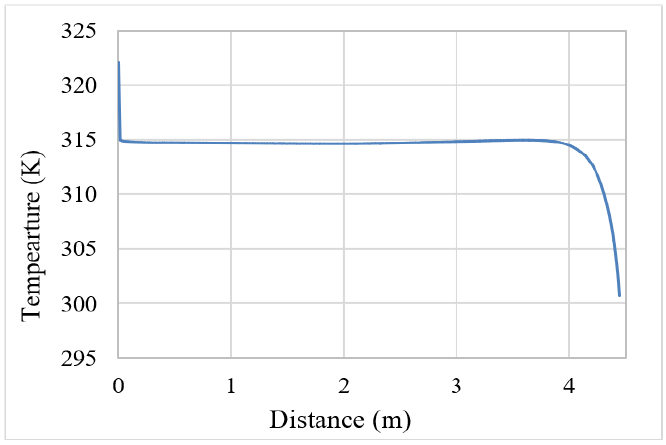
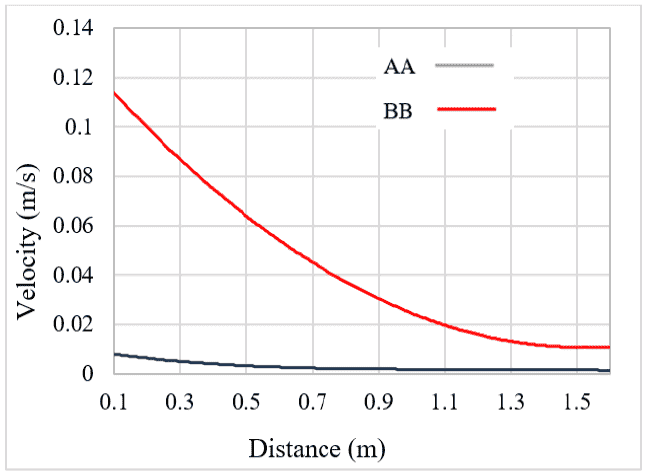
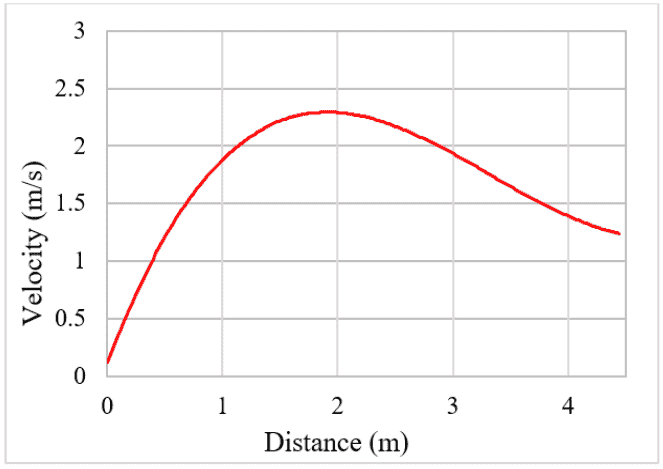
Figure 24 displays the temperature variations along the AA and BB axes. As shown in the figure, the overall temperature reaches a peak of 322 K. Furthermore, Figure 25 illustrates the relationship between temperature and distance along the CC axis. From this figure, it can be observed that the maximum temperature occurs near the ground floor, after which it gradually decreases and remains nearly constant throughout the chimney (CC axis). Figure 26 and Figure 27 show the fluctuation of air velocity using the solar chimney simulation prototype (Case two). Figure 26 shows the air velocity distribution through the AA and BB axis. Meanwhile, Figure 27 displays the same distribution through the CC axis.
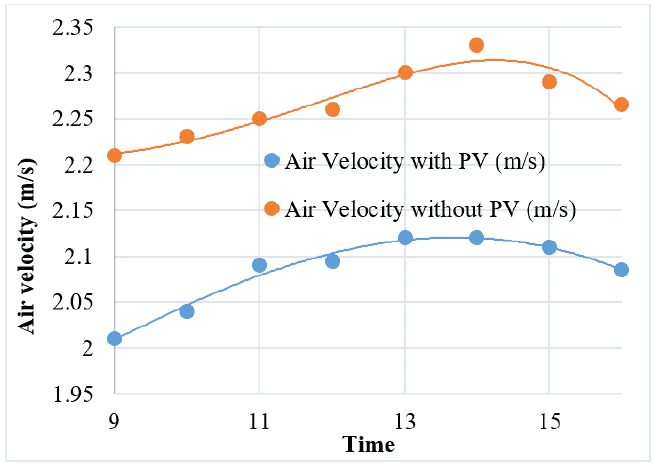
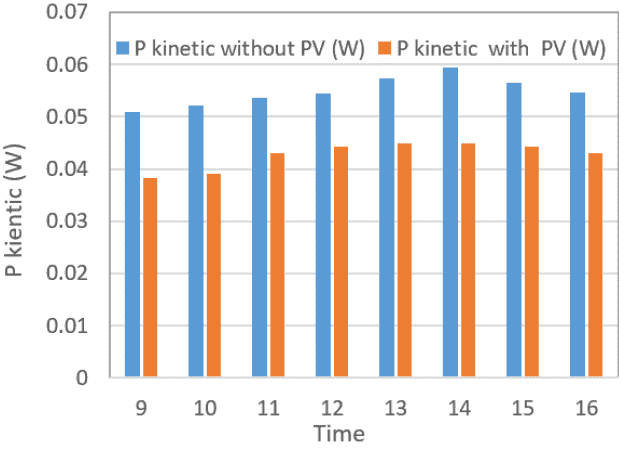
Figure 28 illustrates how the experimental air-velocity values at the chimney base changed over time for two scenarios: one with and one without PV panels. From the figure, it can be seen that the air velocity values increase over time in both cases. The maximum velocity value for the first case (using PV panels) is 2.12 m/s at 13:00. In comparison, the same value for the second case (without PV panels) reaches 2.33 m/s at 14:00. The figure shows that there is a gap between the air velocity values of the two cases, reaching 0.21 m/s. This gap arises because the glass-covered (without-PV) collector transmits more solar radiation to the airflow than the PV-covered collector, giving it a higher heat gain and correspondingly higher air velocity, consistent with the CFD comparison discussed for Figures 22–23. In Figure 29, the relationship between kinetic power and the cases is shown. From the above, it can be seen that the kinetic power without PV panels is higher than with them.
From the above, it was noted that there are two cases, or system arrangements: the first is the hybrid model of SCPP, and the second is the conventional model. In the hybrid SCPP model, the produced power is of two types: electrical power, generated by the PV panels (solar cells), and kinetic power. The hot air produced by heat gain passes through the collector area toward the chimney base, where the available kinetic power is estimated from the measured air velocity using Eqs. (8)–(11), assuming a turbine efficiency of 85% (a representative value from the literature, since no physical turbine-generator unit was instrumented in the present prototype). In the second system, the estimated power is only this kinetic power. From the above, the estimated total power in the first system is higher than that of the conventional model due to the use of PV panels.
The values of the electricity types generated in the hybrid SCPP are displayed in Table 6.
Figure 22. The velocity distribution of the numerical simulation for the prototype
Figure 23. The temperature distribution of the numerical simulation for the prototype
Figure 24. The relation between the temperature values and the distance through the AA and BB lines
Figure 25. The relation between the temperature values and the distance through the CC line
Figure 26. The relation between the velocity values and the distance through the AA and BB lines
Figure 27. The relation between the velocity values and the distance through the CC line
Figure 28. Air velocity values at the chimney base in two cases
Figure 29. The kinetic power in two cases
Reliability of results:
a. Computational fluid dynamics (CFD) validation: The CFD model predictions were compared with experimental measurements at key locations. Table 7 summarizes the comparison. The maximum temperature predicted by CFD was 321.5 K compared to 318.5 K experimentally, an error of 0.94%. The air velocity at the chimney base was 2.10 m/s (CFD) vs. 2.12 m/s (experimental), an error of 0.94%. The average absolute error across all parameters was only 0.74%, indicating excellent agreement between the numerical model and experimental measurements.
Table 6. The electrical and kinetic power in the hybrid solar chimney power plant (SCPP) (first system)
|
Time (Hour) |
Pelectrical (W) |
Pkinetic with PV (W) |
Total Power (W) |
|
9 |
6.1 |
0.0382 |
6.1382 |
|
10 |
12.3 |
0.039 |
12.339 |
|
11 |
15.15 |
0.043 |
15.193 |
|
12 |
19.51 |
0.0442 |
19.5542 |
|
13 |
24.32 |
0.04487 |
24.36487 |
|
14 |
23.9 |
0.04487 |
23.94487 |
|
15 |
20.93 |
0.0442 |
20.9742 |
|
16 |
7.23 |
0.043 |
7.276 |
b. Uncertainty propagation: Using the instrument errors reported in Table 8 and applying Eq. (15), the uncertainties in the final calculated parameters were determined. Table 8 presents the uncertainty for each key output at different times of day.
Table 7. Computational fluid dynamics (CFD) validation against experimental measurements
|
Parameter |
Experimental Value |
CFD Value |
Error |
Error (%) |
|
Max air temperature in collector (K) |
318.5 |
321.5 |
3.0 |
0.94% |
|
Air velocity at chimney base (m/s) |
2.12 |
2.10 |
0.02 |
0.94% |
|
Air velocity at chimney outlet (m/s) |
3.30 |
3.33 |
0.03 |
0.91% |
|
Outlet air temperature (K)
|
312.0
|
312.5
|
0.5
|
0.16%
|
Table 8. Uncertainty propagation for final calculated parameters (Hybrid photovoltaic (PV) case)
|
Time |
Pk (W) |
Uncertainty Pk |
Ppv (W) |
Uncertainty Ppv |
Total Power (W) |
Uncertainty Total |
|
9:00 |
0.0382 |
±8.2% |
6.1 |
±1.3% |
6.1382 |
±4.5% |
|
10:00 |
0.0390 |
±8.2% |
12.3 |
±1.3% |
12.339 |
±3.8% |
|
11:00 |
0.0430 |
±8.2% |
15.15 |
±1.3% |
15.193 |
±3.5% |
|
12:00 |
0.0442 |
±8.2% |
19.51 |
±1.3% |
19.5542 |
±3.2% |
|
13:00 |
0.04487 |
±8.2% |
24.32 |
±1.3% |
24.36487 |
±3.0% |
|
14:00 |
0.04487 |
±8.2 % |
23.9 |
±1.3% |
23.94487 |
±3.0% |
|
15:00 |
0.0442 |
±8.2% |
20.93 |
±1.3% |
20.9742 |
±3.2% |
|
16:00 |
0.0430 |
±8.2% |
7.23 |
±1.3% |
7.276 |
±4.0% |
In this paper, a hybrid PV/ SCPP was studied experimentally and numerically. A practical prototype of the hybrid configuration (PV collector plus hot-water pipes) was built and tested outdoors, alongside a traditional configuration (glass collector plus hot-water pipes), and both were compared with a 3D ANSYS FLUENT CFD model of the same geometry, which agreed with the experimental measurements to within an average absolute error of 0.74%. Replacing part of the glass collector with PV panels reduced the thermal gain driving the airflow, lowering the estimated kinetic power at the chimney base relative to the traditional configuration. However, the PV panels' direct electrical output substantially exceeded this reduction, so the hybrid configuration's total estimated power output was higher throughout the tested period. Because only one PV coverage ratio and prototype arrangement were tested, we do not conclude that reducing the PV-covered area would improve performance; we instead propose testing multiple coverage ratios in future work. These findings are based on a small-scale prototype operated under the specific outdoor conditions of Karbala, Iraq, during daytime hours (09:00-16:00); extending the comparison to larger-scale systems, other climates, and after-sunset operation using the hot-water pipes remains for future study.
[1] Nasrallah, S.A.M., Mohd Rafie, A.S. (2022). The effect of different rotational speeds of a cylinder on Magnus wind turbine performance. International Review of Aerospace Engineering, 15(2): 129-134. https://doi.org/10.15866/irease.v15i2.19719
[2] Ravi Kumar, K., Krishna Chaitanya, N.V.V., Sendhil Kumar, N. (2021). Solar thermal energy technologies and its applications for process heating and power generation – A review. Journal of Cleaner Production, 282: 125296. https://doi.org/10.1016/j.jclepro.2020.125296
[3] Pourasl, H.H., Barenji, R.V., Khojastehnezhad, V.M. (2023). Solar energy status in the world: A comprehensive review. Energy Reports, 10: 3474-3493. https://doi.org/10.1016/j.egyr.2023.10.022
[4] Lin, W., Ma, Z., Wang, S., Sohel, M.I., Lo Cascio, E. (2021). Experimental investigation and two-level model-based optimisation of a solar photovoltaic thermal collector coupled with phase change material thermal energy storage. Applied Thermal Engineering, 182: 116098. https://doi.org/10.1016/j.applthermaleng.2020.116098
[5] Mandal, D.K., Biswas, N., Mahapatra, P.S., Sarkar, S., Manna, N.K. (2024). A critical review of photovoltaic cell integrated solar chimney: Sustainability and power generation. Solar Energy, 284: 113032. https://doi.org/10.1016/j.solener.2024.113032
[6] Ahmed, O.K., Hussein, A.S., Daoud, R.W., Ali, Z.H. (2020). A new method to improve the performance of solar chimneys. AIP Conference Proceedings, 2213(1): 020018. https://doi.org/10.1063/5.0000048
[7] Haaf, W., Friedrich, K., Mayr, G., Schlaich, J. (1983). Solar chimneys, Part I: Principle and construction of the pilot plant in Manzanares. International Journal of Solar Energy, 2(1): 3-20. https://doi.org/10.1080/01425918308909911
[8] Maia, C.B., Silva, F.V.M., Oliveira, V.L.C., Kazmerski, L.L. (2019). An overview of the use of solar chimneys for desalination. Solar Energy, 183: 83-95. https://doi.org/10.1016/j.solener.2019.03.007
[9] Kasaeian, A.B., Molana, S., Rahmani, K., Wen, D. (2017). A review on solar chimney systems. Renewable and Sustainable Energy Reviews, 67: 954-987. https://doi.org/10.1016/j.rser.2016.09.081
[10] Zuo, L., Liu, Z., Ding, L., et al. (2020). Performance analysis of a wind supercharging solar chimney power plant combined with thermal plant for power and freshwater generation. Energy Conversion and Management, 204: 112282. https://doi.org/10.1016/j.enconman.2019.112282
[11] Eryener, D., Hollick, J., Kuscu, H. (2017). Thermal performance of a transpired solar collector updraft tower. Energy Conversion and Management, 142: 286-295. https://doi.org/10.1016/j.enconman.2017.03.052
[12] Eryener, D., Kuscu, H. (2018). Hybrid transpired solar collector updraft tower. Solar Energy, 159: 561-571. https://doi.org/10.1016/j.solener.2017.11.035
[13] Ahmed, O.K., Hussein, A.S. (2018). New design of solar chimney (case study). Case Studies in Thermal Engineering, 11: 105-112. https://doi.org/10.1016/j.csite.2017.12.008
[14] Boutina, L., Khelifa, A., Touafek, K., Lebbi, M., Baissi, M.T. (2018). Improvement of PVT air-cooling by the integration of a chimney tower (CT/PVT). Applied Thermal Engineering, 129: 1181-1188. https://doi.org/10.1016/j.applthermaleng.2017.10.097
[15] Ahmed, O.K., Bawa, S.M. (2018). Reflective mirrors effect on the performance of the hybrid PV/thermal water collector. Energy for Sustainable Development, 43: 235-246. https://doi.org/10.1016/j.esd.2018.02.001
[16] Hassan, A.A., Ahmed, O.K., Abbas, E.F. (2021). Experimental study of the performance of the solar chimney. IOP Conference Series: Materials Science and Engineering, 1094(1): 012046. https://doi.org/10.1088/1757-899X/1094/1/012046
[17] Ahmed, O.K., Mohammed, Z.A. (2017). Influence of porous media on the performance of hybrid PV/Thermal collector. Renewable Energy, 112: 378-387. https://doi.org/10.1016/j.renene.2017.05.061
[18] Zhou, X., Yang, J., Wang, J., Xiao, B. (2009). Novel concept for producing energy integrating a solar collector with a man-made mountain hollow. Energy Conversion and Management, 50(3): 847-854. https://doi.org/10.1016/j.enconman.2008.09.006
[19] Hussam, W.K., Salem, H.J., Redha, A.M., Khlefat, A.M., Al Khatib, F. (2022). Experimental and numerical investigation on a hybrid solar chimney-photovoltaic system for power generation in Kuwait. Energy Conversion and Management: X, 15: 100249. https://doi.org/10.1016/j.ecmx.2022.100249
[20] Zhou, X., Yang, J., Xiao, B., Hou, G. (2007). Simulation of a pilot solar chimney thermal power generating equipment. Renewable Energy, 32(10): 1637-1644. https://doi.org/10.1016/j.renene.2006.07.008
[21] Koonsrisuk, A., Chitsomboon, T. (2013). Mathematical modeling of solar chimney power plants. Energy, 51: 314-322. https://doi.org/10.1016/j.energy.2012.10.038
[22] Holman, J.P. (1986). Heat Transfer (6th ed.). McGraw-Hill.
[23] Shneishil, A.H., Dahloos, J.O., Mohammed, K.G. (2022). Investigation of a solar space heating system based on an evacuated tube collector for Baghdad climatic conditions. Karbala International Journal of Modern Science, 8(4): 607-616. https://doi.org/10.33640/2405-609X.3261
[24] Cisse, E.H.I., Thiam, A., Ndiogou, B.A., Azilinon, D., Sambou, V. (2022). Experimental investigation of solar chimney with concentrated collector (SCCC). Case Studies in Thermal Engineering, 35: 101965. https://doi.org/10.1016/j.csite.2022.10196