José Carlos Miranda Lope | Danny Edwardh Navarro Ylachoque | Edmundo Honorio Ocola Ticona | Karina Cecilia Bustamante Flores | Christofer Alex Diaz Arapa*
© 2026 The authors. This article is published by IIETA and is licensed under the CC BY 4.0 license (http://creativecommons.org/licenses/by/4.0/).
OPEN ACCESS
Pump as Turbine (PAT) systems are a sustainable and cost-effective alternative for small-scale hydropower generation through the repurposing of conventional centrifugal pumps. However, off-design operation can induce hydraulic instabilities, vortex formation, pressure pulsations, and conditions favorable to cavitation, thereby affecting system performance and reliability. This study presents a transient Computational Fluid Dynamics (CFD) analysis of a centrifugal pump operating in turbine mode using ANSYS CFX. The numerical model employed the Scale-Adaptive Simulation Shear Stress Transport (SAS-SST) turbulence model together with the Schnerr-Sauer cavitation model to investigate hydraulic instabilities and cavitation susceptibility under transient operating conditions. Hydraulic performance was evaluated for different mass flow rates, identifying the most favorable operating condition at approximately 5 kg/s. Flow behavior was characterized using turbulent kinetic energy (TKE) contours and Q-criterion vortex identification, revealing intense vortex activity near the blade trailing edges and strong rotor-stator interaction in the volute tongue region. Pressure fluctuation signals extracted at critical locations were analyzed using the Fast Fourier Transform (FFT) and the Short-Time Fourier Transform (STFT). A dominant spectral peak was identified at approximately 94.45 Hz, close to the second rotational harmonic of the impeller shaft frequency, indicating that the impeller region is the primary source of dynamic excitation. The results demonstrate a strong relationship between off-design operation, vortex activity, low-pressure regions, and increased pressure fluctuations. Finally, an operational map was proposed to classify stable, transient, and instability-prone operating regions, providing practical guidance for the safe operation of PAT systems in small-scale hydropower applications.
cavitation, Computational Fluid Dynamics, vibro-acoustic analysis, pressure fluctuation, Pump as Turbine, transient simulation, spectral analysis
The growing demand for greater energy efficiency and the integration of sustainable technologies has driven the development of economically viable renewable energy systems. In this context, Pump as Turbine (PAT) technology has emerged as an attractive alternative for micro-hydroelectric power generation. This is primarily because conventional centrifugal pumps, when operated in reverse, can effectively recover hydraulic energy at a significantly lower investment cost compared to dedicated turbines [1-4].
PAT systems offer significant economic and environmental benefits, stemming from their ability to reuse existing hydraulic equipment and enable decentralized power generation in applications such as water distribution networks, irrigation systems, and small-scale hydraulic facilities [5, 6]. However, since centrifugal pumps are intrinsically designed for pumping operations, their use in reverse as turbines often generates hydraulic conditions that do not optimally match their operating parameters.
When operating under suboptimal conditions, various internal flow phenomena may occur, such as flow separation, recirculation, vortex formation, pressure pulsations, and cavitation. Together, these phenomena contribute to reduced hydraulic performance and can lead to vibrations, noise, material erosion, and ultimately premature mechanical failure [7-10]. Consequently, a thorough understanding of the behavior of unstable internal flow in PAT systems is essential to improve their reliability and expand their operating range.
Previous research has focused primarily on macroscopic performance parameters, such as head and overall efficiency [5, 11]. However, the complex relationship between vortex dynamics, cavitation evolution, and pressure-based vibro-acoustic indicator under transient conditions has received little attention. Recent studies on cavitation in hydraulic turbomachinery and PAT systems highlight that the lack of integrated analyses that couple these phenomena limits the ability to predict instabilities and failures under off-design operating conditions [7, 12].
For this reason, this study proposes a novel coupled analysis framework for PAT systems that simultaneously integrates high-fidelity transient Computational Fluid Dynamics (CFD) simulation using the Scale-Adaptive Simulation Shear Stress Transport (SAS-SST) turbulence model and the Schnerr-Sauer cavitation model with advanced vibro-acoustic signal processing via Fast Fourier Transform (FFT) and Short-Time Fourier Transform (STFT). Unlike previous studies, which have focused primarily on the overall hydraulic performance of PAT systems [1-6], on the identification of vortex structures in turbulent flows [13-17], or on the detection of cavitation using acoustic signals in conventional centrifugal pumps [8, 9], addressing each phenomenon independently, this work constitutes, to the best of the authors’ knowledge, one of the first to jointly asses and qualitatively relate vortical dynamics, incipient cavitation, and the pressure-based vibro-acoustic indicator on a PAT under real transient operating conditions. Additionally, an operating map is proposed that classifies regions of stable, transient, and unstable operation, providing a practical tool for the safe selection of operating conditions in micro-hydropower applications.
2.1 Geometry and Pump as Turbine description
The hydraulic machine analyzed in this study corresponds to a centrifugal pump model 32-125 adapted to operate as a PAT. The internal fluid domain was reconstructed in ANSYS Space Claim based on the main geometric dimensions of the original equipment. The machine consists of a radial impeller housed inside a single-volute casing and connected to a rotating shaft.
The impeller diameter is 154 mm, the nominal rotational speed is 2,900 rpm, and the rotor contains nine blades. The nominal pump flow rate under conventional operation is 20 m³/h.
The main geometric and operating parameters of the analyzed PAT are summarized in Table 1.
Table 1. Main geometric and operating parameters of the Pump as Turbine (PAT)
|
Parameter |
Value |
Units |
|
Impeller Diameter |
154 |
mm |
|
Inlet Diameter |
30 |
mm |
|
Outlet Diameter |
64 |
mm |
|
Number of Blades |
9 |
|
|
Nominal RPM |
2,900 |
rpm |
|
Nominal Flow Rate |
20 |
m3/h |
|
Impeller Material |
AISI 316 |
|
Regarding materials, the casing was considered as grey cast iron EN-GJL-250, while the impeller was assumed to be manufactured from AISI 316 stainless steel due to its superior resistance to corrosion and cavitation damage.
2.2 Computational domain and mesh generation
The computational domain was divided into three regions: the inlet section, the rotating impeller domain, and the outlet volute region. To ensure the proper transfer of flow variables between the stationary and moving zones, the shared topology technique was used, and non-conforming mesh interfaces were configured. An unstructured mesh was generated using primarily tetrahedral elements due to the geometric complexity of the impeller and volute, which facilitates adequate discretization of curved surfaces and regions with abrupt geometric changes. This type of mesh is widely used in CFD simulations of hydraulic turbomachinery due to its geometric flexibility and ability to represent complex rotating domains [11, 18-25]. Additionally, automatic local refinements were applied in regions near the blades and areas of high curvature to improve the resolution of velocity and pressure gradients.
To properly capture the flow gradients and complex geometry of the blades, automatic refinement functions for curvature and proximity were activated on the impeller surfaces. This allows for a smooth mesh transition and an automatic increase in element density at the leading and trailing edges of the blades, ensuring the quality necessary for model convergence.
The three-dimensional geometry of the PAT is illustrated in Figure 1.

Figure 1. Geometry of the Pump as Turbine (PAT)
The computational mesh generated for the CFD simulations is presented in Figure 2.

Figure 2. Computational domain mesh
2.3 Governing equations
The internal hydrodynamic behavior of the PAT was investigated using a transient CFD model, combined with post-processing of the pressure signal. The methodology combines flow simulation with turbulence resolution, cavitation prediction, vortex identification, and time-frequency analysis to characterize the relationship between hydraulic instabilities and pressure-based vibro-acoustic indicator.
The governing flow field was solved using the incompressible Reynolds-Averaged Navier-Stokes (RANS) equations. The continuity equation is written as Eq. (1):
$\begin{gathered}\frac{\partial \bar{u}_i}{\partial x_i}=0 \rho\left(\frac{\partial \bar{u}_i}{\partial t}+\bar{u}_j \frac{\partial \bar{u}_i}{\partial x_j}\right) =-\frac{\partial \bar{p}}{\partial x_i}+\frac{\partial}{\partial x_j}\left(\mu \frac{\partial \bar{u}_i}{\partial x_j}-\rho \overline{u_i u_j}\right) \bar{u}_i\end{gathered}$ (1)
where, $\bar{u}_i$ and $\bar{p}$, are the averaged velocity and pressure, and $y-\rho \overline{u_i u_j}$ is the Reynolds stress tensor.
To improve the prediction of unstable separated flow and rotor-stator interaction, the SAS-SST turbulence model was adopted. This model allows for the capture of transient turbulent structures and separation regions with greater accuracy than conventional RANS models, especially in applications dominated by vortex shedding and strong pressure gradients. Previous studies related to vortex dynamics, cavitation, and transient CFD simulations in turbomachinery have demonstrated that adaptive resolution approaches are suitable for analyzing highly unstable hydraulic phenomena [14-20]. Consequently, the SAS-SST model is appropriate for studying the hydrodynamic and vibro-acoustic behavior of the analyzed PAT system.
Coherent vortical structures are identified and quantified using the Q-criterion [18], defined as the second invariant of the velocity gradient tensor $\nabla v$:
$Q=\frac{1}{2}\left(\|\Omega\|^2-\|S\|^2\right)$ (2)
where, S is the strain-rate tensor:
$S=\frac{1}{2}\left(\nabla \vec{v}+(\nabla \vec{v})^T\right)$ (3)
and Ω is the rotation tensor:
$\Omega=\frac{1}{2}\left(\nabla \vec{v}-(\nabla \vec{v})^T\right)$ (4)
Regions with Q > 0 (where rotation dominates over shear strain) are identified as vortex cores. Vorticity is written as Eq. (5):
$\vec{\omega}=\nabla \times \vec{v}$ (5)
Cavitation is predicted using a mass transport model for the vapor fraction αv. The Schnerr-Sauer model is employed, defining the evaporation and condensation rates $\dot{\mathrm{R}}_{\mathrm{e}}$ and $\dot{\mathrm{R}}_{\mathrm{c}}$ as:
$\begin{aligned} & \dot{R}_e=\frac{3 \rho_v \rho_l}{\rho} \alpha_v\left(1-\alpha_v\right) \frac{1}{R_B} \sqrt{\frac{2}{3} \frac{\max \left(\rho_v-\rho, 0\right)}{\rho_l}}, \text { si } \mathrm{p} \leq \mathrm{pv}\end{aligned}$ (6)
$\dot{R}_c=\frac{3 \rho_v \rho_l}{\rho} \alpha_v \frac{1}{R_B} \sqrt{\frac{2}{3} \frac{\max \left(\rho-\rho_v, 0\right)}{\rho_l}}$, si $\mathrm{p} \geq \mathrm{pv}$ (7)
where, ρl and ρv are the liquid and vapor densities, RB is the bubble radius, ρ is the local pressure, and ρv is the vapor pressure. The evolution of the vapor fraction is written as Eq. (8):
$\frac{d}{d t}\left(\alpha_v \rho_v\right)+\nabla \cdot\left(\alpha_v \rho_v \vec{v}\right)=\dot{R}_e-\dot{R}_c$ (8)
The cavitation number σ was calculated as Eq. (9):
$\sigma=\frac{p_{ {inlet }}-p_v}{\frac{1}{2} \rho U_{{tip }}^2}$ (9)
The cavitation parameters obtained were used as supplementary indicators to assess trends in cavitation susceptibility under various operating conditions of the PAT.
And the available suction head is written as Eq. (10):
$N P S H_d=\frac{p_{{inlet }}-p_v}{\rho g}$ (10)
Here, Utip is the impeller tip speed and pinlet is the inlet pressure. In this study, a practical engineering criterion was adopted whereby cavitation susceptibility was considered significant when the vapor volume exceeded 0.5% of the rotor-domain volume. This threshold was introduced as an internal indicator to facilitate comparison among operating conditions and should not be interpreted as a universally validated cavitation inception criterion. This criterion is used as a practical reference to identify the initial development of significant cavitation within hydraulic turbomachines, allowing the growth of vapor cavities to be associated with increased hydraulic instabilities and pressure fluctuations [7, 12].
Vibrational excitation is analyzed based on time series of fluctuating pressure p(t) extracted at critical points in the domain (housing, blade, rotor-volute interface). The frequency content is obtained using the FFT, by calculating the Power Spectral Density (PSD):
$P_{x x}(f)=\frac{1}{N F_s}\left|\sum_{n=1}^n p[n] e^{-\frac{i 2 \pi f n}{F_s}}\right|^2$ (11)
To evaluate transient spectral evolution caused by intermittent cavitation and vortex shedding, the STFT was applied:
$\operatorname{STFT}(t, f)=\int_{-\infty}^{\infty} p(\tau) w(\tau-t) e^{-i 2 \pi f \tau} d \tau$ (12)
Using a Hamming window w(t). The blade passing frequency (BPF) and its harmonics, which are mainly responsible for forced excitation, are calculated with Eq. (13):
$B P F=\frac{N_{ {blades }} \cdot R P M}{60}$ (13)
This parameter allows quantifying the dynamic correlation between pressure sources in different regions of the PAT.
Finally, the combined hydraulic and spectral indicators were integrated into an operational map that correlates mass flow rate, pressure head, vortex intensity, and dominant spectral amplitudes. This approach makes it possible to identify stable, transient, and potentially unstable operational regions for PAT applications.
The hydraulic head was calculated from the pressure difference between the inlet and outlet sections according to Eq. (14):
$H=\frac{P_{ {inlet }}-P_{ {outlet }}}{\rho g}$ (14)
where, H is the hydraulic head (m), Pinlet and Poutlet are the area-average static pressures obtained from CFD (Pa), ρ is the water density (kg·m-3) and g is the gravitational acceleration (9.81 m·s-2).
2.4 Mesh independence study
To ensure that the numerical results were independent of mesh resolution while maintaining a reasonable computational cost, a mesh independence study was carried out. Five meshes with different densities were generated by varying the base element size. The study was performed under nominal operating conditions, using an inlet mass flow rate of 5 kg/s for the simulation. The control variable selected to evaluate convergence was the torque generated by the impeller. The details of the evaluated meshes are summarized in Table 2.
Table 2. Mesh independence study and torque convergence
|
Mesh |
Element Size (m) |
Elements |
Torque (N·m) |
Relative Difference (%) |
|
1 |
0.003 |
247,126 |
16.513 |
-- |
|
2 |
0.002 |
583,863 |
17.374 |
4.95 |
|
3 |
0.0019 |
649,316 |
17.850 |
2.66 |
|
4 |
0.0016 |
923,376 |
17.634 |
1.22 |
|
5 |
0.0015 |
1,070,156 |
17.627 |
0.04 |
A mesh independence analysis was performed to evaluate the influence of mesh refinement on the torque obtained in the simulation. To this end, five mesh levels were generated with progressively smaller element sizes, ranging from 0.003 m to 0.0015 m. The results show that the torque exhibits significant variations in the initial stages of refinement, with a relative difference of 4.95% between the first two meshes. However, starting with the third mesh, these variations decrease considerably, reaching values of 2.66%, 1.22%, and finally 0.04% between consecutive refinements. This behavior demonstrates a clear trend toward numerical convergence, indicating that the result becomes practically independent of the mesh size. Consequently, mesh 4 is considered an adequate solution, as it offers an optimal balance between accuracy and computational cost, without additional refinements generating significant changes in the calculated torque.
The convergence trend observed in this study is consistent with previous numerical research on hydraulic turbomachinery and PAT systems, where further refinements beyond a certain number of elements result in minimal changes in integral parameters such as head, torque, or efficiency. Several authors report that differences of less than 2% between consecutive refinements can be considered acceptable to ensure mesh independence in transient CFD simulations of hydraulic pumps and turbines [18, 19]. In this case, mesh 4 showed a reduced variation compared to the most refined mesh, maintaining adequate numerical stability and a reasonable computational cost.
Mesh 4, consisting of 923, 376 elements, was selected for all subsequent steady and transient simulations because the torque difference relative to the finest mesh (Mesh 5) was only 0.04%, while requiring lower computational cost.
2.5 Boundary conditions and numerical setup
The numerical simulation was developed considering the operation of the pump in turbine mode (PAT), reversing the flow direction compared to its conventional operation. The main numerical setup and boundary conditions are summarized in Table 3. The computational domain consisted of two stationary regions (suction and volute) and one rotating region corresponding to the impeller.
Table 3. Main numerical setup and boundary conditions
|
Parameter |
Value |
|
Working fluid |
Water at 25 ℃ |
|
Inlet condition |
Mass flow rate (5 kg/s) |
|
Outlet condition |
Static pressure opening |
|
Rotational speed |
2,900 rpm |
|
Turbulence model |
SAS-SST |
|
Cavitation model |
Schnerr-Sauer |
|
Interface model |
Transient Rotor-Stator |
|
Spatial discretization |
High resolution |
|
Residual target |
10-5 |
At the inlet of the domain, corresponding to the original discharge of the pump, a mass flow inlet boundary condition was imposed, defining a mass flow rate of 5 kg/s for the case that used the SST-SAS turbulence model, a representative value of the hydraulic performance condition obtained in the study. At the outlet, associated with the original suction, an opening condition with a static reference pressure was established, allowing the development of a transient recirculation without compromising numerical stability.
The impeller was modeled using a rotating reference frame with a constant angular velocity of 2,900 rpm, while the remaining regions were maintained in a stationary reference frame. All solid surfaces were defined with a no-slip condition, assuming hydraulically smooth walls.
The interaction between the rotating and stationary domains was resolved using fluid-fluid interfaces. The frozen rotor scheme was used to initialize the flow field, obtaining an initial steady-state solution. Subsequently, the transient analysis was carried out using the transient rotor-stator model, which allowed capturing the unsteady effects associated with the periodic passage of the blades and the rotor-stator interaction.
The working fluid was modeled as incompressible liquid water at room temperature. Cavitation was represented using the Schnerr-Sauer model, which simulates the processes of evaporation and condensation based on the local fluid pressure.
The Schnerr-Sauer cavitation model was implemented using the default parameters of the ANSYS CFX solver for liquid water and water vapor at room temperature. The model considers a constant initial bubble radius, as well as evaporation and condensation mechanisms controlled by local differences between the fluid pressure and the vapor pressure. The vapor pressure of water was set considering operating conditions at 25 ℃, while the thermophysical properties of the liquid and vapor were automatically defined by the software library. This approach has been widely used in CFD simulations of cavitation in pumps and hydraulic turbomachines [7, 12, 17, 25].
A second-order scheme was employed for spatial discretization, ensuring an adequate resolution of pressure and velocity gradients. The pressure-velocity coupling was resolved using the implicit algorithm of the ANSYS CFX solver.
The convergence of the solution was evaluated by monitoring the residuals of the conservation equations, setting a criterion of values below 10⁻⁵. Additionally, the stability of integral variables such as torque and mean pressure at the control points was verified, ensuring the consistency of the transient solution.
The main numerical setup and boundary conditions adopted in the transient CFD simulations are summarized in Table 3.
Hydraulic performance calculations were performed for five operating conditions ranging from 1 to 5 kg/s. However, the detailed transient CFD simulation, including SAS-SST turbulence modeling, Schnerr, Sauer cavitation modeling, pressure signal extraction, FFT, STFT, turbulent kinetic energy (TKE) analysis and Q-criterion vortex identification, was conducted only for the 5 kg/s case, which exhibited the highest hydraulic head within the investigated range.
2.6 Transient configuration and monitoring points
The numerical analysis was performed using the transient solver ANSYS CFX to capture the unsteady state phenomena associated with vortex dynamics and cavitation in the PAT.
The SAS-SST model was used to model the turbulence. This model allows for the resolution of turbulent structures of different scales through the dynamic adaptation of the turbulent length scale, improving the prediction of transient phenomena compared to conventional RANS models.
The phenomenon of cavitation was incorporated using the Schnerr-Sauer model, based on the dynamics of spherical bubbles. This model simulates the processes of growth and collapse of vapor cavities based on local pressure variations.
The simulation was run in transient mode with a time step of 0.0005 s, chosen as a compromise between temporal resolution and computational cost. The total simulation time was 0.1148 s, approximately equivalent to 5.5 complete revolutions of the impeller. This time interval allowed for the proper capture of the periodic nature of pressure fluctuations and the development of transient vortical structures within the domain. Previous studies on transient hydraulic turbomachinery and PAT systems have shown that several consecutive revolutions are generally sufficient to obtain representative pressure signals for spectral analysis and characterization of unsteady flow phenomena [11, 12, 17]. Additionally, during the simulation, the periodic stabilization of monitored variables such as pressure and torque was verified, ensuring the temporal representativeness of the obtained results. This value allows for the correct capture of periodic fluctuations associated with the rotation frequency, rotor-stator interaction, and transient vortex structures present in hydraulic turbomachines. Previous research on transient CFD simulations of cavitating hydraulic machinery has employed time steps of the same order of magnitude to resolve unsteady pressure fluctuations and vortex related phenomena [11, 12, 17]. Moreover, the time step size provides sufficient resolution for subsequent spectral analysis using FFT and STFT.
It was verified that the time step size meets an appropriate temporal resolution criterion for the system's characteristic frequencies, particularly the rotational frequency and its harmonics.
For the vibro-acoustic analysis, three pressure monitoring points were defined in critical regions of the domain: (i) the suction zone, (ii) the interior of the impeller, especially in areas prone to cavitation, and (iii) the zone of the volute blade, where rotor-stator interaction occurs.
The pressure signals obtained at these points were recorded over time and subsequently processed using spectral analysis tools, specifically the FFT and the STFT, to identify the dominant frequencies and their temporal evolution. This configuration allowed for a direct correlation to be established between the unsteady flow structures, cavitation activity, and the pressure-based vibro-acoustic indicator of the system.
2.7 Signal processing (Fast Fourier Transform/Short-Time Fourier Transform)
The transient pressure signals recorded at the monitoring points (suction region, impeller zone, and tongue of the volute) were exported from ANSYS CFX in CSV format and subsequently processed in MATLAB. The sampling interval was equal to the transient CFD time step, Δt = 0.0005 s, resulting in a sampling frequency of 2000 Hz and a Nyquist limit of 1000 Hz.
Before the frequency analysis, the mean value of each pressure signal was removed to isolate the fluctuating component. Next, the FFT was applied to each dataset, and the corresponding unilateral amplitude spectra were obtained to identify the dominant excitation frequencies.
Comparative FFT spectra were generated for the three monitoring points in order to determine the region with the highest pressure pulsation intensity. Special attention was given to the impeller region due to its greater susceptibility to vortex interaction and cavitation-related instabilities.
To investigate the unsteady behavior, the STFT was applied to the impeller pressure signal using overlapping moving windows with an 80% overlap. The FFT length was automatically adjusted according to the selected window size. The resulting spectrograms allowed the identification of transient frequency bands possibly associated with vortex shedding, rotor-stator interaction and intermittent cavitation-related phenomena.
The MATLAB post-processing procedure provided the spectral indicators used to correlate the hydraulic instabilities predicted by CFD with the pressure-based vibro-acoustic indicator of the PAT.
Unless otherwise stated, all transient flow visualizations and spectral analyses correspond to the 5 kg/s operating condition.
3.1 Flow structure and turbulent regions
To examine the behavior of the internal flow of the PAT operating in turbine mode, the distribution of TKE in the mid-plane of the impeller was analyzed. Figure 3 shows the predicted contours obtained from the transient CFD simulation.

The highest levels of TKE were concentrated near the trailing edges of the blades and in the region of the volute tongue. These areas are associated with intense velocity gradients, local recirculation, and wake formation caused by the interaction between the flow of the rotating impeller and the stationary casing.
This behavior is predictable when a centrifugal pump operates in reverse mode, as the internal passages were originally designed for pumping and not for energy recovery. As a result, the inlet flow is not completely aligned with the blade geometry, which promotes localized separation and the formation of unstable flow structures.
The concentration of turbulence in these regions also indicates higher hydraulic losses and greater pressure fluctuation intensity. From an operational standpoint, these areas are relevant because they can act as precursors to vibrations, noise generation, and the onset of cavitation under off-design conditions.
The transient SAS-SST model consistently captured these characteristics, allowing for the identification of localized unstable structures that would be difficult to observe using steady-state approaches. From a physical perspective, the concentration of TKE at the blade exit reflects the formation of turbulent mixing layers where the high-speed fluid leaving the channel interacts with the lower-speed fluid in the volute, promoting momentum exchange and the generation of small-scale Kelvin-Helmholtz structures. In the tongue region, the high TKE is a direct consequence of the periodic interaction between the blade wakes and the stationary geometry, a mechanism that constitutes the main source of local hydraulic losses and a precursor to the pressure pulsations recorded in the spectral analysis.
3.2 Vortex dynamics based on Q-criterion
To understand how instabilities generated by flow separation propagate through the machine, coherent vortex structures are identified using the Q-criterion. Figure 4 shows the three-dimensional isosurfaces of the vortex cores inside the impeller, colored according to the magnitude of the local velocity. This method allows for high-resolution visualization of the three-dimensional vortex structures.
Figure 4 reveals a massive flow separation immediately downstream of the leading edge of the blades. The sudden acceleration of the fluid with an anomalous angle of incidence generates high-energy vortices that detach from the suction surface. The results show that these structures maintain their spatial coherence. It is possible to observe how these macrostructures do not dissipate quickly, but instead maintain their spatial coherence and form complex wakes that partially block the impeller channel. These structures are carried by the main flow at speeds exceeding 25 m/s (yellow and orange areas), transporting a large amount of kinetic energy. The transport and subsequent interaction of these vortices with the cavitation zones and the geometry of the volute constitute a plausible source of the pressure pulsations observed in the pressure- based vibro-acoustic indicator.

This condition is reflected in the pressure-fluctuation analysis, where the highest amplitudes in the frequency spectrum occur under conditions close to cavitation, demonstrating the relationship between hydraulic performance and the dynamic response of the system. Physically, the spatial coherence of these vortical structures implies that they transport significant kinetic energy along the impeller channel before dissipating, acting as vectors for transmitting pressure disturbances from the impeller to the volute. This mechanism explains why the highest spectral amplitudes are recorded in the impeller and not in the suction, as it is precisely in the impeller where the coherent vortices interact with the local low-pressure zones, favoring incipient cavitation and amplifying the pressure fluctuations that propagate toward the casing.
3.3 Hydraulic performance and operating condition
The hydraulic response of the PAT was evaluated under different inlet mass flow rates in order to identify the most favorable operating condition within the analyzed range. Table 4 summarizes the predicted inlet pressure, outlet pressure, pressure difference, and hydraulic head obtained from the transient simulations.
The hydraulic head values reported in Table 4 and Figure 5 were calculated using Eq. (14).
Table 4. Hydraulic results for different flow conditions
|
Flow Rate (kg/s) |
Inlet (Pa) |
Outlet (Pa) |
Pressure Difference (Pa) |
Head (m) |
|
1 |
515,422 |
2,753.4 |
512,688.6 |
49.734 |
|
2 |
414,360 |
28,943 |
385,417 |
39.288 |
|
3 |
439,771 |
31,339.7 |
408,431.3 |
41.634 |
|
4 |
518,385 |
34,807.3 |
483,577.7 |
49.294 |
|
5 |
621,300 |
40,841.9 |
580,458.1 |
59.170 |

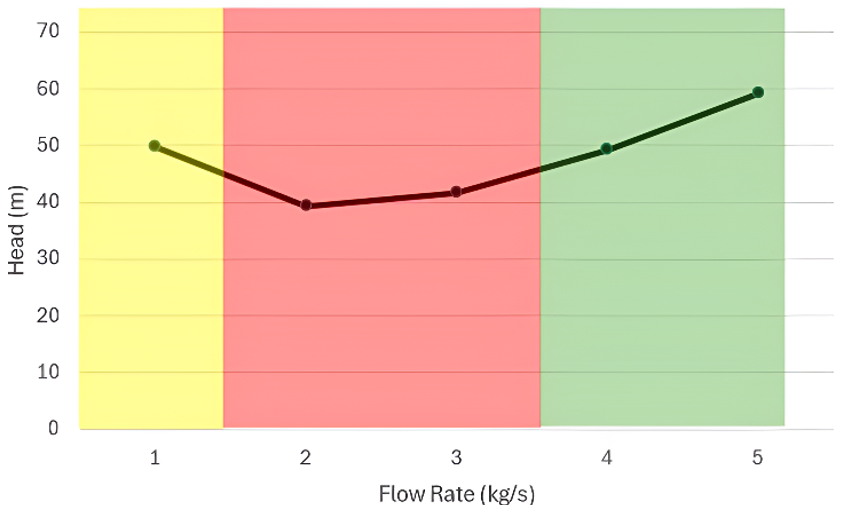
Figure 5. Hydraulic head as a function of mass flow rate calculated from the Computational Fluid Dynamics (CFD) pressure difference between inlet and outlet using Eq. (14)
This type of non-monotonic behavior in the head-flow curve of PAT systems has been documented in previous numerical and experimental studies, where operation away from the pump’s original design point generates flow regimes that are qualitatively different from those observed in conventional turbines, with recirculation and incidence losses dominating at low flow rates and a progressive improvement in energy conversion as flow increases [5, 11].
Among the evaluated cases, the highest hydraulic head was obtained at an inlet mass flow rate of 5 kg/s, reaching approximately 59.17 m. This suggests that, within the tested interval, this condition provides the most favorable hydraulic behavior.
The trend observed in Figure 5 indicates that operation away from this region may lead to a reduction in pressure conversion efficiency and a higher probability of internal flow disturbances. At lower flow rates, the machine is more susceptible to recirculation and incidence losses, whereas excessive flow conditions may intensify separation and rotor–stator interaction effects.
Although the best efficiency point (BEP) cannot be precisely determined without measurements of shaft power and overall efficiency, the current results allow for the identification of a hydraulically favorable zone near 5 kg/s. Physically, the minimum hydraulic head observed around 2 kg/s can be attributed to the coexistence of internal recirculation losses and anomalous incidence losses at the leading edge of the blades, conditions that intensify when the flow rate significantly deviates from the pump's original design point. As the flow increases toward 5 kg/s, the flow tends to align better with the internal geometry of the impeller, reducing recirculation and progressively improving the conversion of kinetic energy into static pressure, which is reflected in the sustained increase in hydraulic head.
These findings are useful for the preliminary planning of the operation of PATs, especially in variable flow systems where it is essential to select a stable operating range.
3.4 Pressure-based vibro-acoustic indicator (Fast Fourier Transform/Short-Time Fourier Transform)
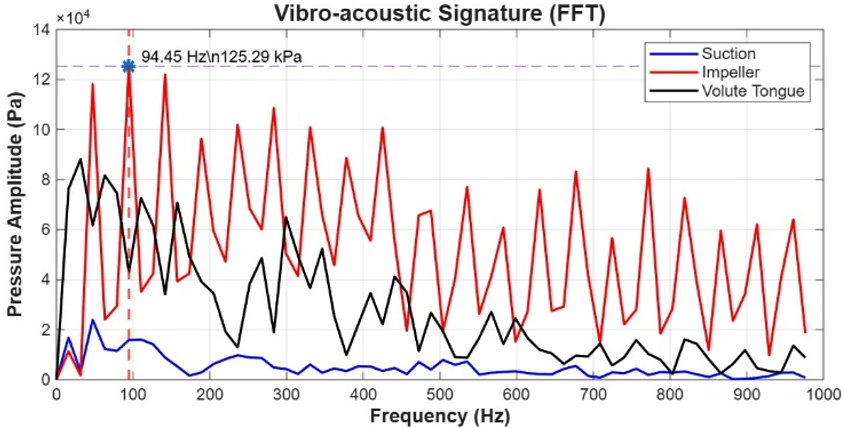
The dynamic response of the PAT was investigated through spectral analysis of the pressure fluctuations recorded in the suction region, the impeller zone, and the volute tongue. By applying the FFT and calculating the PSD according to Eq. (11), the comparative amplitude spectra shown in Figure 6 were obtained.
Figure 6. Fast Fourier Transform (FFT) spectra of pressure fluctuations measured at the suction region, impeller region, and volute tongue for the 5 kg/s operating condition
The suction region exhibited the lowest spectral amplitudes in the analyzed frequency range, indicating a relatively stable flow behavior with limited dynamic excitation. In contrast, the tongue of the volute exhibited moderate amplitudes, primarily associated with rotor-stator interaction, as the wakes of the blades periodically pass near the stationary tongue.
The highest amplitudes were detected in the impeller region, where a dominant peak at 94.45 Hz was observed with a maximum pressure amplitude of approximately 125.29 kPa. Considering a rotation speed of 2,900 rpm, the shaft rotation frequency is fn = 48.33 Hz. Therefore, the main peak is located near the second rotational harmonic (2fn ≈ 96.67 Hz).
It is important to distinguish this value from the BPF, calculated according to Eq. (13) as BPF = (9 × 2,900)/60 = 435 Hz. The absence of a dominant peak in the BPF and the concentration of energy in the second rotational harmonic (2fn) indicate that the results suggest that direct rotor-volute interaction is not the dominant excitation mechanism under the analyzed operating condition, a typical mechanism in centrifugal pumps operating in pumping mode [7, 11], but rather from larger-scale hydrodynamic instabilities associated with vortex shedding and the growth of vapor cavities in the impeller. This behavior is characteristic of PAT systems operating off-design, where the rotor-stator interaction and cavitation phenomena modulate the lower harmonics of the rotational frequency instead of amplifying the BPF, as documented in studies of pressure pulsations in hydraulic turbomachines under transient conditions [11, 12]. Thus, the peak at 94.45 Hz is consistent with a low-order rotational harmonic and may be associated with rotor-related hydrodynamic instabilities.
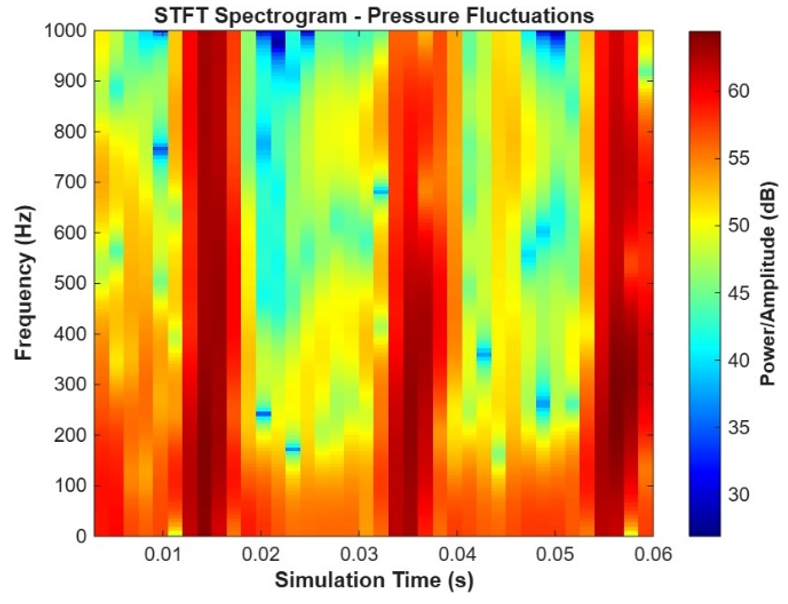
To complement the stationary frequency analysis, the STFT according to Eq. (12), with a Hamming window and 80% overlap, was applied to the impeller pressure signal. The resulting spectrogram, shown in Figure 7, reveals intermittent energy concentrations distributed over time, mainly between 200 and 400 Hz, with additional activity at higher frequencies.
These transient bands indicate that the pressure pulsations are not purely periodic, but rather evolve over time due to the interaction of multiple unstable mechanisms within the machine. It is worth noting that the high spectral amplitude concentrations observed in the spectrogram around t ≈ 0.015 s, t ≈ 0.035 s, and t ≈ 0.055 s exhibit an approximate temporal separation of 0.02 s, a value that corresponds to the rotational period of the impeller (1/fn = 1/48.33 Hz ≈ 0.0207 s). This periodicity indicates that these energetic events are synchronized with each complete revolution of the impeller: the successive passage of the nine blades in front of the tongue of the volute generates, in each turn, an excitation pulse that manifests as a broad-band energy concentration in the spectrogram. The intermittent nature of these events, instead of a continuous horizontal band suggests a transient and non-stationary behavior of the cavitating and vortical phenomena present in the machine, whose intensity varies from revolution to revolution depending on the local pressure conditions in the impeller. This non-stationary behavior justifies the use of time-frequency tools such as the STFT, as the conventional FFT alone averages these temporal variations and does not allow for the identification of their synchronization with the system's rotational dynamics [11, 12].
In general, the spectral results confirm that the impeller region governs the vibro-acoustic behavior of the PAT and that unstable hydraulic phenomena are directly reflected in the pressure signal.
3.5 Correlation between cavitation, vortex activity and pressure pulsations
Based on the hydraulic results obtained through transient CFD simulation and spectral analysis of the pressure signals, a qualitative relationship was identified between the internal flow behavior and the pressure-based vibro-acoustic indicator of the pump operating as a turbine (PAT).
The results of static pressure, TKE, and the Q-criterion showed that the greatest flow instabilities are concentrated in the impeller region, particularly at the blade exit and in the interaction with the volute tongue. These areas exhibit strong pressure gradients, flow separation, and coherent vortex structures, conditions that increase the likelihood of the appearance of local low-pressure regions, favorable for incipient cavitation.
In line with the above, the FFT analysis showed that the monitoring point located on the impeller recorded the highest spectral amplitude of the system, reaching a dominant peak at 94.45 Hz with an approximate amplitude of 125.29 kPa. This frequency corresponds to approximately 1.95 times the nominal rotation frequency (48.33 Hz), indicating that the main dynamic excitation is associated with the impeller's rotation harmonics and the periodic phenomena resulting from the rotor-stator interaction.
Additionally, the time-frequency analysis using STFT revealed intermittent energy concentrations between 200 and 400 Hz, as well as additional contributions in higher bands. This non-stationary behavior suggests the presence of transient mechanisms associated with vortex shedding, flow fluctuations, and possible local events of growth and collapse of vapor cavities.
To complement the interpretation, Table 5 summarizes the observed relationship between the critical regions of the domain, the level of spectral fluctuation, and the identified hydrodynamic susceptibility.
Table 5. Relationship between hydrodynamic behavior and pressure-based vibro-acoustic indicator
|
Region Evaluated |
Dominant Hydrodynamic Condition |
Observed Spectral Level |
|
Suction |
Relatively uniform flow |
Low amplitude |
|
Impeller |
Vortices, low local pressure and blade interaction |
High amplitude |
|
Volute tongue |
Rotor-stator interaction and local recirculation |
Medium amplitude |
Overall, the results indicate that areas with greater fluid dynamic instabilities coincide with the highest levels of pressure pulsation, demonstrating a direct relationship between vortex dynamics, favorable conditions for cavitation, and the pressure-based vibro-acoustic indicator of the system.
Finally, the operational map shown in Figure 8 allows for the integration of these findings, identifying that conditions close to the hydraulically favorable operating condition present a more stable response, while points further away from this regime show greater susceptibility to dynamic excitations and loss of internal stability. Physically, the unstable zone identified at low flow rates (1–2 kg/s) corresponds to conditions where internal recirculation and anomalous incidence generate high-energy vortex structures that favor incipient cavitation, as evidenced by the TKE and Q-criterion results. The stable zone near 5 kg/s represents the regime where the internal flow develops in a more orderly manner, minimizing separation losses and reducing the amplitude of pressure pulsations. This map constitutes a preliminary practical tool for selecting safe operating conditions in micro-hydropower applications with PAT systems.
Figure 8. Preliminary operational map of the Pump as Turbine (PAT) based on hydraulic-head predictions for flow rates between 1 and 5 kg/s, indicating regions of relatively stable, transitional, and instability-prone operation
A transient CFD methodology was developed to investigate the coupled hydraulic and dynamic behavior of a centrifugal PAT. The combination of the SAS-SST turbulence model with the Schnerr-Sauer cavitation model proved to be suitable for capturing the main unstable flow structures within the machine, including vortex formation, pressure fluctuations, and regions susceptible to the onset of cavitation.
The analysis of the internal flow revealed that the highest turbulent activity was concentrated near the trailing edges of the blades and the tongue of the volute. These regions were characterized by strong velocity gradients, wake interaction, and local recirculation, indicating that they are the main sources of hydraulic losses and dynamic excitation during reverse operation.
The Q-criterion analysis indicated the presence of coherent vortex structures within the impeller passages. Some vortices remained attached to the blade surfaces, while others were convected downstream, generating periodic disturbances in the pressure field. This demonstrates that the dynamics of the vortices play a fundamental role in the transient stability of PAT systems.
According to the hydraulic evaluation, the input mass flow rate of 5 kg/s produced the highest simulated lift height within the evaluated operating range, representing the hydraulically favorable condition within the investigated flow-rate range among the tested cases. This result is relevant for practical applications, as PAT systems often operate under variable flow demand and require stable operating zones.
The vibro-acoustic analysis revealed that the impeller region was the main source of pressure pulsations. An important spectral peak was identified at 94.45 Hz, close to the second harmonic of the shaft rotation frequency, indicating that the rotor movement and the interaction between the blades and the flow significantly influence the dynamic response.
The results of the STFT showed intermittent frequency bands over time, confirming that the pressure signal is non-stationary and influenced by multiple transient mechanisms, such as vortex shedding, rotor-stator interaction, and possible local cavitation-related phenomena. This finding underscores the importance of combining conventional FFT with time-frequency methods for the diagnosis of PAT.
Overall, the results suggest a relationship between internal hydraulic instabilities and the pressure-based vibro-acoustic indicator of the machine. Therefore, monitoring the pressure signal, with the support of CFD analysis, can be considered a useful tool for detecting unfavorable operating conditions and improving the reliability of the PAT.
The present study is limited by the absence of experimental validation and by the use of a rigid wall fluid model that does not consider the effects of fluid-structure interaction. In future work, laboratory measurements, the coupling of structural vibrations, efficiency calculations, and expanded operating maps under more diverse flow conditions should be included.
|
BPF |
Blade passing frequency, Hz |
|
f |
Frequency, Hz |
|
Fs |
Sampling frequency, Hz |
|
fn |
Rotational frequency of the impeller, Hz |
|
g |
Gravitational acceleration, m·s-2 |
|
N |
Number of samples, dimensionless |
|
NPSHd |
Available net positive suction head, m |
|
p |
Local pressure, Pa |
|
p' |
Fluctuating pressure, Pa |
|
P(f) |
Power spectral density (PSD), Pa²·Hz⁻¹ |
|
Q |
Second invariant of the velocity gradient tensor, s-1 |
|
RB |
Bubble radius, m |
|
Ṙc |
Condensation rate, kg·m⁻³·s⁻¹ |
|
Ṙe |
Evaporation rate, kg·m⁻³·s⁻¹ |
|
RPM |
Rotational speed, rev·min⁻¹ |
|
S |
Strain rate tensor, s⁻¹ |
|
t |
Time, s |
|
Utip |
Tip speed of the impeller, m·s⁻¹ |
|
ui |
Velocity component, m·s⁻¹ |
|
w(t) |
Hamming window, dimensionless |
|
xi |
Spatial coordinate, m |
|
Z |
Number of blades, dimensionless |
|
Greek symbols |
|
|
αv |
Vapor volume fraction, dimensionless |
|
µ |
Dynamic viscosity, Pa·s |
|
ρ |
Density, kg·m-3 |
|
σ |
Cavitation number, dimensionless |
|
ω |
Vorticity vector, s-1 |
|
Ω |
Rotation tensor, s-1 |
|
ρl |
Density of the liquid, kg·m⁻³ |
|
ρv |
Density of the vapor, kg·m⁻³ |
|
Subscripts |
|
|
inlet |
Inlet condition |
|
tip |
Impeller tip |
|
v |
Vapor |
|
l |
liquid |
|
xx |
Auto-spectrum |
|
xy |
Cross-spectrum |
[1] Magrini, Novara, D., McNabola, A. (2021). Design and year-long performance evaluation of a pump as turbine (PAT) pico-hydropower energy recovery device in a water network. Water, 13(21): 3014. https://doi.org/10.3390/w13213014
[2] Hamlehdar, M., Yusefi, H., Noorollahi, Y., Mohammadi, M. (2022). Energy recovery from water distribution networks using micro hydropower: A case study in Iran. Energy, 250: 124024. https://doi.org/10.1016/j.energy.2022.124024
[3] Morabito, A., Hendrick, P. (2019). Pump as turbine applied to micro energy storage and smart water grids: A case study. Applied Energy, 241: 567-579. https://doi.org/10.1016/j.apenergy.2019.03.018
[4] Souza, D.E.S., Mesquita, A.L.A., Blanco, C.J.C. (2021). Pump-as-turbine for energy recovery in municipal water supply networks: A review. Journal of the Brazilian Society of Mechanical Sciences and Engineering, 43: 489. https://doi.org/10.1007/s40430-021-03213-z
[5] Jain, S.V., Patel, R.N. (2014). Investigations on pump running in turbine mode: A review of the state-of-the-art. Renewable and Sustainable Energy Reviews, 30: 841-868. https://doi.org/10.1016/j.rser.2013.11.006
[6] Jawahar, C.P., Michael, P.A. (2017). A review on turbines for micro hydro power plant. Renewable and Sustainable Energy Reviews, 72: 882-897. https://doi.org/10.1016/j.rser.2017.01.037
[7] Zhu, Y., Zhou, L., Lv, S., et al. (2024). Research progress on identification and suppression methods for monitoring the cavitation state of centrifugal pumps. Water, 16(1): 52. https://doi.org/10.3390/w16010052
[8] Zhang, B., Niu, B., Zhang, Z., Chen, S., Xue, R., Hou, Y. (2024). Application and challenge of high-speed pumps with low-temperature thermosensitive fluids. Energies, 17(15): 3732. https://doi.org/10.3390/en17153732
[9] Elsinga, G.E., Scarano, F., Wieneke, B., van Oudheusden, B.W. (2011). Generation and visualization of volumetric PIV data fields. Experiments in Fluids, 50: 929-944. https://doi.org/10.1007/s00348-011-1176-1
[10] Tziotziou, K., Scullion, E., Shelyag, S., et al. (2023). Vortex motions in the solar atmosphere: Definitions, theory, observations, and modelling. Space Science Reviews, 219: 1-64. https://doi.org/10.1007/s11214-022-00946-8
[11] Binama, M., Su, W.T., Li, X.B., Li, F.C., Wei, X.Z., An, S. (2017). Investigation on pump as turbine (PAT) technical aspects for micro hydropower schemes: A state-of-the-art review. Renewable and Sustainable Energy Reviews, 79: 148-179. https://doi.org/10.1016/j.rser.2017.04.071
[12] Nagargoje, M.S., Lazpita, E., Garicano-Mena, J., Le Clainche, S. (2025). A review on vortex dynamics in the healthy and dilated left ventricles and its application to heart health. Flow, 5: E10. https://doi.org/10.1017/flo.2025.6
[13] Dong, Z., Li, S., Shu, C., Liu, H. (2018). Experimental and numerical investigation of ventilated cavitating flow structures with special emphasis on vortex shedding dynamics. International Journal of Multiphase Flow, 98: 79-95. https://doi.org/10.1016/j.ijmultiphaseflow.2017.08.014
[14] Rezaeiha, A., Montazeri, H., Blocken, B. (2023). A critical review of CFD modeling approaches for Darrieus turbines: Assessing discrepancies in power coefficient estimation and wake vortex development. Fluids, 8(9): 242. https://doi.org/10.3390/fluids8090242
[15] Liu, C., Wang, Y., Yang, Y., Duan, Z. (2018). A selected review of vortex identification methods with applications. Journal of Hydrodynamics, 30: 767-779. https://doi.org/10.1007/s42241-018-0112-8
[16] Liu, C., Gao, Y., Tian, S., Dong, X. (2017). Review of vortex identification methods. In 55th AIAA Aerospace Sciences Meeting, Grapevine, Texas, USA, p. 0989. https://doi.org/10.2514/6.2017-0989
[17] Dong, Y., Gao, Y., Liu, C. (2019). Third generation of vortex identification methods: Omega and Liutex/Rortex based systems. Journal of Hydrodynamics, 31: 205-223. https://doi.org/10.1007/s42241-019-0022-4
[18] Ni, D., Yang, J., Yu, X., et al. (2025). Research on the influence of gas-ingested flow on internal flow characteristics in reactor coolant pumps. Progress in Nuclear Energy, 193: 106212. https://doi.org/10.1016/j.pnucene.2025.106212
[19] Kumar, D., Sarkar, S. (2019). A review on computational fluid dynamics modeling and simulation of horizontal axis hydrokinetic turbines. Journal of the Brazilian Society of Mechanical Sciences and Engineering, 41: 375. https://doi.org/10.1007/s40430-019-1877-6
[20] Abdul Settar, N., Sarip, S., Kaidi, H.M. (2026). Computational modeling strategies in oscillating-flow turbine systems: A critical review based on Wells turbine simulations. Archives of Computational Methods in Engineering, 33: 5701-5741. https://doi.org/10.1007/s11831-025-10477-4
[21] Yi, H., Kim, M., Lee, D., Park, J. (2022). Applications of computational fluid dynamics for mine ventilation in mineral development. Energies, 15(22): 8405. https://doi.org/10.3390/en15228405
[22] Bhutta, M.M.A., Hayat, N., Bashir, M.H., Khan, A.R., Ahmad, K.N., Khan, S. (2012). CFD applications in various heat exchangers design: A review. Applied Thermal Engineering, 32: 1-12. https://doi.org/10.1016/j.applthermaleng.2011.09.001
[23] Ge, J., Zhang, D., Tian, W., Wang, K., Qiu, S., Su, G.H. (2015). Steady and transient solutions of neutronics problems based on finite volume method (FVM) with a CFD code. Progress in Nuclear Energy, 83: 142-153. https://doi.org/10.1016/j.pnucene.2015.07.012
[24] Kamat, H., Kini, C.R., Shenoy, S.B. (2023). Effect of cavitation and temperature on fluid film bearing using CFD and FSI technique: A review. Archives of Computational Methods in Engineering, 30(3): 1623-1636. https://doi.org/10.1007/s11831-022-09847-z
[25] Rezaeiha, A., Montazeri, H., Blocken, B. (2017). Towards accurate CFD simulations of vertical axis wind turbines at different tip speed ratios and solidities: Guidelines for azimuthal increment, domain size and convergence. Energy Conversion and Management, 156: 301-316. https://doi.org/10.1016/j.enconman.2017.11.052