Zhengjia Xu | Ying Zhang* | Hao Yang | Yuning Deng | Shu Fang
© 2026 The authors. This article is published by IIETA and is licensed under the CC BY 4.0 license (http://creativecommons.org/licenses/by/4.0/).
OPEN ACCESS
Numerical simulations of the thermal environment in regional traditional dwellings are commonly constrained by destructive methods for acquiring thermophysical properties of building envelopes, localized calibration of temperature fields using limited point measurements, and thermal comfort assessments that fail to characterize spatial heterogeneity. Existing image-processing techniques serve primarily as visualization aids, without constituting a closed-loop technical framework that pervades the entire research workflow. Targeting a traditional dwelling in western Anhui Province, an end-to-end image-driven multi-scale simulation and assessment framework for the thermal environment was established. A four-channel improved DeepLab v3+ network integrating visible and infrared imagery was constructed to achieve pixel-level segmentation of building materials, which was combined with a one-dimensional unsteady heat conduction model to perform non-contact inversion of the thermophysical parameters of composite envelopes. A full-field quantitative calibration mechanism for the temperature field was developed by integrating structural similarity, multi-scale structural similarity, and gradient magnitude similarity metrics. Hierarchical fusion of multiple thermal parameters was realized via wavelet transform, generating spatially continuous thermal comfort classification maps. Experimental results demonstrated that the proposed method attained a mean intersection-over-union of 92.73% for material segmentation, with an overall mean relative error of 4.18% for thermal conductivity inversion. Following iterative model calibration, the mean root-mean-square error at measurement points decreased from 1.86 ℃ to 0.72 ℃, while the global composite similarity index improved from 0.806 to 0.936. The fused thermal comfort maps effectively quantified both the areal proportion of comfort zones and spatial heterogeneity under varying operational conditions. This non-invasive research paradigm accommodates the preservation requirements of heritage building fabric, advances the interdisciplinary research pathway between image processing and building physics, and provides a transferable methodological framework for deciphering climate-adaptive mechanisms in regional traditional dwellings.
cross-modal semantic segmentation, image similarity metrics, image fusion, non-contact parameter inversion, multi-scale numerical simulation, traditional dwelling thermal environment
Western Anhui traditional dwellings represent a highly significant vernacular architectural heritage type within the Jianghuai region. Their composite building envelopes are constructed from a combination of rammed earth, green bricks, timber frames, and stone slabs, while a hierarchical spatial system is formed through multi-bay courtyards connected by skywells. These dwellings fully preserve the indigenous climate-responsive wisdom adapted to the hot-summer and cold-winter subtropical climate. With the ongoing advancement of various adaptive reuse and renovation projects, the improvement of indoor thermal comfort has become a central objective for enhancing occupant experience [1-3]. However, conventional thermophysical property testing relies on core sampling from walls, which causes irreversible damage to weathered and fragile historical fabric. This creates a fundamental conflict between heritage preservation requirements and quantitative thermal environment research. In the context of disciplinary development, numerical simulation of building thermal environments is evolving toward non-contact measurement, full-field quantitative calibration, and multi-scale coupled simulation. Traditional approaches based on homogeneous material assumptions and discrete-point calibration [4-6] are no longer adequate for the complex spatial characteristics of traditional dwellings, which feature heterogeneous building envelopes and nested spatial hierarchies of courtyards, rooms, and building clusters. Western Anhui traditional dwellings exhibit the dual characteristics of multi-layered, weathered composite walls and a three-tiered spatial scale, giving rise to three technical challenges that are difficult to resolve through conventional means: (i) the thermophysical properties of weathered materials [7-9] display significant spatial variability, with no non-destructive, high-accuracy acquisition pathway available; (ii) limited point measurements cannot fully calibrate the temperature distribution across the entire envelope surface, rendering the reliability of simulation results difficult to control globally; and (iii) single-point thermal comfort indices fail to capture the temperature gradients around skywells and door/window openings, thus preventing an objective assessment of the spatial heterogeneity of the indoor thermal environment. Against this background, the deep integration of multi-source image processing techniques—encompassing visible and infrared imagery—with building heat transfer simulation, towards the construction of an integrated, end-to-end research framework, enables high-accuracy modeling, full-field calibration, and spatialized evaluation to be achieved without compromising the physical integrity of the building fabric. This approach holds significant theoretical and practical value for elucidating the climate-adaptive mechanisms of traditional dwellings and for the sustainable adaptive reuse of heritage assets.
Current research on the thermal environment of traditional dwellings and image-based inspection techniques remains characterized by multi-level deficiencies, with technical limitations at each stage mutually constraining one another, such that a complete and feasible integrated research pathway has yet to be established. At the level of thermophysical property acquisition for building envelopes [10-12], the destructive nature of laboratory core sampling fails to comply with heritage conservation protocols, while the reliance on fixed parameter values from the literature for simulation purposes neglects the spatial variability in material properties induced by prolonged weathering. Existing non-contact identification methods [13-15] predominantly employ visible or infrared monomodal imagery in isolation, lacking a cross-modal semantic segmentation scheme coupled with heat-transfer inversion for pixel-level extraction, and are therefore unable to simultaneously ensure material classification accuracy and spatial resolution. At the level of numerical simulation calibration, mainstream computational fluid dynamics simulation validation [16-18] relies solely on point-to-point error computation at a limited number of measurement locations, which permits only local assessment of simulation fidelity and fails to identify widespread temperature distribution deviations across wall and roof surfaces. Available infrared thermography comparison efforts have been confined to qualitative visual inspection, without establishing a multi-dimensional quantitative similarity evaluation system that integrates structural, multi-scale, and gradient features; consequently, automatic localization of high-error regions and subsequent inverse adjustment of model boundary parameters cannot be accomplished. At the level of indoor thermal comfort evaluation, conventional predicted mean vote and predicted percentage dissatisfied calculation methods, being based on single-point data acquisition, are incapable of capturing the pronounced cold-hot gradients typical of traditional dwelling interiors, rendering the global representativeness of the evaluation results inadequate. Existing visualization techniques output only single-parameter contour maps for temperature or air velocity in isolation, lacking a comprehensive evaluation mechanism based on hierarchical fusion of multiple thermal parameters, and are thus unable to generate full-field comfort classification maps with spatial guidance value. At the overarching methodological level, image processing techniques have been employed in existing research merely as post-hoc visualization aids, without bridging the complete chain from on-site data acquisition, model parameter assignment, simulation accuracy calibration, to comprehensive result evaluation. The cross-disciplinary integration of computer vision and building physics remains at a superficial application stage [19-21], with a standardized, reusable, closed-loop research paradigm yet to be established.
To address the aforementioned research deficiencies, four corresponding innovative contributions were formulated. A four-channel improved DeepLab v3+ cross-modal semantic segmentation network, integrating visible and infrared imagery, was constructed, and was paired with a combined loss function of weighted cross-entropy and Dice coefficients. By coupling this network with a one-dimensional unsteady heat conduction model, non-destructive pixel-level inversion of thermophysical properties for composite walls was realized. A comprehensive evaluation index was developed by integrating structural similarity, multi-scale structural similarity, and gradient magnitude similarity metrics, enabling full-field quantitative calibration of the computational fluid dynamics temperature field and automatic identification of high-error regions. A hierarchical fusion strategy with differentiated processing for high- and low-frequency components was designed based on wavelet transform, through which multiple thermal parameters were fused to generate spatially continuous thermal comfort classification maps, thereby enabling precise characterization of the spatial heterogeneity of the indoor thermal environment. A fully closed-loop technical framework, spanning from multi-source image acquisition to image-based evaluation, was established, with image processing positioned as the core modeling methodology, thus forming a generalizable cross-disciplinary paradigm suited to thermal environment research on traditional dwellings.
The full text is organized sequentially according to the logic of problem identification, methodology construction, experimental validation, mechanism analysis, limitation discussion, and conclusion synthesis. Chapter 2 provides a comprehensive exposition of the entire technical workflow for image-driven multi-scale thermal environment simulation and evaluation, with detailed descriptions of the algorithmic principles and coupling logic for each module. Chapter 3 presents multiple sets of quantitative comparison experiments and scenario-based simulation studies, conducted using on-site measurement datasets from the Western Anhui traditional dwelling, to validate the proposed methodology and to elucidate the formation mechanisms of the indigenous thermal environment. Chapter 4 analyzes the scope of applicability, existing limitations, and future directions for extension of the proposed framework. Chapter 5 synthesizes the core research conclusions and summarizes the application value of this methodology in digital thermal environment research on traditional architectural heritage.
2.1 Overall technical framework
A fully closed-loop thermal environment research framework is constructed, with two-dimensional images serving as the unified data carrier throughout the entire workflow. The complete chain encompasses five major stages: multi-source image acquisition, pixel-level thermophysical property inversion, multi-scale coupled numerical simulation, full-field simulation calibration, and spatialized thermal comfort evaluation. The entire system adheres to the core design philosophy of image-centrism, wherein the input and output data of all sub-modules are uniformly transformed into two-dimensional raster image formats. By this means, the data heterogeneity barriers among disparate tools—including image recognition, finite-element heat transfer solvers, computational fluid dynamics fluid simulation, and result evaluation—are eliminated, and the information loss and accuracy degradation caused by cross-software format conversion and discrete interpolation processing are avoided. All processes constitute a self-consistent iterative closed loop: the material and thermal parameter images output from the preceding image-processing stages are directly employed as boundary inputs for numerical simulation, while the full-field temperature fields generated by simulation are subsequently transformed back into standardized images and fed into the calibration module for accuracy assessment and model correction.
The proposed framework comprises three-tiered coupled simulation units at the component, room, and building-cluster scales, together with two core image-processing modules—cross-modal semantic segmentation and multi-parameter wavelet-based fusion—with a bidirectional data interaction mechanism established between these two categories of units. Through UV texture mapping, precise registration between two-dimensional parametric images and three-dimensional simulation meshes is accomplished, enabling the complete assignment of pixel-level heterogeneous material thermophysical properties to each region of the building envelope. The full-field thermal parameter fields computed from simulation outputs, after perspective projection rendering, are converted into two-dimensional simulation images that are geometrically aligned with the measured infrared thermographs. Full-field quantitative calibration is then performed through multi-dimensional image similarity metrics, and high-error regions are localized based on the error distribution heatmaps. Through this localization, the thermal boundary parameters at the corresponding positions are inversely adjusted, leading to continuous refinement of the simulation model credibility. Finally, wavelet-based image fusion is employed to generate full-field thermal comfort classification maps, thereby completing the comprehensive spatial evaluation of the heterogeneous thermal environment in traditional dwellings.
Figure 1. Flowchart of cross-modal semantic segmentation and non-contact thermophysical property inversion
2.2 Non-contact extraction of thermophysical properties via cross-modal semantic segmentation
A dual-channel synchronous acquisition scheme, incorporating both visible and infrared imagery, is adopted for capturing surface information from building envelopes. Three-dimensional reconstruction and pixel-level image registration is accomplished through structure-from-motion algorithms, enabling spatiotemporal and spatial alignment of multi-modal data. A dual-camera equipped unmanned aerial vehicle is employed for image capture, with hardware-triggered synchronization ensuring that the timing discrepancy between the two imaging channels is maintained within 0.1 s. The acquisition flight path combined orthographic views with 45° oblique views, guaranteeing that the image overlap for building facades, roof surfaces, and skywell areas is no less than 70%. Based on the reconstructed three-dimensional point clouds and geometric models, the intrinsic and extrinsic parameters of both the visible and infrared cameras are separately computed. Through coordinate projection transformation, the infrared images are resampled to the visible-light resolution, with the registration error maintained within 1 pixel. Concurrently, atmospheric attenuation correction for the infrared images is performed, with surface emissivity values preset in the range of 0.85 to 0.95 according to material types, including green bricks, rammed earth, and timber components. Following registration, the three-dimensional single-channel infrared images, denoted as $I_{I R} \in \mathrm{R}^{H \times W \times 1}$, and the three-channel visible images, denoted as $I_{R G B} \in \mathrm{R}^{H \times W \times 3}$, are concatenated along the channel dimension, yielding a four-channel fused input tensor:
$I_{\text {fusion }}=\left[I_{R G B} ; I_{I R}\right] \in \mathrm{R}^{H \times W \times 4}$ (1)
This fused tensor simultaneously encodes surface textural chromaticity and surface temperature information, thereby providing multi-dimensional feature support for subsequent pixel-level material identification.
The workflow of the cross-modal semantic segmentation and non-contact thermophysical property inversion is illustrated in Figure 1. The DeepLab v3+ architecture is adopted as the baseline network for cross-modal material segmentation, with the backbone network adapted to accommodate the four-channel fused input. Specifically, the number of channels in the first convolutional layer of the Xception backbone is adjusted to 4, and the newly added infrared feature convolution kernels are initialized using a Gaussian random initialization scheme. The remaining layers of the network reuse the pre-trained weights from ImageNet. During the training phase, the parameters of the first three layers are frozen, while only the high-level feature extraction modules are fine-tuned, thereby balancing model generalization capability with cross-modal feature adaptation performance. The atrous spatial pyramid pooling module is retained within the network to capture multi-scale contextual features of building components, while the decoder integrates shallow texture features with high-level semantic features through skip connections. A pixel-level probability map $\widehat{Y} \in \mathrm{R}^{H \times W \times C}$ is output, corresponding to the five envelope material categories: green brick, Chinese fir, rammed earth, slate, and small green tile. During the training phase, a composite objective function combining weighted cross-entropy loss and Dice loss is constructed to mitigate the recognition bias caused by imbalanced sample quantities across different material categories. The loss function is expressed as:
$\begin{aligned} L_{s e g} & =-\sum_{i=1}^{H^{\times W}} \sum_{c=1}^C w_c \cdot y_{i, c} \log \left(\widehat{y}_{i, c}\right) \\ & +\left(1-\frac{2 \sum_i \sum_c y_{i, c} \widehat{y}_{i, c}}{\sum_i \sum_c y_{i, c}+\sum_i \sum_c \widehat{y}_{i, c}}\right)\end{aligned}$ (2)
where, the category weight $w_c$ is computed based on the inverse frequency of samples, with an additional 1.5× weight compensation applied to minority material categories whose image area occupancy is below 5%. Following the network output, a dense conditional random field is introduced to refine segmentation boundaries, and geometric continuity constraints of building components are further incorporated to eliminate discrete noise artifacts, yielding a pixel-level material category label map as the final output.
Based on the full-field material distribution results obtained from segmentation, thermophysical property inversion for the multi-layer composite walls is performed in conjunction with the time-sequential infrared temperature series. The layered building envelope is simplified as a one-dimensional multi-layer unsteady heat transfer medium, with the heat conduction governing equation expressed as:
$\rho c_p \frac{\partial T}{\partial t}=\frac{\partial}{\partial x}\left(k \frac{\partial T}{\partial x}\right)$ (3)
Convective heat transfer boundary conditions are imposed on both the exterior and interior surfaces. On the exterior side, the boundary condition is specified as $-k \partial T /\left.\partial x\right|_{x=0}=h_{\text {out }}\left(T_{\infty}-T\right)$, while on the interior side, it is specified as $-k \partial T /\left.\partial x\right|_{x=L}=h_{i n}(T-\left.T_{\text {in }}\right)$. An inversion solution model is formulated by minimizing the residual between the measured infrared surface temperatures and the model-computed surface temperatures, expressed as the optimization objective:
$\hat{\boldsymbol{\theta}}=\arg \min _{\boldsymbol{\theta}} \sum_{p=1}^P\left[T_{\text {surf }}^{I R}\left(x_p, y_p\right)-T_{\text {surf }}^{\text {model }}\left(x_p, y_p ; \boldsymbol{\theta}\right)\right]^2$ (4)
where, the parameter vector $\theta$ encompasses the thermal conductivity, specific heat capacity, and density of each material layer. To ameliorate the ill-posedness of the inversion problem, the density and specific heat capacity are constrained within a ±10% interval of literature reference values as prior conditions, with only thermal conductivity retained as the primary solved variable. Numerical solution is accomplished using an adaptive-weight particle swarm optimization algorithm, with a population size of 30 and a maximum iteration count of 100. Time-sequential infrared temperature data spanning 6 consecutive hours are input for block-wise computation, wherein the images are partitioned into 50×50 pixel grids for parallelized inversion processing. Ultimately, spatially continuous thermophysical property distribution maps, maintaining resolution identical to that of the original images, are generated, thereby enabling non-destructive acquisition of full-field heterogeneous thermal parameters for the building envelope.
2.3 Image-driven multi-scale coupled numerical simulation of thermal environment
A three-tiered nested thermal environment coupled simulation system, encompassing the component, room, and building-cluster scales, is constructed to precisely match the multi-scale heat transfer characteristics of the composite building envelopes and clustered courtyard layout characteristic of Western Anhui traditional dwellings. Efficient data linkage and accurate transfer across scales are realized through the use of standardized two-dimensional images. The architecture of the image-driven multi-scale thermal environment coupled simulation is illustrated in Figure 2. With UV texture mapping serving as the core data interchange mechanism, a bidirectional mapping relationship between two-dimensional images and three-dimensional simulation meshes is established throughout the simulation system. The temperature parameter images of the building envelope, obtained from component-scale solutions, are directly mappable to the wall boundary conditions for room-scale simulations, while the full-field heat flux characteristics output from room-scale simulations are aggregatable into heat source input terms for building-cluster-scale simulations. By this means, the problems of data fragmentation, interpolation distortion, and poor scale compatibility inherent in conventional multi-scale simulations are completely resolved. To balance dynamic simulation accuracy with computational efficiency, a differentiated temporal iteration scheme is implemented. A time step of 1 min is adopted for the unsteady heat transfer calculations at the component scale, enabling fine-resolution capture of the temporal thermal storage and release patterns of the building envelope. A finer time step of 10 s is employed for the fluid dynamics simulations at the room scale, with the wall temperature boundary images updated once every six fluid iterations, thereby achieving high-level temporal synchronization across the multi-scale physical field evolutions.
Figure 2. Image-driven multi-scale coupled simulation architecture for thermal environment
Figure 3. Closed-loop diagram of full-field similarity calibration and multi-parameter wavelet-based fusion evaluation
Component-scale simulation is performed through an image-driven mesh assignment mechanism, enabling the heterogeneous heat transfer characteristics of traditional dwelling building envelopes to be faithfully represented, thereby overcoming the simplifying assumption of homogeneous material property assignment employed in conventional numerical simulations. The thermophysical property parameter images obtained from the pixel-level inversion described in the preceding section are matched on a pixel-by-pixel basis with the two-dimensional finite-element heat transfer mesh, such that each mesh element inherited the thermal conductivity, density, and specific heat capacity parameters corresponding to its spatial location. By this means, the local heat transfer performance variations induced by differential wall weathering are precisely characterized. For the typical multi-layer composite constructions of Western Anhui traditional dwellings, comprising hollow brick walls with rammed earth cores, unstructured heat transfer meshes are adaptively generated based on the cross-sectional material distribution features derived from semantic segmentation, thereby fully reproducing the layered heat transfer pathways and thermal resistance distribution patterns of the composite construction. Through this modeling approach, the differentiated thermal storage, conduction, and dissipation characteristics of localized regions within the building envelope are realistically reconstructed, providing a high-accuracy component-level physical foundation for the multi-scale coupled simulation.
Room-scale indoor thermal environment evolution is simulated through solution of the Reynolds-averaged Navier-Stokes equations, with the renormalization group k-ε turbulence model adopted to accommodate the low-Reynolds-number natural ventilation characteristics driven by buoyancy forces within the skywell. The general governing equation for the model can be uniformly expressed as:
$\frac{\partial}{\partial x_j}\left(\rho u_j \phi\right)=\frac{\partial}{\partial x_j}\left(\Gamma_\phi \frac{\partial \phi}{\partial x_j}\right)+S_\phi$ (5)
where, $\rho$ denotes air density, $u_j$ represents the spatial velocity components, $\phi$ denotes the general solved variable corresponding to physical fields including velocity, temperature, turbulent kinetic energy, and turbulent dissipation rate, $\Gamma_\phi$ denotes the diffusion coefficient for the variable, and $S_\phi$ denotes the source term in the equation. Radiative heat transfer within the indoor building envelope is solved using the discrete ordinates method, with comprehensive coverage of long-wave radiative exchange processes between wall surfaces. To overcome the limitation of conventional simulations employing uniform wall temperature boundaries, thin-plate spline transformation is employed to accomplish precise registration between the two-dimensional wall temperature images and the three-dimensional building mesh, while bilinear interpolation is implemented for adaptive resolution matching. By this means, the pixel-level temperature gradients induced by differential material properties and non-uniform solar radiation across the building envelope are fully preserved, and the spatially non-uniform distribution characteristics of the indoor thermal environment in traditional dwellings are accurately reconstructed.
Building-cluster-scale microclimate simulation is performed through automated modeling and refined parameter assignment based on unmanned aerial vehicle orthophotos, adapted to the regional characteristics of the clustered courtyard layout typical of Western Anhui traditional dwellings. Building cluster contours, building heights, and roof spatial distribution features are automatically extracted from the image data, enabling rapid construction of a village-scale geometric simulation model. The thermophysical properties of the underlying surface in the model are fully assigned based on the cross-modal semantic segmentation results, with dedicated thermophysical parameters matched to different surface types, including small green tile roofing, slate-paved ground, and rammed earth surfaces. This approach supersedes the conventional practice of employing uniform empirical parameter settings across the entire domain, thereby effectively enhancing the accuracy of thermal exchange computation at the village underlying surface. Through aggregation of the real-time heat flux outputs from the exterior surfaces of individual buildings, a dynamic heat source boundary at the building-cluster scale is constructed, enabling bidirectional coupled computation between the indoor thermal environment of individual buildings and the village microclimate. By this means, the passive regulation mechanisms through which the spatial layout and construction forms of Western Anhui traditional dwellings adapt to the local climate are fully elucidated.
2.4 Model validation via image similarity and thermal comfort image fusion evaluation
To address the problems of insufficient spatial coverage and one-sided accuracy assessment inherent in conventional single-point validation approaches for numerical simulation, a full-field image-level temperature field validation system is established, enabling quantitative face-to-face comparison between simulation results and measured infrared thermal fields. The closed-loop diagram of full-field similarity calibration and multi-parameter wavelet-based fusion evaluation is illustrated in Figure 3. Perspective reconstruction of the three-dimensional temperature field output from the computational fluid dynamics simulation is first performed, with projection rendering conducted according to the spatial pose parameters of the on-site infrared camera, thereby generating a simulated temperature false-color map with viewing angle consistency and resolution matching relative to the measured image. Pixel-level precise registration between the two images is accomplished through three-dimensional feature point matching, effectively eliminating comparison errors induced by perspective distortion and spatial misalignment. Three complementary image similarity metrics are integrated to comprehensively quantify the temperature field fitting accuracy from the perspectives of global structure, multi-scale features, and local gradients. Among these, the structural similarity index is employed to evaluate the consistency of overall temperature distribution, luminance, and contrast, with its calculation formula expressed as:
$\operatorname{SSIM}\left(I_{\text {sim }}, I_{I R}\right)=\frac{\left(2 \mu_{\text {sim }} \mu_{I R}+C_1\right)\left(2 \sigma_{\text {sim }, I R}+C_2\right)}{\left(\mu_{\text {sim }}^2+\mu_{I R}^2+C_1\right)\left(\sigma_{\text {sim }}^2+\sigma_{I R}^2+C_2\right)}$ (6)
where, $\mu_{\text {sim }}$ and $\mu_{I R}$ denote the pixel means of the simulated and measured images, respectively; $\sigma_{\text {sim }}$ and $\sigma_{I R}$ denote the corresponding pixel variances; $\sigma_{\text {sim }, I R}$ denotes the image covariance; and $C_1$ and $C_2$ are stability constants introduced to avoid computational anomalies when the denominators approach zero.
To simultaneously capture overall temperature distribution patterns and local detailed error identification, the multi-scale structural similarity index is introduced for hierarchical feature comparison. A multi-scale feature space is constructed through multi-level downsampling, and the luminance, contrast, and structural similarity weights at different scales are fused. The specific expression is given as:
$\begin{aligned} & \operatorname{MS}-\operatorname{SSIM}\left(I_{\text {sim }}, I_{I R}\right)=\left[l_M\left(I_{\text {sim }}, I_{I R}\right)\right]^{\alpha_M} \\ & \cdot \prod_{j=1}^M\left[c_j\left(I_{\text {sim }}, I_{I R}\right)\right]^{\beta_j}\left[s_j\left(I_{\text {sim }}, I_{I R}\right)\right]^{\gamma_j}\end{aligned}$ (7)
where, $l_M$ denotes the luminance similarity at the coarsest scale, $c_j$ and $s_j$ denote the contrast and structural similarities at each scale, respectively, and $\alpha_M, \beta_j$, and $\gamma_j$ denote the weighting coefficients at each scale. For temperature transition regions, such as skywell boundaries and door/window openings, the gradient magnitude similarity metric is adopted to capture the fitting accuracy of temperature gradients, enabling precise identification of local simulation deviations:
$G M S\left(I_{\text {sim }}, I_{I R}\right)=\frac{2\left|\nabla I_{\text {sim }}\right| \cdot\left|\nabla I_{I R}\right|+C}{\left|\nabla I_{\text {sim }}\right|^2+\left|\nabla I_{I R}\right|^2+C}$ (8)
where, ∇ denotes the image gradient operator and C denotes a numerical stability constant. Based on the three fundamental metrics, objective weighting is assigned through the entropy weight method, and a comprehensive full-field similarity evaluation index is constructed:
$S_{\text {total }}=S S I M^\alpha \cdot M S-S S I M^\beta \cdot G M S^\gamma$ (9)
When the comprehensive index falls below a preset threshold, a sliding window mechanism is employed to generate a local error heatmap, enabling precise localization of deviation regions. Boundary parameters at the corresponding locations, including the convective heat transfer coefficient and solar radiation absorptivity, are then inversely adjusted, thereby achieving closed-loop calibration optimization of the numerical model.
Based on the high-accuracy simulation results obtained from calibration, a multi-parameter fusion thermal comfort evaluation method is constructed through wavelet transform, overcoming the limitation of conventional single-point evaluation methods that fail to characterize spatial heterogeneity. The spatial distribution fields of four core thermal environmental parameters—indoor air temperature, relative humidity, air velocity, and mean radiant temperature—are extracted and converted into standardized grayscale images. The predicted mean vote and predicted percentage dissatisfied indices are calculated according to the American Society of Heating, Refrigerating and Air-Conditioning Engineers (ASHRAE) Standard 55 and the International Organization for Standardization (ISO) 7730 standard, enabling quantitative characterization of thermal comfort:
$\begin{aligned} P M V= & {[0.303 \exp (-0.036 M)+0.028] \cdot\left\{(M-W)-3.05 \times 10^{-3}\left[5733-6.99(M-W)-p_a\right]\right.} \\ & -0.42[(M-W)-58.15]-1.7 \times 10^{-5} M\left(5867-p_a\right) \\ & -0.0014 M\left(34-T_a\right)-3.96 \times 10^{-8} f_{c l}\left[\left(T_{c l}+273\right)^4-\left(\bar{T}_r+273\right)^4\right] \\ & \left.-f_{c l} h_c\left(T_{c l}-T_a\right)\right\}\end{aligned}$ (10)
$P P D=100-95 \cdot \exp \left[-0.03353 \cdot P M V^4-0.2179 \cdot P M V^2\right]$ (11)
where, $M$ denotes the human metabolic rate, $W$ denotes external work, $p_a$ denotes the partial water vapor pressure of air, $T_a$ denotes air temperature, $f_{c l}$ denotes the clothing area factor, $T_{c l}$ denotes clothing surface temperature, $\bar{T}_r$ denotes mean radiant temperature, and $h_c$ denotes the convective heat transfer coefficient. In conjunction with the usage characteristics of different functional spaces in Western Anhui traditional dwellings, such as the central bay and the side bay, occupant-related parameters are differentially configured to ensure that the evaluation results are aligned with actual usage scenarios.
To achieve organic integration of multi-dimensional thermal parameters while preserving spatial features, the db4 wavelet basis is adopted for three-level two-dimensional wavelet decomposition of the four parameter images, with differentiated fusion strategies implemented for high- and low-frequency components. The low-frequency sub-bands, which carry the overall variation trends of the thermal environment, are fused using a weighted averaging algorithm to ensure continuity and stability of the overall thermal comfort distribution. The high-frequency sub-bands, which correspond to local thermal transition features around doors, windows, skywells, and wall surfaces, are fused using a regional energy maximization rule to preserve spatial details and boundary gradient features. In the preprocessing stage, all parameter images are uniformly normalized to the same grayscale interval through min-max normalization, and the fusion logic is constrained by physical contribution weights derived from the predicted mean vote model, thereby avoiding physical distortion caused by purely image-based computation. Following inverse wavelet transform reconstruction, a full-field comprehensive thermal comfort image is generated. Based on standard threshold intervals, three evaluation levels—comfortable, acceptable, and uncomfortable—are delineated, and a visual evaluation map is produced by overlaying the building plan contours. A pointwise predicted mean vote verification mechanism is additionally incorporated to ensure that the image fusion results consistently satisfy building thermal physics constraints, thereby achieving refined, visualized, and full-field evaluation of the heterogeneous indoor thermal environment in traditional dwellings.
3.1 Experimental platform and dataset
A well-preserved multi-bay traditional dwelling from the Qing Dynasty, located in the Lu'an area of western Anhui Province, was selected as the research subject. The building features a composite envelope construction combining rammed earth, green brick, Chinese fir, slate, and small green tile, with a narrow skywell connecting the front and rear multiple courtyards in series, forming a multi-level nested spatial configuration. This dwelling represents a typical example of traditional vernacular architecture in the hot-summer and cold-winter region of the Jianghuai area. Field data acquisition was conducted in two temporal campaigns—a typical summer high-temperature day and a typical winter low-temperature day—with continuous monitoring over a 24-hour period for each campaign. Image acquisition was performed using an integrated dual-channel (visible and infrared) unmanned aerial vehicle, with a visible-light camera resolution of 6000 × 4000 pixels and an infrared thermograph temperature measurement accuracy of ±0.3 ℃ over a measurement range of −20 ℃ to 150 ℃. Indoor temperature and humidity were recorded using data loggers deployed at 15 representative measurement points, with a sampling interval of 10 minutes. Concurrently, a regional meteorological station was employed to acquire hourly data on air temperature, relative humidity, solar radiation, and wind speed.
Based on the images acquired from the field survey, a multi-modal annotated dataset for the building envelopes of Western Anhui traditional dwellings was constructed, comprising 5,624 pairs of visible-infrared co-registered images. Pixel-level labels were uniformly annotated for the five envelope material categories: rammed earth, green brick, Chinese fir, slate, and small green tile. The dataset was randomly partitioned into training, validation, and test sets at a ratio of 7:1:2. During the partitioning process, the sample distribution of each material category was strictly controlled to ensure balance, thereby mitigating the interference of sample quantity bias on model training.
The planar spatial layout of the Western Anhui traditional dwelling and the experimental arrangement for thermal environment monitoring are illustrated in Figure 4. The building as a whole adopts a multi-courtyard layout, with the upper hall, central hall, and lower hall arranged along the longitudinal axis, and two skywells embedded between the main halls and the passage hall, constituting the core spatial nodes for indoor daylighting, natural ventilation, buoyancy-driven exhaust, and thermal buffering. In the figure, different color shadings are used to distinguish main activity spaces, skywell areas, transitional corridors, and peripheral side chambers, thereby visually presenting the hierarchical relationships among internal spaces and the functional zoning of the thermal environment within the traditional dwelling. Concurrently, the figure indicates the T1–T15 temperature and humidity monitoring points, the infrared image acquisition directions, the key zones for indoor computational fluid dynamics simulation, the typical zones for heat transfer simulation of building envelopes, as well as the prevailing summer natural ventilation pathways and solar radiation influence directions. This figure provides a unified spatial reference framework for the subsequent cross-modal image acquisition, thermophysical property inversion of building envelopes, multi-scale numerical simulation, full-field temperature field calibration, and thermal comfort classification evaluation. As can be observed from the figure, the indoor thermal environment of the Western Anhui traditional dwelling is not determined by the boundaries of a single room, but is instead jointly influenced by skywell openings, the series connection of main halls, the buffering effect of peripheral side chambers, and the thermal storage of building envelopes, indicating that the formation mechanism of the thermal environment exhibits pronounced spatial coupling characteristics. This figure effectively supports the research hypothesis that "the indoor thermal environment is synergistically regulated through the combined action of skywell-driven buoyancy ventilation and composite envelope thermal storage," and establishes the requisite spatial logic for the image-driven parameter extraction and multi-scale simulation evaluation.
Figure 4. Spatial configuration, skywell thermal environment pathways, and simulation zoning of the Western Anhui traditional dwelling
Table 1. Quantitative recognition accuracy of different segmentation models on the test set
|
Model |
Mean Intersection Over Union (%) |
Pixel Accuracy (%) |
Rammed Earth F1 |
Green Brick F1 |
Chinese Fir F1 |
Slate F1 |
Small Green Tile F1 |
|
U-Net |
76.24 |
84.17 |
0.743 |
0.782 |
0.761 |
0.726 |
0.735 |
|
Single-visible DeepLab v3+ |
82.51 |
89.63 |
0.812 |
0.846 |
0.831 |
0.794 |
0.805 |
|
Single-infrared DeepLab v3+ |
80.16 |
87.42 |
0.791 |
0.823 |
0.807 |
0.772 |
0.784 |
|
Original three-channel DeepLab v3+ |
84.37 |
91.25 |
0.834 |
0.867 |
0.852 |
0.816 |
0.827 |
3.2 Cross-modal semantic segmentation model performance validation
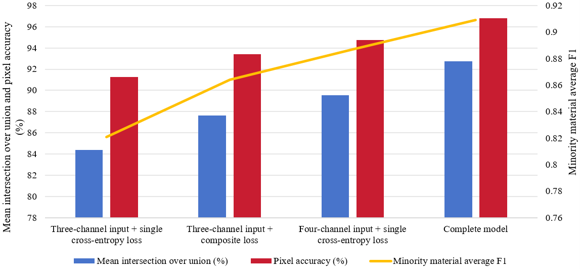
The pixel-wise recognition accuracy of the four-channel cross-modal fusion network for composite building materials was quantitatively evaluated, the independent contributions of the two enhancement modules—the four-channel input and the composite loss function—were quantified, and the improvement effect of multi-modal information fusion on the recognition of minority building materials was verified. The baseline comparisons included single-visible-light DeepLab v3+, single-infrared DeepLab v3+, U-Net, and the original three-channel DeepLab v3+. Four sets of ablation experiments were designed: (i) the baseline three-channel model with single loss, (ii) the model with the composite loss added, (iii) the model with the four-channel input, and (iv) the complete improved model. The evaluation metrics employed were mean intersection over union, overall pixel accuracy, and the per-category F1-score for the five material classes.
As can be observed from Table 1, the recognition accuracy of networks relying solely on single-modality images exhibited notable limitations. Visible-light images could only distinguish components based on surface texture, while infrared images could only capture temperature differences. Neither modality, when used independently, could fully identify the materials of weathered composite walls. The original three-channel DeepLab v3+, which utilized only visible-light information, achieved a mean intersection over union of only 84.37%. Following the introduction of the infrared channel and the construction of the four-channel fused input, the overall mean intersection over union was improved by 8.36 percentage points, accompanied by concurrent increases in the F1-scores for all five material categories. These results demonstrate that infrared temperature features can supplement the thermophysical property-related correlational features that are absent in visible-light imagery, thereby improving the recognition performance for weathered building components. The two material categories with the lowest sample proportions—slate and small green tile—exhibited the greatest improvements, with F1-score increases exceeding 0.09 in both cases. This confirms that multi-modal fusion can effectively compensate for the feature deficiencies of single-modality approaches.
Figure 5. Quantitative results of model ablation experiments
Table 2. Comparison of thermal conductivity inversion errors for building envelopes under different schemes
|
Material Category |
Metric |
Literature Empirical Value Method |
Single-Infrared Inversion Method |
Proposed Multi-Modal Image Inversion Method |
|
Rammed earth |
Mean absolute error (W·m⁻¹·K⁻¹) |
0.087 |
0.042 |
0.016 |
|
Relative error (%) |
21.64 |
10.35 |
4.12 |
|
|
Green brick |
Mean absolute error (W·m⁻¹·K⁻¹) |
0.093 |
0.047 |
0.018 |
|
Relative error (%) |
19.72 |
9.86 |
3.87 |
|
|
Chinese fir |
Mean absolute error (W·m⁻¹·K⁻¹) |
0.041 |
0.023 |
0.009 |
|
Relative error (%) |
24.38 |
13.67 |
4.86 |
|
|
Slate |
Mean absolute error (W·m⁻¹·K⁻¹) |
0.102 |
0.051 |
0.021 |
|
Relative error (%) |
18.53 |
9.28 |
3.75 |
|
|
Small green tile |
Mean absolute error (W·m⁻¹·K⁻¹) |
0.084 |
0.039 |
0.015 |
|
Relative error (%) |
20.15 |
9.42 |
4.31 |
The ablation experimental results, as illustrated in Figure 5, clearly reflect the independent contributions of the two enhancement modules. When only the composite loss combining weighted cross-entropy and Dice loss was introduced, the mean intersection over union was improved by 3.25 percentage points, and the average F1-score for minority materials was increased by 0.043. This indicates that the composite loss can mitigate the recognition bias caused by imbalanced sample quantities, thereby enhancing the recognition accuracy of low-proportion components. When only the four-channel cross-modal input was adopted, the mean intersection over union was improved by 5.17 percentage points, with the gain from multi-modal feature fusion exceeding that from loss function optimization. When both enhancements were activated simultaneously, the model accuracy achieved a superimposed improvement, demonstrating that the multi-channel input and the composite loss do not conflict with each other, but rather synergistically optimize the segmentation performance from the feature dimension and the loss constraint dimension, respectively. The visualized segmentation results further demonstrate that the proposed model can precisely distinguish subtle composite constructions, such as hollow-brick wall interlayers and weathered rammed-earth surface layers, with significantly fewer edge segmentation artifacts compared to all baseline models.
3.3 Thermophysical property inversion accuracy validation
The non-destructive testing accuracy of the image-driven pixel-level inversion method was validated, the error levels of three schemes—literature-based fixed values, single-infrared inversion, and the proposed multi-modal segmentation-coupled inversion—were compared, and the capability of the block-wise pixel inversion method to characterize material spatial heterogeneity was verified. The laboratory thermophysical property test results from on-site core samples were adopted as the ground-truth benchmark, against which the three parameter acquisition schemes were compared. Thermal conductivity was selected as the core inversion parameter, and the evaluation metrics employed were the mean absolute error and the overall-sample mean relative error.
As can be observed from the quantitative errors presented in Table 2, the scheme directly employing fixed empirical values from the literature yielded the highest errors, with the mean relative errors for all material categories exceeding 18%. This approach clearly failed to capture the material property degradation and spatial distribution variations induced by long-term weathering. The inversion relying solely on time-sequential infrared temperature data, without the constraint of precise material boundaries, suffered from substantial bias amplification caused by material recognition confusion, with the mean relative errors maintained within the range of 9% to 14%. Through the provision of pixel-level material boundaries by the cross-modal semantic segmentation and the subsequent implementation of block-wise inversion, the mean relative errors for thermal conductivity across all material categories were controlled within 5%, with an overall mean relative error of only 4.18%. This demonstrates that the non-destructive testing accuracy of the proposed approach approaches the level of laboratory core-sample destructive testing.
From the spatial distribution maps, it can be observed that conventional uniform parameter assignment can only output a single constant value, whereas the proposed block-wise pixel inversion can capture the elevated thermal conductivity features in locally severely weathered wall regions, thereby fully reconstructing the spatial heterogeneity of building envelope thermophysical properties. This provides high-accuracy full-field parameter inputs for multi-scale numerical simulation and effectively avoids the heat transfer calculation deviations caused by the homogeneous material assumption.
3.4 Full-field model validation experiments via image similarity
The evaluation capabilities of the conventional point-based validation method and the proposed image-based full-field validation method were compared, the improvement in simulation temperature field accuracy achieved through the iterative calibration process was quantified, and the effectiveness of multi-dimensional image similarity metrics in identifying spatial distribution errors was verified. The synchronously acquired infrared thermographs of walls and roof surfaces were adopted as the measured benchmark. Two control groups were established: (i) the conventional 10-point root mean square error validation and (ii) the proposed image similarity-based full-field validation. The full set of similarity metrics and point-wise errors were compared between the pre-calibration and post-calibration model states. The evaluation metrics employed included structural similarity, multi-scale structural similarity, gradient magnitude similarity, the comprehensive similarity index S_{\text {total}}, and the point-wise root mean square error.
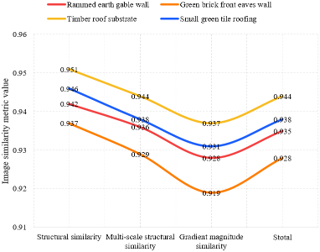
Figure 6. Image similarity metrics for simulated temperature fields of different building envelope components
The results presented in Figure 6 demonstrate that the simulated temperature fields, following the completion of iterative calibration, exhibited highly consistent spatial distribution characteristics with the measured infrared thermographs, with the comprehensive similarity indices for all four envelope component types exceeding 0.92. The structural similarity metric ensured matching of the global temperature mean and distribution contours, while the multi-scale structural similarity metric concurrently accounted for temperature differences at both far-field large-scale regions and near-field local component features. The gradient magnitude similarity metric precisely captured temperature transition boundaries at doors, windows, and wall bases. The three complementary metrics collectively enabled comprehensive coverage of the fitting accuracy assessment for the full-field temperature distribution. The conventional point-based validation method, relying solely on 10 discrete measurement points, could only evaluate local errors at the measurement locations, and was incapable of identifying systematic simulation deviations across large wall surfaces or the entire roof area.
The comparison of metrics before and after the iterative calibration, as shown in Table 3, reveals that following the localization of high-error regions via error heatmaps and the subsequent inverse adjustment of boundary parameters, the mean point-wise root mean square error was reduced from 1.86 ℃ to 0.72 ℃, while the comprehensive full-field similarity index was improved by 0.13. Prior to calibration, the simulation model suffered from global errors, including underestimation of roof solar radiation absorptivity and deviations in wall convective heat transfer coefficients, which could not be localized through discrete measurement points alone. The image similarity-based error heatmaps were capable of intuitively annotating high-error banded regions, enabling targeted correction of the corresponding thermal boundary parameters and achieving closed-loop calibration of the simulation model, thereby substantially enhancing the full-field fitting accuracy of the temperature field.
Table 3. Comparison of accuracy metrics before and after model iterative calibration
|
Model State |
Mean Point-Wise Root Mean Square Error (℃) |
Mean Structural Similarity |
Mean Multi-Scale Structural Similarity |
Mean Gradient Magnitude Similarity |
Mean Stotal |
|
Pre-calibration |
1.86 |
0.814 |
0.807 |
0.796 |
0.806 |
|
Post-calibration |
0.72 |
0.944 |
0.937 |
0.929 |
0.936 |

(a) Raw field image acquisition

(b) Cross-modal material semantic segmentation

(c) Building envelope thermophysical property inversion
Figure 7. Multi-source image acquisition, cross-modal material segmentation, and thermophysical property inversion results for the Western Anhui traditional dwelling

(a) Multi-scale numerical simulation implementation
(b) Full-field temperature field calibration
(c) Thermal comfort classification map
Figure 8. Multi-scale thermal environment simulation, full-field temperature field calibration, and thermal comfort classification evaluation results for the Western Anhui traditional dwelling
To validate whether the image processing techniques can support non-destructive parameter acquisition in thermal environment simulation of traditional dwellings, a series of experiments was conducted. Figure 7 illustrates the sequential processing pipeline from on-site image acquisition, material semantic recognition, to thermophysical property inversion. As shown in Figure 7, the visible-light images comprehensively present the spatial components of the indoor main hall and skywell courtyard of the Western Anhui traditional dwelling, including timber posts, wall surfaces, roof structures, doors, windows, and ground surfaces. The infrared thermographs further reveal the surface temperature differences among different envelope interfaces, indicating that relying solely on visible-light textures is insufficient for fully characterizing the thermophysical attributes of building materials. The cross-modal material semantic segmentation results demonstrate the capability to achieve pixel-level differentiation among regions of green brick, rammed earth, timber components, slate, small green tile, and door/window openings. These results correspond to the mean intersection-over-union of 92.73% reported in this study, indicating that the four-channel fused visible and infrared input can effectively enhance the recognition stability of complex material boundaries in traditional dwellings. The resulting thermal conductivity distribution maps further reveal that the thermophysical properties of building envelopes are not uniformly distributed, with pronounced spatial gradients evident across walls, roof surfaces, timber components, and the perimeters of openings. The locally magnified regions also reflect the parameter discreteness induced by weathered materials and composite constructions. Combined with the inversion results, in which the overall mean relative error for thermal conductivity was controlled within 4.18%, Figure 7 supports the conclusion that the proposed non-contact thermophysical property acquisition method possesses high reliability, and is capable of providing spatially continuous, material-sensitive full-field parameter inputs for subsequent multi-scale numerical simulation without compromising the physical integrity of the historical building fabric.
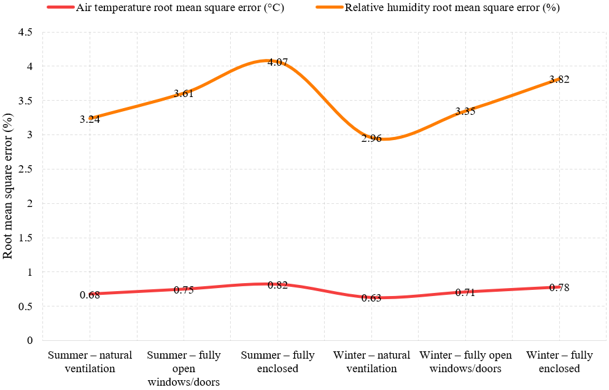
Figure 9. Root mean square error of indoor temperature and humidity simulations under typical summer and winter conditions
Table 4. Quantitative thermal comfort evaluation results under different operational conditions
|
Operational Condition |
Comfort Zone Area Proportion (%) |
Spatial Heterogeneity Coefficient |
Mean Single-Point Predicted Mean Vote |
|
Summer – natural ventilation |
72.64 |
0.137 |
-0.41 |
|
Summer – fully open windows/doors |
61.38 |
0.192 |
-0.26 |
|
Summer – fully enclosed |
38.75 |
0.264 |
0.83 |
|
Winter – natural ventilation |
68.21 |
0.145 |
0.37 |
|
Winter – fully open windows/doors |
45.63 |
0.231 |
0.94 |
|
Winter – fully enclosed |
76.42 |
0.128 |
0.21 |
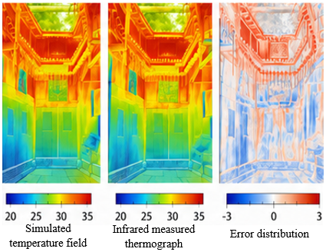
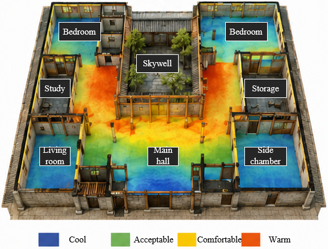
To validate whether the constructed model can simultaneously explain the formation process of the indoor thermal environment and the spatial thermal comfort variations in the Western Anhui traditional dwelling, the implementation effects of the multi-scale numerical simulation, temperature field calibration, and thermal comfort classification evaluation were further demonstrated. Figure 8 sequentially presents the heat transfer boundary transfer process across the component, room, and building-cluster scales. In the component-scale representation, the wall section illustrates the combined effects of solar radiation, surface heat exchange, heat flux conduction, and convective heat transfer. The room-scale computational fluid dynamics results reveal that indoor airflow forms organized circulation patterns along the skywell and across high- and low-temperature interfaces. At the building-cluster scale, external boundary conditions—including wind direction, temperature, wind speed, and humidity—are fed back into the thermal environment simulation of individual buildings. The central panel of temperature field calibration results indicates that the simulated temperature fields and the infrared measured thermographs exhibit high consistency across high-temperature roof surfaces, low-temperature wall surfaces, and local thermal transition zones, with a structural similarity of 0.91 and a multi-scale structural similarity of 0.89. The error distribution maps reveal that the primary deviations are concentrated at skywell edges and component junctions, indicating that the image-based full-field calibration can identify local spatial errors that are difficult to capture through conventional point-based measurement methods. The thermal comfort classification map further demonstrates pronounced thermal comfort variations among the skywell, main hall, bedroom, living room, and side chambers. Areas near the skywell and along ventilation pathways are more likely to form comfortable or acceptable comfort zones, whereas corner rooms and locally enclosed envelope regions tend to exhibit cool or warm conditions. In conjunction with the results reported in this study—including the post-calibration comprehensive similarity index improved to 0.936, the summer natural ventilation comfort zone proportion reaching 72.64%, and the winter closed-condition comfort zone proportion reaching 76.42%—Figure 8 demonstrates that the indoor thermal environment of the Western Anhui traditional dwelling is primarily shaped by the synergistic effects of skywell-driven buoyancy ventilation, thermal storage and release of the multi-layer composite envelope, and courtyard spatial boundary coupling. The proposed image-driven multi-scale simulation and thermal comfort evaluation framework can effectively elucidate the passive climate-adaptive mechanisms, and provide spatially explicit, quantitative optimization references for the adaptive reuse of traditional dwellings.
3.5 Multi-scale simulation results and thermal environment formation mechanism analysis
The temporal and spatial accuracy of the three-tiered coupled numerical simulation was validated, the regulatory mechanisms of skywell ventilation and composite envelope thermal storage on the indoor thermal environment were analyzed, and the passive construction wisdom of Western Anhui traditional dwellings adapted to the hot-summer and cold-winter climate was elucidated. Two major operating conditions—a typical summer day and a typical winter day—were established, with each condition further divided into three sub-conditions: skywell natural ventilation, fully open windows and doors, and fully enclosed spaces. The time-sequential measurement data from the 15 indoor temperature and humidity monitoring points were adopted as the ground truth, with the root mean square error of temperature and humidity employed as the quantitative evaluation metrics.
As can be observed from Figure 9, the root mean square error values for temperature and humidity simulations across all operating conditions remained at relatively low levels, with temperature errors not exceeding 0.82 ℃ and maximum humidity errors reaching 4.07% relative humidity. These results demonstrate that the three-tiered image-driven coupled simulation possesses reliable temporal accuracy. From the analysis of spatial distribution patterns in the contour maps, a pronounced buoyancy-driven ventilation pathway was formed through the skywell during summer conditions, with warm air exhausted upward along the skywell, and a sustained low-temperature buffer zone established in the core area of the central bay. The composite envelope of rammed earth and green brick exhibits strong thermal storage capacity, absorbing solar radiation heat during the daytime and releasing it slowly at night, thereby moderating the diurnal temperature fluctuations within the indoor spaces. Under winter closed-condition operation, the temperature-regulating effect of the envelope thermal storage was most prominent, while rapid heat loss occurred when windows and doors were fully opened, resulting in a mean daily temperature reduction of 2.1 ℃. At the spatial distribution level, the temperature fluctuation amplitude in the side bay areas adjacent to walls was greater than that in the central bay areas surrounding the skywell, indicating that the indoor thermal environment exhibits significant spatial gradients, and that single-point measurements cannot fully characterize the full-field thermal environment variations. Collectively, the simulation results comprehensively reproduce the climate-adaptive mechanisms through which the Western Anhui traditional dwelling achieves summer cooling and winter heating by virtue of skywell ventilation and the multi-layer composite envelope.
3.6 Thermal comfort image fusion evaluation and operational condition optimization
The capability of the wavelet-based multi-parameter image fusion evaluation method to characterize the spatially heterogeneous thermal environment was validated, the discriminative power between conventional single-point predicted mean vote evaluation and the full-field fusion map was compared, the differences in indoor comfort zone proportions across different operational conditions were quantified, and optimization strategies for the thermal environment of traditional dwellings were proposed. The simulation results from the three summer and three winter operational conditions were adopted as inputs, and two evaluation approaches—single-point predicted mean vote evaluation and wavelet-based full-field fusion evaluation—were compared. The quantitative metrics employed included the indoor comfort zone area proportion and the thermal environment spatial heterogeneity coefficient.
As can be observed from the quantitative data presented in Table 4, the conventional single-point predicted mean vote mean can only reflect the average indoor thermal comfort level and fails to capture spatial distribution variations. Under the summer enclosed condition, the single-point predicted mean vote mean was only 0.83, yet the comfort zone proportion was merely 38.75%, indicating that the majority of the indoor space remained in the overheated and uncomfortable range. This demonstrates that the single-point metric suffers from notable evaluation bias. The full-field classification maps generated through wavelet-based image fusion enabled intuitive differentiation of comfort levels among the central bay, side bays, and skywell-peripheral areas. The spatial heterogeneity coefficient was capable of quantifying the strength of indoor thermal gradients, with a significant increase observed under the enclosed condition, confirming that the spatial thermal environment distribution was highly non-uniform.
Cross-comparison across operational conditions reveals that, during summer, the skywell natural ventilation condition yielded the highest comfort zone proportion, with a large area maintained within the neutral comfort range. During winter, the enclosed condition, relying on envelope thermal storage, achieved the optimal thermal comfort level. The visualized fusion maps indicate that door/window openings and wall corners tend to form local overcooled or overheated regions, which constitute the vulnerable zones of indoor thermal comfort. Based on the full-field evaluation results, targeted optimization strategies can be proposed: during summer, the skywell ventilation pathways should be maintained unobstructed, and lightweight shading devices should be installed to reduce radiant heat gain through the roof; during winter, exterior windows should be moderately sealed, while controlled minor ventilation through the skywell should be retained to manage indoor humidity, thereby balancing winter thermal insulation and moisture control requirements. The full-field image fusion evaluation can provide refined and spatially explicit design references for the adaptive reuse of traditional dwellings, thereby compensating for the inherent deficiency of limited spatial representativeness in single-point evaluation methods.
The end-to-end image-driven thermal environment research framework constructed in this study possesses good scene transferability and disciplinary dissemination value. The overall system is not limited to a single dwelling type such as the Western Anhui traditional dwelling, but can be adapted to the thermal environment research of most traditional dwellings and historical buildings with composite brick-wood or earth-wood construction in the Jianghuai region, the Jiangnan region, and other similar climate zones of China. During the method transfer process, only the corresponding regional building material image datasets and local meteorological boundary parameters need to be replaced to complete model adaptation and simulation computations, without requiring reconstruction of the overall technical pipeline. At the methodological level, this study fundamentally transforms the established role of image processing techniques as mere post-hoc visualization aids in building physics research, establishing a complete closed-loop research paradigm driven by multi-source image data that encompasses parameter acquisition, multi-scale simulation, full-field accuracy calibration, and spatialized evaluation. This effectively addresses the technical deficiencies inherent in traditional heritage thermal environment research, including destructive testing, point-based calibration, and homogenized modeling. This interdisciplinary research system can provide standardized and non-destructive technical solutions for the digital preservation of traditional architectural heritage, the analysis of passive energy-saving mechanisms in vernacular dwellings, and the optimization of historical human settlements, thereby advancing the thermal environment research of architectural heritage toward high-accuracy, full-field, and intelligent development.
The technical system constructed in this study still possesses certain scene adaptation limitations and accuracy constraints. In nighttime environments lacking solar radiation excitation, the surface temperature differences across building envelopes are minimal, resulting in significantly reduced feature discriminability in the time-sequential infrared temperature sequences, which leads to a moderate attenuation in the inversion accuracy of thermophysical properties, making it difficult to achieve the same level of refined solution as under daytime conditions. Under extreme weather conditions, strong winds, heavy rainfall, and extreme high or low temperatures substantially increase the ambient disturbance noise, weaken the heat transfer characteristic patterns of building envelopes, and reduce the stability of boundary conditions in numerical simulations. Additionally, complex interior furnishings and occlusions from building components can cause localized image data loss, resulting in local deviations in parameter assignment and simulation calibration for the corresponding regions. Furthermore, the proposed method can only rely on the surface image features of buildings to accomplish material identification and parameter inversion, and is incapable of detecting concealed structural defects such as deep-layer wall weathering voids and delamination aging. The heat transfer discrepancies caused by deep-layer material heterogeneity cannot be fully characterized, exerting a certain influence on the simulation accuracy of local micro-zone thermal environments.
Based on the technical deficiencies and application expansion needs of the existing research, future studies can be further deepened and optimized from three dimensions: intelligence, dynamicization, and scaling. In future work, the feature perception and generalization capabilities of vision foundation models can be integrated to construct an end-to-end intelligent solution network for image-driven thermal environment simulation, eliminating the stepwise image preprocessing, manual parameter configuration, and model iteration processes. This would enable integrated intelligent computation encompassing building material identification, parameter inversion, and thermal environment simulation, thereby further enhancing modeling efficiency and automation levels. Secondly, a dynamic coupling feedback mechanism between the real-time infrared monitoring system and the numerical simulation platform can be established, leveraging continuously acquired time-sequential measured image data to update model boundary parameters in real time, thereby achieving dynamic calibration and accurate prediction of the temporal evolution processes of building thermal environments. Finally, the algorithm architecture and computational resource allocation mechanisms can be optimized for the building-cluster scale, streamlining the image-based modeling and coupled simulation workflows for multiple buildings within a cluster, and establishing a rapid assessment method for thermal environments at the traditional settlement scale. This would further expand the application scenarios of the proposed technical framework to the domains of large-scale architectural heritage cluster preservation and microclimate optimization.
Taking the composite building envelope and multi-bay skywell spatial configuration of the Western Anhui traditional dwelling as the research subject, a complete image-driven multi-scale thermal environment modeling and evaluation system was constructed in this study, encompassing cross-modal material identification for building thermal physics applications, non-contact thermophysical property inversion, image-level temperature field calibration, and thermal comfort map fusion evaluation methods. The proposed visible-infrared four-channel cross-modal semantic segmentation network enabled pixel-level identification of five categories of vernacular building materials, achieving a mean intersection-over-union of 92.73% on the test set. Following block-wise inversion coupled with a one-dimensional unsteady heat conduction model, the mean relative errors for thermal conductivity of all envelope material categories were controlled within 5%, with an overall mean relative error of 4.18%, thereby achieving full-field heterogeneous thermophysical property extraction without compromising the physical integrity of the building fabric. A full-field simulation calibration system was established through multi-dimensional image similarity metrics, which enabled automatic identification of global temperature distribution deviations that are difficult to capture through discrete measurement points. Following iterative calibration, the mean point-wise root mean square error was reduced from 1.86 ℃ to 0.72 ℃, with the mean structural similarity improved from 0.814 to 0.944, the mean multi-scale structural similarity improved from 0.807 to 0.937, the mean gradient magnitude similarity improved from 0.796 to 0.929, and the mean Stotal improved from 0.806 to 0.936, demonstrating that the constructed model possesses high full-field temperature fitting accuracy. The full-field thermal comfort classification maps generated through wavelet-based hierarchical fusion strategies were capable of precisely quantifying the spatial heterogeneity of the indoor thermal environment. Experimental results revealed that, under summer natural ventilation conditions, the comfort zone area proportion reached 72.64%, while under winter closed-condition operation, it reached 76.42%, thereby compensating for the deficiency of limited spatial representativeness inherent in conventional single-point predicted mean vote evaluation. Through three-tiered coupled simulation, multi-condition time-sequential computations were completed, and the passive climate-adaptive mechanisms resulting from the synergistic effects of skywell-driven buoyancy ventilation and thermal storage and temperature regulation of the multi-layer composite envelope were further elucidated, with the indoor thermal comfort distribution patterns under different ventilation conditions quantitatively clarified.
The complete research framework establishes an end-to-end technical pipeline encompassing image acquisition, parameter assignment, multi-scale simulation, full-field calibration, and spatialized evaluation, thereby upgrading computer vision from an auxiliary visualization tool to a core driving force in building thermal environment modeling, and forming a non-destructive, high-accuracy interdisciplinary research paradigm suited to historical architectural heritage. This system eliminates the need for destructive sampling, accommodating both the requirements of heritage conservation and quantitative thermal environment analysis. It not only provides quantitative design references for the adaptive reuse of similar vernacular dwellings in the Jianghuai region, but also possesses the potential for adaptation and generalization to various traditional timber-framed and rammed-earth architectural heritage types and low-energy vernacular green buildings across China, offering a reusable and standardized technical solution for the intersection of digital architectural heritage and human settlement thermal environment research.
This paper was supported by the 2023 Anhui Provincial Housing and Urban-Rural Development Science and Technology Program (Grant No.: 2023-RK014), and the Director Fund of Anhui Provincial Key Laboratory of Huizhou Architecture (Grants No.: HPJZZRJJ202302; 2024HPJZ-ZR03).
[1] Costa-Carrapico, I., González, J.N., Raslan, R., Sánchez-Guevara, C. (2022). Understanding the challenges of determining thermal comfort in vernacular dwellings: A meta-analysis. Journal of Cultural Heritage, 58: 57-73. https://doi.org/10.1016/j.culher.2022.09.019
[2] Trisnoaji, Y., Prasetyo, S.D., Mauludin, M.S., Harsito, C., Anggit, A. (2024). Computational fluid dynamics evaluation of nitrogen and hydrogen for enhanced air conditioning efficiency. Journal of Industrial Intelligence, 2(3): 144-159. https://doi.org/10.56578/jii020302
[3] Zhang, M., Liu, F., Liu, Q., Zhang, F., Li, T. (2024). Climate adaptation analysis and comfort optimization strategies for traditional residential buildings in Hot-Summer, Cold-Winter regions: A case study in Xuzhou, China. Sustainability, 16(8): 3411. https://doi.org/10.3390/su16083411
[4] Costa-Carrapiço, I., Croxford, B., Raslan, R., Gonzalez, J.N. (2022). Hygrothermal calibration and validation of vernacular dwellings: A genetic algorithm-based optimisation methodology. Journal of Building Engineering, 55: 104717. https://doi.org/10.1016/j.jobe.2022.104717
[5] Yu, S., Hao, S., Mu, J., Tian, D., Zhao, M. (2022). Research on optimization of the thermal performance of composite rammed earth construction. Energies, 15(4): 1519. https://doi.org/10.3390/en15041519
[6] Jiang, M., Jiang, B., Lu, R., Chun, L., Xu, H., Yi, G. (2023). Thermal and humidity performance test of rammed-earth dwellings in northwest Sichuan during summer and winter. Materials, 16(18): 6283. https://doi.org/10.3390/ma16186283
[7] Hu, J., Huang, J., Cheng, Y. (2024). Experimental study evaluating the performance of thermal conductivity prediction models for air–water saturated weathered sandstone heritage. Heritage Science, 12: 366. https://doi.org/10.1186/s40494-024-01444-6
[8] Martin, M., Chong, A., Biljecki, F., Miller, C. (2022). Infrared thermography in the built environment: A multi-scale review. Renewable and Sustainable Energy Reviews, 165: 112540. https://doi.org/10.1016/j.rser.2022.112540
[9] Tardy, F. (2023). A review of the use of infrared thermography in building envelope thermal property characterization studies. Journal of Building Engineering, 75: 106918. https://doi.org/10.1016/j.jobe.2023.106918
[10] Mahmoodzadeh, M., Gretka, V., Lee, I., Mukhopadhyaya, P. (2022). Infrared thermography for quantitative thermal performance assessment of wood-framed building envelopes in Canada. Energy and Buildings, 258: 111807. https://doi.org/10.1016/j.enbuild.2021.111807
[11] Zhang, J., Liu, H., Yang, K., Hu, X., Liu, R., Stiefelhagen, R. (2023). CMX: Cross-modal fusion for RGB-X semantic segmentation with transformers. IEEE Transactions on Intelligent Transportation Systems, 24(12): 14679-14694. https://doi.org/10.1109/TITS.2023.3300537
[12] Li, G., Wang, Y., Liu, Z., Zhang, X., Zeng, D. (2022). RGB-T semantic segmentation with location, activation, and sharpening. IEEE Transactions on Circuits and Systems for Video Technology, 33(3): 1223-1235. https://doi.org/10.1109/TCSVT.2022.3208833
[13] Wang, Y., Li, G., Liu, Z. (2023). SGFNet: Semantic-guided fusion network for RGB-thermal semantic segmentation. IEEE Transactions on Circuits and Systems for Video Technology, 33(12): 7737-7748. https://doi.org/10.1109/TCSVT.2023.3281419
[14] Singh, M., Sharston, R. (2022). A literature review of building energy simulation and computational fluid dynamics co-simulation strategies and its implications on the accuracy of energy predictions. Building Services Engineering Research and Technology, 43(1): 113-138. https://doi.org/10.1177/01436244211020465
[15] Chen, C., Gorlé, C. (2022). Full-scale validation of CFD simulations of buoyancy-driven ventilation in a three-story office building. Building and Environment, 221: 109240. https://doi.org/10.1016/j.buildenv.2022.109240
[16] Ganesh, G.A., Sinha, S.L., Verma, T.N., Dewangan, S.K. (2024). Energy consumption and thermal comfort assessment using CFD in a naturally ventilated indoor environment under different ventilations. Thermal Science and Engineering Progress, 50: 102557. https://doi.org/10.1016/j.tsep.2024.102557
[17] Zhai, G., Min, X. (2020). Perceptual image quality assessment: A survey. Science China Information Sciences, 63(11): 211301. https://doi.org/10.1007/s11432-019-2757-1
[18] Zahid, H., Elmansoury, O., Yaagoubi, R. (2021). Dynamic Predicted Mean Vote: An IoT-BIM integrated approach for indoor thermal comfort optimization. Automation in Construction, 129: 103805. https://doi.org/10.1016/j.autcon.2021.103805
[19] Hou, Y., Volk, R., Soibelman, L. (2021). A novel building temperature simulation approach driven by expanding semantic segmentation training datasets with synthetic aerial thermal images. Energies, 14(2): 353. https://doi.org/10.3390/en14020353
[20] Arowoiya, V.A., Moehler, R.C., Fang, Y. (2024). Digital twin technology for thermal comfort and energy efficiency in buildings: A state-of-the-art and future directions. Energy and Built Environment, 5(5): 641-656. https://doi.org/10.1016/j.enbenv.2023.05.004
[21] Ma, N., Aviv, D., Guo, H., Braham, W.W. (2021). Measuring the right factors: A review of variables and models for thermal comfort and indoor air quality. Renewable and Sustainable Energy Reviews, 135: 110436. https://doi.org/10.1016/j.rser.2020.110436