Yasmeen H. Abed* | Jinan Mahdi Hadi | Qahtan A. Al-Nakeeb | Ahmed Hikmet Jassim | Muna S. Kassim | Hasan Shakir Majdi
© 2026 The authors. This article is published by IIETA and is licensed under the CC BY 4.0 license (http://creativecommons.org/licenses/by/4.0/).
OPEN ACCESS
This study employed Computational Fluid Dynamics (CFD) to numerically investigate the influence of porous media properties on smoke transport, heat absorption, and aerodynamic behavior in an automotive catalytic converter. Utilizing the same conservation equations of mass, momentum, energy, and species transport in conjunction with the Darcy-Forchheimer porous media model, a three-dimensional (3-D) model of the catalytic converter was established and solved. The effect of porosity (0.38–0.83), permeability (1 × 10⁻⁸ – 1 × 10⁻⁷ m²), porous thickness (0.03–0.18 m), inlet velocity (0.35–1.45 m/s), and Reynolds number (Re) (2000–12000) were systematically analyzed. The results demonstrate that higher porous resistance substantially enhances smoke attenuation: the normalized inlet smoke concentration of 1.0 decreased to approximately 0.20, 0.07, and 0.03 for porous resistance values of 20,000, 40,000, and 60,000 m⁻², respectively. The optimal joint smoke–thermal performance becomes evident when porosity ≈ 0.65 and achieved with the performance index (PI) being 82, 78, and 76, respectively, for smoke weight factors of 0.3, 0.5, and 0.7. Thermal performance decreased from 6.7% to 3.4% as porosity increased from 0.38 to 0.83, while a maximum heat absorption efficiency of 14.8% was recorded at a permeability of 1 × 10⁻⁷ m² and a porous thickness of 0.15 m. Improved temperature reduction of Re and porosity reduces the efficiency of smoke removal and heat loss as the Re and porosity increase; it is found to decrease from approximately 99% to 78% at Re ≈ 2000 and 89% to almost 40% at Re ≈ 8000. In addition, the outlet smoke temperature decreased from 338 K to approximately 312 K as inlet velocity and porosity increased, owing to enhanced convective heat transfer. Analysis from CFD shows that the temperature within the converter drops from 345–350 K at the inlet to 305–315 K at the outlet, and velocity reduces from 1.35 m/s to about 0.15–0.30 m/s within the porous catalytic region. The results presented here confirm that the optimized porous media properties can substantially enhance the smoke attenuation and thermal management in automotive catalytic converter systems.
catalytic converter, porous media, smoke transport, heat absorption, porosity effects, permeability, exhaust gas flow, automotive emission control
The development of transportation systems and the widespread of internal combustion engines have resulted in much higher amounts of harmful pollutants being introduced into the atmosphere. The main contributors are smoke particles, particulate matter and toxic exhaust gases, and they are known to be major environmental and public health threats. Automotive catalytic converters are widely used to control these emissions by catalyzing chemical reactions that transform harmful gases into less harmful gases before they are released to the atmosphere. However, the behavior of an exhaust gas inside a catalytic converter plays a significant role in the performance of the whole. The overall performance of a catalytic converter is strongly influenced, however, by the internal flow behavior, the heat transfer characteristics and the exhaust gas-catalytic porous structure interaction.
Previous work on porous-media transport can be grouped into four interrelated research themes. The first theme deals with fluid flow, permeability and pressure loss in porous media. Abbas et al. [1] investigated heat and mass transfer in a non-Newtonian fluid with the Darcy-Forchheimer porous-media model and showed that thermal diffusion can affect velocity and heat transfer. Al-Gaheeshi et al. [2] studied Darcian flow through porous materials and showed that grain size significantly affects permeability, pressure loss and flow. Elrahmani et al. [3] and Xiong et al. [4] also showed that permeability decrease, particle accumulation and pore-scale properties are crucial for transport resistance and flow evolution of porous systems. Simonov et al. [5] investigated some basic numerical approaches for predicting porous media flow and highlighted the importance of Computational Fluid Dynamics (CFD) for capturing complex transport phenomena.
The second theme is about heat transfer enhancement and thermal transport in porous structures. Moghadasi et al. [6] investigated forced convection in porous channels and found improved thermal performance with fluid changes. Sivasankaran and Bhuvaneswari [7] found that thermal enhancement of porous media can be accompanied by higher pressure losses and that thermal and hydraulic performance is a trade-off. The research of Yang et al. [8] looked at thermal transport in porous systems, and they concluded that porous systems have superior heat transfer characteristics in porous materials as compared to conventional systems. Likewise, Ranjbarzadeh and Sappa [9] reviewed the recent advancements in heat transfer and flow circulation in porous media and emphasized its engineering applications for enhancement of thermal management.
The third is the transport of particles, smoke and pollutants. Elrahmani et al. [10] demonstrated that porosity and pore structure are important factors that affect particle migration in porous media. Rahif and Attia [11] have investigated the dispersion of smoke during fire conditions and indicated that the flow of air has a great impact on the movement of pollutants. Stan et al. [12] reviewed CFD applications in smoke and hot gas transport and highlighted the necessity of flow management in controlling smoke movement. Shybetsky et al. [13] investigated the particle-removal processes and found that transport and agglomeration processes significantly influenced pollutant attenuation. Although in different application domains, Armand and Tache [14], Benam [15], Du et al. [16], Hamann et al. [17], Lachowicz et al. [18], and Sosnowski [19] provide very important insights into aerosol transport, particle dispersion, filtration and airflow-particle interaction. Such transport mechanisms are fundamental for understanding scalar transport and pollutant attenuation in porous structures, despite their different physical implications.
The fourth theme is advanced CFD-based methods and applications in the engineering of porous media transport. Al-Yaari et al. [20] studied transport enhancement in heterogeneous porous media and showed that thermophysical properties were important for flow distribution. Feng et al. [21] studied spray transport in combustion systems and identified the role of fluid and particle interactions in various transport processes. Gorain et al. [22] reviewed diesel particulate transport and mitigation technologies and focused on pollutant-control technologies in engineering systems. Marcato et al. [23] used CFD and artificial intelligence to improve prediction accuracy for porous-flow models and Otaru et al. [24] integrated experiments, CFD and ANN models to characterize hydrodynamic properties of porous structures. In addition, Săftoiu et al. [25] discuss further engineering materials and structural considerations for transportation applications where porous and flow-related phenomena affect system performance.
Numerous methods have been developed for modeling porous-media flow, analyzing heat transfer, modeling particle transport, and predicting flow phenomena using CFD, but most of the previous research has focused on one of these aspects at a time. Their coupled interaction has received little attention so far, especially for application in automotive catalytic converters where coupled smoke transport, heat absorption, pressure drop, permeability, porosity and flow resistance all play an important role in the overall system performance. In addition, the effects of porous media properties and operating conditions on smoke attenuation and thermal management are not well understood. In the present work, a CFD framework, which is systematic in examining porous media flow behavior, is used to explore the relationships between porosity, permeability, porous thickness, and flow behavior related to smoke transport, heat absorption and hydraulic performance in automotive catalytic converters with the goal of establishing an optimal porous-media design range.
A review of the literature indicates four main knowledge clusters: (i) porous-medium flow resistance and Darcy-Forchheimer modelling, (ii) internal flow distribution and pressure-drop characterization in catalytic converters, (iii) migration, dispersion and attenuation of smoke and aerosol pollutants in porous environments, and (iv) thermal transport, heat absorption and temperature management of porous systems. The importance and development of each of the four phenomena are significantly greater than in the past, but no studies have been reviewed that investigate all four phenomena simultaneously in an automotive catalytic converter. Lack of a single parametric study that connects the porous-medium design variables to combined smoke attenuation, thermal performance, and hydraulic characteristics. Hence, the present work aims at filling the major gap.
Most of the previous porous media studies discussed in the literature focus on either heat transport or fluid flow problems in isolation, and few studies examine the combined effect of transport of smoke, absorption of heat and aerodynamic response in automotive catalytic converters. Moreover, the application of porous resistance, porous thickness and the effects of porosity and permeability in different flow conditions with CFD methodology is not well utilized. Through the CFD simulations, it is aimed to quantify the influence of porous media characteristics, such as porosity, permeability, and absorptivity on the smoke penetration, temperature distribution, pressure drop, and heat absorption in an automotive catalytic converter. The innovation of the present work is the combined CFD analysis of smoke transport, thermal behavior, and flow in a porous catalytic converter under parametric analysis of porosity, permeability, thickness and flow velocity for the optimum performance parameters.
In addition to the CFD simulation of a porous catalytic converter, the main contribution of this study is the systematic quantification of the smoke attenuation, thermal absorption and aerodynamic resistance relationship for various porous media properties. A smoke-thermal performance index (PI) is also introduced to evaluate the overall performance of the catalytic converter and optimize the design region. Based on the results, a porosity of about 0.65 is considered to be optimum in terms of pollutant attenuation and thermal management. Anything above this value increases the flow passage and decreases the normalized smoke attenuation and the heat transfer efficiency.
The numerical approach used to study the transport of smoke, heat absorption, and flow behavior in the porous catalytic converter is described. A 3-D model of the converter was made, and the flow of the exhaust gas through the porous catalytic body was simulated. The governing conservation equations of mass, momentum, energy, and species transport were solved using CFD analysis. The methodology includes computational domain design, mesh generation, mesh independence verification, boundary condition specification, and defining the porous media, including the porosity and permeability. These procedures together allow accurate prediction of the thermal and flow characteristics of the catalytic converter under different operating conditions.
2.1 Domain design description
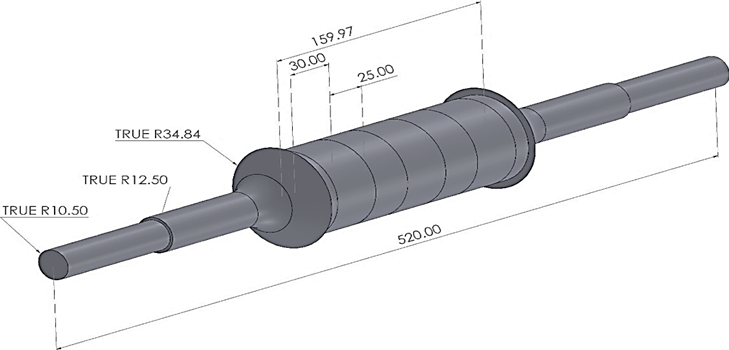
The design of the catalytic converter's computational domain was developed for an automotive exhaust converter with the main geometric features represented using a three-dimensional CAD model. The converter system's total length is approximately 520 mm, which can be divided into these four parts:
- The inlet pipe
- The diffuser section
- Porous catalytic chamber
- Outlet pipe
The inlet pipe with a 10.50 mm radius inlet space expands gradually through the diffuser area to a larger chamber of 34.84 mm radius to ensure the smooth passage of the exhaust gases in the catalytic region. The flow section between the inlet pipe and the catalytic chamber has a radius of 12.50 mm, and the axial length is about 30 mm, which allows the gas to expand slowly and the pressure to be lost gradually, as shown in Figure 1. The central catalytic chamber contains the porous medium (approximately 159.97 mm axial length), and an additional section of approximately 25 mm represents the outlet transition region. This geometry was chosen in order to simulate a natural flow expansion, porous interaction, and heat transfer phenomena that are usually seen in every automotive catalytic converter.
Figure 1. Geometrical design and dimensions of the catalytic converter computational domain
2.2 Mesh generation
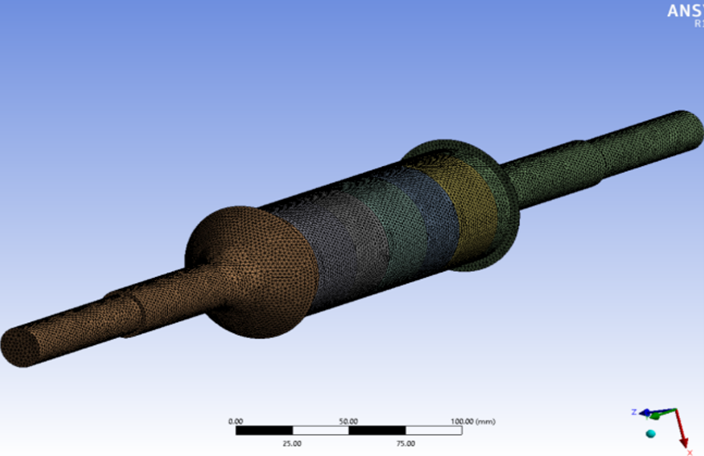
The computational domain of the catalytic converter was discretized using a structured–unstructured hybrid mesh that accurately conveys the flow and thermal properties within the porous catalytic region. Higher mesh resolution was implemented in the key sections of the inlet diffuser, porous catalytic chamber, and outlet transition region, which contain the expected strong gradients of velocity, temperature, and pressure. On the other hand, a comparatively coarser mesh was employed for the straight pipe areas in order to decrease computational costs while preserving the precision of the solution. Focus was placed on the porous media region, where a more refined mesh yields a more accurate assessment of the interactions between the flow resistance and heat transfer of the exhaust gases into the porous catalytic structure. To ensure that the numerical results are not influenced by the grid size, a mesh independence analysis was used. Four types of mesh design, using various computational cells, were experimented with, and the outlet temperature and pressure drop were checked. The results show that the difference in predicted parameters is negligible after a certain mesh density. Therefore, the mesh containing approximately 520,000 elements was chosen for the final simulations since it has the computational accuracy and the simulation time is very good. Findings show that the gap between Mesh 3 and Mesh 4 is very small (less than 0.1%), indicating that Mesh independence has been achieved, as shown in Figure 2. Hence, Mesh 3 was used for all the remaining CFD simulations.
Figure 2. Computational mesh structure of the catalytic converter domain used for the Computational Fluid Dynamics (CFD) simulation
To further verify mesh independence for transport phenomena, we evaluated another local indicator in the porous catalytic region. We monitored the average smoke concentration inside the porous chamber for all mesh configurations. We observed only a small difference between Mesh 3 and Mesh 4, which means that the mesh selected indeed captures not only global quantities such as pressure drop and outlet temperature, but also smoke transport characteristics. Therefore, we decided to use the mesh with around 520,000 cells, as shown in Table 1, to conduct all future simulations.
Table 1. Mesh independence study for the catalytic converter model
|
Mesh Case |
Number of Cells |
Outlet Temperature (K) |
Pressure Drop (Pa) |
Average Smoke Concentration in Porous Region |
Relative Error (%) |
|
Mesh 1 |
120,000 |
317.9 |
441 |
0.118 |
— |
|
Mesh 2 |
280,000 |
316.8 |
447 |
0.111 |
0.35 |
|
Mesh 3 |
520,000 |
316.4 |
450 |
0.108 |
0.12 |
|
Mesh 4 |
860,000 |
316.3 |
451 |
0.107 |
0.03 |
2.3 Boundary conditions
Appropriate boundary conditions were applied reflecting the typical exhaust flow conditions to accurately model the flow and thermal behavior of the catalytic converter. The inlet boundary is assumed to be a velocity inlet with the exhaust gas velocities ranging from 0.35–1.45 m/s depending on the parametric case studied in some part of the study. The process described by the temperature of the inlet gas was found to be optimal within 320 K–350 K, or the heat condition of exhausts coming into the catalytic converter. Besides, the level of the inlet smoke was normalized to 1.0, following the level of the pollutant at the converter inlet. The outlet boundary is an air pressure outlet, and pressure condition #101325 is "atmospheric pressure". So, the outlet is an undirected flow of air. The external wall of a catalytic converter was considered as a stationary wall with a no-slip mechanism; therefore, the velocity of fluid on the wall surface was considered zero. Thermal boundary conditions were considered, with the porous structure as an active layer, in which convective heat can pass through the wall and absorb thermal energy of the exhaust gases. The structure of the catalytic material was approximated as porous media and the porous resistance, permeability and porosity were calculated for the modelling of the structure of the catalytic material. The range of porosity studied is 0.4 to 0.8 and the range of permeability studied is 1 × 10⁻⁸ to 1 × 10⁻⁷ m². These parameters govern the flow through the porous catalytic medium, both momentum loss and resistance. The boundary conditions have been selected to perfectly reflect the physical operation system of an automotive catalytic converter and to realistically simulate smoke transport, heat release and aerodynamic behavior.
All the parameter ranges are summarized in Table 2 to avoid confusion in the interpretation of the CFD results. The full parametric study is presented for all operating parameters provided in the manuscript, but some of the figures and sensitivity analyses are more specific to certain subsets of these parameters. When the range is reduced, it is explicitly indicated in the caption of Figure 3 and the discussion.
Table 2. Summary of investigated parameter ranges
|
Parameter |
Range |
|
Inlet Velocity (m/s) |
0.35–1.45 |
|
Reynolds Number (Re) (-) |
2000–12000 |
|
Porosity (-) |
0.38–0.83 |
|
Permeability (m²) |
1 × 10⁻⁸ – 1 × 10⁻⁷ |
|
Porous Thickness (m) |
0.03–0.18 |
|
Inlet Temperature (K) |
320–350 |
|
Porous Resistance (m⁻²) |
20,000–60,000 |
Figure 3. Flowchart of the Computational Fluid Dynamics (CFD) methodology for investigating smoke transport and heat transfer in a porous catalytic converter
2.4 Governing equations
Conservation equations of species concentration, energy and momentum were used to model the flow, heat transfer and smoke transport within the porous catalytic converter. A porous resistance source term was added to the momentum equations in the conventional fluid-flow equations since the flow passes through a porous catalytic medium. All governing equations are given in standard vector form for clarity and reproducibility. The variables, coefficients and source terms are defined immediately following their equation along with their physical meaning and their SI units if they exist. The equations are the coupled conservation of mass, momentum, energy and species concentration in the porous catalytic converter, which are solved numerically in the framework of CFD implemented in the ANSYS Fluent software.
2.4.1 Continuity equation
The conservation of mass for incompressible steady flow is given by:
$\nabla \cdot \left( \rho \overset{\ddot{\ }}{\mathop{t}}\, \right)=0$ (1)
where,
$\rho $ is the fluid density $\left( \text{kg}/{{\text{m}}^{3}} \right)$, and
$\vec{v}$ is the velocity vector $\left( \text{m}/\text{s} \right)$.
2.4.2 Momentum equation
The momentum transport in the fluid region is described by the Navier-Stokes equation:
$\nabla \cdot \left( p\|\vec{v} \right)=-\nabla p+\nabla \cdot \left( \mu \nabla \vec{v} \right)+{{S}_{m}}$ (2)
where,
$p$ is the pressure $(Pa)$,
$\mu $ is the dynamic viscosity ($\text{Pa}-s$),
${{\vec{S}}_{m}}$ is the momentum source term due to the porous medium.
The Darcy term represents viscous momentum losses caused by fluid interaction with the porous matrix and dominates at relatively low flow velocities. The Forchheimer term accounts for inertial losses associated with flow acceleration and deceleration through the porous passages and becomes increasingly important at higher Re. Together, these terms describe the hydraulic resistance of the catalytic porous structure. For the porous catalytic region, the momentum source term is commonly expressed using the Darcy- Forchheimer model:
${{S}_{i}}=-\left( \frac{\mu }{K}{{v}_{i}}+{{C}_{2}}\frac{1}{2}\rho \left| \overrightarrow{{{v}'}} \right|{{v}_{i}} \right)$ (3)
where,
$K$ is the permeability of the porous medium (${{\text{m}}^{2}}$),
${{C}_{2}}$ is the inertial resistance factor $\left( 1/\text{m} \right)$,
${{v}_{i}}$ is the velocity component in the $i$-direction.
The first term represents viscous resistance, while the second term accounts for inertial losses inside the porous structure.
2.4.3 Energy equation
The effective thermal conductivity represents the combined conductive contribution of the solid porous matrix and the fluid occupying the pore space. Therefore, heat transfer within the catalytic converter depends on both the porous-medium properties and the local flow conditions.
The heat transfer inside the catalytic converter is governed by the energy equation:
$\nabla \cdot \left[ \vec{v}\left( \rho E+p \right) \right]=\nabla \cdot \left( {{k}_{eff}}\nabla T \right)+{{S}_{h}}$ (4)
For incompressible flow, it is often simplified as:
$\rho {{c}_{p}}\left( \vec{v}\cdot \nabla T \right)=\nabla \cdot \left( {{k}_{eff}}\nabla T \right)$ (5)
where,
$T$ is the temperature ($\text{K}$),
${{c}_{p}}$ is the specific heat capacity $\left( \text{J}/\text{kg}\cdot \text{K} \right)$,
${{k}_{eff}}$ is the effective thermal conductivity ($\text{W}/\text{m}\cdot \text{K}$),
${{S}_{k}}$ is the heat source term.
In the porous region, the effective thermal conductivity combines the fluid and solid contributions.
2.4.4 Species transport equation
In the present study, smoke concentration is represented by the smoke mass fraction, which is treated as a transported scalar quantity. The species transport equation accounts for both convective transport by the flow field and diffusive transport resulting from concentration gradients within the porous catalytic structure.
The smoke concentration was modelled as a species with the species transport equation:
$\nabla \cdot \left( \rho \overset{\ddot{\ }}{\mathop{\nabla }}\,{{Y}_{x}} \right)=\nabla \cdot \left( \rho {{D}_{eff}}\nabla {{Y}_{x}} \right)+{{S}_{x}}$ (6)
where,
${{Y}_{s}}$ is the smoke mass fraction,
${{D}_{eff}}$ is the effective diffusion coefficient (${{\text{m}}^{2}}/\text{s}$),
${{S}_{n}}$ is the source term for smoke species.
This is an equation for the convection and diffusion of smoke particles in the catalytic converter.
Porosity Relation
Another influencing parameter of the porous medium effect is the void fraction of the medium, denoted as porosity ε:
$\varepsilon =\frac{{{V}_{\text{toid }\!\!~\!\!\text{ }}}}{{{V}_{\text{total }\!\!~\!\!\text{ }}}}$ (7)
where,
${{V}_{toid}}$ is the volume occupied by fluid, and
${{V}_{\text{total}}}$ is the total porous volume.
2.4.5 Performance equations
Several parameters were calculated to assess the performance of the catalytic converter:
Pressure drop:
$\Delta P={{P}_{\text{in}}}-{{P}_{\text{ond}}}$ (8)
Heat absorption efficiency:
${{r}_{jn}}=\frac{{{T}_{in}}-{{T}_{ont}}}{{{T}_{in}}}\times 100$ (9)
Normalized smoke attenuation:
${{\eta }_{s}}=\frac{{{Y}_{in}}-{{Y}_{cox}}}{{{Y}_{in}}}\times 100$ (10)
The numerical solution of these governing equations was obtained using the software ANSYS Fluent to model the flow inside the porous catalytic converter, heat absorption, pressure drop and smoke transport.
This will quantify the synergistic effect of porous-media properties on smoke attenuation and heat absorption using a dimensionless overall smoke–thermal performance index (PI). This index was developed as a convenient metric to evaluate smoke-removal capability as well as the thermal absorption performance of various configurations of porous media to be compared on a single index.
The overall smoke-thermal performance index (PI) is defined as:
$PI=100\left[ ws\eta \text{ }\!\!~\!\!\text{ }s,n+\left( 1-ws \right)\eta h,n \right]$ (11)
In which, the smoke-thermal performance index (PI), the smoke-weighting factor (ws), the normalized smoke-removal efficiency (ηs, n) and the normalized heat-absorption efficiency (ηh, n). The weighting factor ws is between 0 and 1. The larger the value of ws, the more important the smoke attenuation, and the smaller the value of ws, the greater the importance of thermal absorption performance. The multiplier is 100, which is only to make the index convenient to be expressed on a scale from 0 to 100.
To combine the two performance measures without dimensional inconsistency, both smoke-removal efficiency and heat-absorption efficiency were normalized using the min-max normalization approach. The normalized smoke-removal efficiency was calculated as:
$\eta s,n=\left( \eta s-\eta s,min \right)/\left( \eta s,max-\eta s,min \right)$ (12)
Similarly, the normalized heat-absorption efficiency was calculated as:
$\eta h,n=\left( \eta h-\eta h,min \right)/\left( \eta h,max-\eta h,min \right)$ (13)
where, ηs is the smoke-removal efficiency, and ηh is the heat-absorption efficiency. The subscripts min and max represent the minimum and maximum values obtained from the investigated parametric cases. Through this normalization procedure, both variables become dimensionless and vary between 0 and 1, enabling their direct combination within the overall performance index (PI).
In this study, the smoke-weighting factor (ws) was taken as 0.3, 0.5 and 0.7 to investigate the effect of the design priorities on the optimum porous-medium configuration. These values are known as thermal-oriented, balanced smoke–thermal and smoke-oriented performance, respectively. The optimum porosity was determined for each weighting factor, then compared to conduct a sensitivity analysis. The results demonstrated that the optimum porosity was in the relatively narrow range of 0.60-0.65, meaning that the proposed performance index (PI) was relatively robust, with the main conclusions not being highly sensitive to moderate changes in the weighting factors used to derive the PI.
Table 3. Sensitivity of optimum porosity to the smoke weighting factor
|
Smoke Weight Factor, ws |
Design Priority |
Maximum Performance Index (PI) |
Optimum Porosity |
|
0.3 |
Thermal-oriented design |
≈82 |
≈0.65 |
|
0.5 |
Balanced smoke–thermal design |
≈78 |
≈0.65 |
|
0.7 |
Smoke-oriented design |
≈76 |
≈0.60–0.65 |
It is seen from the sensitivity check that the smoke-weighting factor changes the magnitude of the performance index (PI) but has no significant effect on the optimum design region. For all tested weighting factors, the highest combined performance remained within a porosity range of approximately 0.60–0.65, confirming that the identified optimum is not an artifact of a single weighting choice (Table 3).
2.5 Numerical setup
CFD simulations were performed using ANSYS Fluent. A pressure-based steady state solver was used in this study because the objective of the study was to investigate the average flow, smoke transport and thermal behavior in the catalytic converter at constant operating conditions. The pressure-velocity coupling was achieved with the SIMPLE algorithm. For momentum, energy, and species transport equations, the upwind discretization schemes were applied to gain numerical accuracy. Pressure interpolation was done using the standard pressure scheme. The porous catalytic region was modeled using the Darcy-Forchheimer porous-media formulation. Since the Re range was studied up to 12,000, the realizable k–ε turbulence model with standard wall functions was used to account for turbulence effects and flow mixing inside the converter. Convergence was considered when residuals fell below 10⁻⁵ for continuity, momentum, and species equations and below 10⁻⁶ for the energy equation. Further monitoring of outlet temperature, pressure drop, and smoke concentration showed stability and convergence of the solution (Table 4).
Table 4. Numerical setup used in the Computational Fluid Dynamics (CFD) simulations
|
Parameter |
Specification |
|
Software |
ANSYS Fluent |
|
Solver Type |
Pressure-Based Solver |
|
Flow Model |
Steady-State |
|
Pressure–Velocity Coupling |
SIMPLE |
|
Pressure Discretization |
Standard |
|
Momentum Discretization |
Second-Order Upwind |
|
Energy Discretization |
Second-Order Upwind |
|
Species Discretization |
Second-Order Upwind |
|
Porous Media Model |
Darcy–Forchheimer Model |
|
Turbulence Model |
Realizable k–ε with Standard Wall Functions |
|
Continuity Residual |
10⁻⁵ |
|
Momentum Residual |
10⁻⁵ |
|
Species Residual |
10⁻⁵ |
|
Energy Residual |
10⁻⁶ |
|
Mesh Used |
520,000 Cells |
|
Convergence Monitoring |
Outlet Temperature, Pressure Drop, Smoke Concentration |
In this study, smoke is represented as a normalized scalar concentration in the flow field as a species transport equation. The smoke variable is therefore only an indicator of pollutant dispersion and attenuation in the porous catalytic converter, not of specific particulate species or reactivity of the exhaust components. The model assumes a steady transport of a passive scalar and does not consider particle inertia, particle deposition, thermophoretic effects, clogging mechanisms, catalytic surface reactions, or pollutant-conversion chemistry. Hence, the simulations are meant to assess the effect of porous media properties on flow resistance, scalar transport, and thermal behavior of the catalytic converter in a very simplified way. Therefore, the results should be regarded as indicators of transport and thermal performance rather than direct predictions of catalytic conversion efficiency or actual emission reduction rates.
In this section, numerical results from CFD simulations of the porous catalytic converter are presented and the effect of certain parameters on flow and thermal behavior is discussed. The influence of the porosity, permeability, porous thickness, inlet velocity, and Re on smoke transport, temperature distribution, pressure drop and heat absorption efficiency in the converter is studied. To give a thorough understanding of the interaction between exhaust gases and the porous catalytic structure, both quantitative parametric results and CFD visualizations are presented. The results provide valuable information on the effects of the porous media properties on the smoke attenuation, thermal management and aerodynamic behavior of the overall catalytic converter.
3.1 Parametric analysis of porous media effects on smoke transport, thermal behavior, and aerodynamic performance in the catalytic converter
The outlet smoke temperature as a function of increase in porous media thickness is shown in Figure 4 for inlet velocities of 0.6, 1.0, and 1.4 m/s. As porous thickness increased from 0.03 m to 0.18 m, the outlet temperature decreased from 341 K to 336 K, indicating enhanced thermal energy absorption by the porous catalytic structure. The lowest outlet temperature (approximately 334–336 K) was observed at maximum thickness (0.18 m) and minimum inlet velocity (0.6 m/s), where increased porous thickness and reduced flow velocity collectively promoted greater heat absorption within the converter.
Figure 4. Effect of porous media thickness on outlet smoke temperature at different inlet smoke velocities
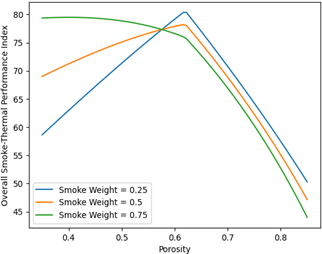
The relationship between porosity and overall smoke–thermal performance index (PI) for smoke weight factors of 0.25, 0.5, and 0.75 (Figure 5). The performance index (PI) increases with the porosity in the fluid until it finally reaches an optimal value of 0.65, where the maximum performance index (PI) is roughly 80, 78, and 76 for smoke weights of 0.25, 0.5, and 0.75, respectively. Beyond this point, increasing porosity to 0.83 seriously reduces its performance index (PI) into about 50–44, indicating that with porosity too high, it will weaken the balance between the effectiveness of smoke removal and effective cooling of heat.
Figure 5. Effect of porosity on the overall smoke–thermal performance index (PI) under different smoke weight factors
Figure 6 illustrates the evolution of the smoke dilution index along the axial length of porous catalytic converter to mixing densities of 0.3, 0.6 and 0.9. The dilution index gradually increases from 0 at inlet (0 m) to approximately 0.83, 0.88, and 0.92 at the outlet (0.30 m), implying that smoke spreads more extensively within porous structure and can effectively mix between sources. Higher mixing intensity also causes considerably more smoke dilution, indicating that more vigorous internal mixing leads to the spread and decrease of smoke concentrations along the length of the converter. The variation of pressure drop with inlet smoke velocity for 1 × 10⁻⁸, 5 × 10⁻⁸, and 1 × 10⁻⁷ m² is shown in Figure 7. The pressure drop increases from 205 Pa to 450 Pa for the lowest permeability (1 × 10⁻⁸ m²) and increases moderately from 132 Pa to 168 Pa for the highest permeability (1 × 10⁻⁷ m²). This behavior corresponds to a decreased permeability of porous media, decreasing flow resistance, which leads to reduced pressure losses within the catalytic converter.
Figure 6. Variation of smoke dilution index along the porous catalytic converter at different mixing intensities
Figure 7. Effect of inlet smoke velocity and porous permeability on pressure drop in the catalytic converter
In Figure 8, the variation of the thermal non-uniformity index with Re for the porous thicknesses of 0.05 m, 0.10 m, and 0.15 m is shown. As the Re increases from 2000 to 12000, the thermal non-uniformity index rises from approximately 0.33 to 0.46 for the smallest thickness (0.05 m), while it increases from about 0.27 to 0.40 for the largest thickness (0.15 m). The results suggest that as flow rates increase, thermal gradients are enhanced, whereas increasing porous thickness results in better heat distribution and less thermal non-uniformity inside the converter.
Figure 8. Influence of Reynolds number (Re) and porous thickness on thermal non-uniformity in the catalytic converter
Figure 9. Effect of porosity on aerodynamic drag coefficient at different external flow speeds
Figure 10. Effect of inlet smoke temperature and porous thickness on heat absorption rate in the catalytic converter
Figure 11. Radial smoke distribution along the porous catalytic converter for different porosity levels
As shown in Figure 9, the change in aerodynamic drag coefficient (Cd) with increased porosity at external flow rates of 10 m/s, 20 m/s, and 30 m/s. By increasing porosity from about 0.38 to 0.83, the drag coefficient decreases from approximately 0.436 to 0.382 at 10 m/s, from 0.442 to 0.387 at 20 m/s, and from 0.448 to 0.393 at 30 m/s. As we can see from Figure 10, the improvement of airflow passage and lower aerodynamic resistance observed from porous structures improves the performance of the catalytic converter system. The heat absorption rate for porous thicknesses of 0.05 m, 0.10 m, and 0.15 m was found to vary as compared to the inlet smoke temperature. As the inlet temperature increases from 320 K to 380 K, the heat absorption rate rises from approximately 3 W to 10.4 W for 0.05 m, from 3 W to 12.6 W for 0.10 m, and from 3 W to about 14.8 W for 0.15 m. The tendency of the inlet temperatures to increase the temperature and the porous thickness for thermal exchange and the absorption of thermal energy within the catalytic converter also depends on the porosity values (Figure 11). At axial lengths from 0 m to 0.30 m, the spreading index increases from around 0.12 to 0.35 for porosity = 0.4, from 0.12 to 0.29 for porosity = 0.6, and from 0.12 to about 0.24 for porosity = 0.8. Results show that lower porosity improves radial smoke dispersion, while higher porosity promotes smoother axial flow and less lateral spreading.
3.2 Influence of porous media properties and flow parameters on smoke attenuation, thermal performance, and flow dynamics
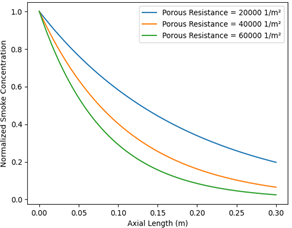
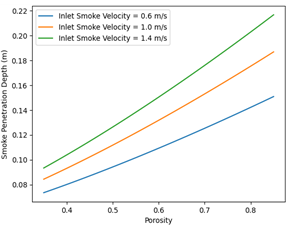
Figure 12 shows the variation of the normalized smoke concentration along the axial length of the catalytic converter for 20,000, 40,000, and 60,000 m⁻² porous resistance values. For 20,000 m⁻² under axial distance 0 m → 0.30 m, the concentration decreases from 1.0 → 0.20 (1.0 → ~0.07 for 40,000 m⁻², and 1.0 → ~0.03 for 60,000 m⁻²). A higher porous resistance means significantly improved smoke attenuation and faster reduction of pollutant concentration along the converter based on the results shown in this paper. Inlet smoke velocity variation in the shape of an inlet (0.6 m/s, 1.0 m/s, and 1.4 m/s) and porosity Figure 13 demonstrates that porosity determines the variation of smoke penetration depth along the beam. The deeper penetration depth rises sharply from close to 0.073 m to 0.151 m as the porosity increases, from 0.085 m to 0.187 m for 1.0 m/s, and from 0.094 m to nearly 0.218 m for 1.4 m/s, with higher porosity also allowing greater penetration of air pollutants into the porous catalytic structure, thereby increasing axial transport of smoke in the converter.
Figure 12. Axial smoke concentration decay along the porous catalytic converter at different porous resistance values
Figure 13. Influence of porosity and inlet smoke velocity on smoke penetration depth in the porous catalytic converter
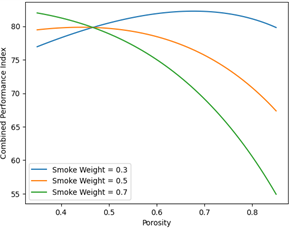
Figure 14 depicts the change of the combined performance index (PI) with porosity for smoke weighting factors of 0.3, 0.5, and 0.7. The porosity enhances the performance index (PI): it optimizes at a porosity ≈ 0.65, where maximum values are about 82, 78, and 76 for smoke weights 0.3, 0.5, and 0.7, respectively. Increasing porosity beyond this value, 0.83, would bring about a definite performance drop to almost 80, 67, and 55, as the above porosity affects the balance between smoke attenuation and thermal absorption efficiency.
Figure 15 shows the correlation between porosity and thermal effectiveness for inlet smoke temperatures of 330 K, 340 K, and 350 K; as the porosity increases from about 0.38 to 0.83, the thermal effectiveness decreases from around 6.7% to 3.4% for 330 K, from 6.5% to 3.3% for 340 K, and from 6.3% to almost 3.2% for 350 K, showing that more porosity reduces the heat transfer potential of the porous catalytic structure due to decreased solid–fluid interaction in the medium. The analysis revealed the association between flow uniformity index and Re at porosity values: 0.4, 0.6, and 0.8 Figure 16. The drop is from 0.73 to 0.60 for porosity = 0.4, from 0.77 to 0.64 for porosity = 0.6, and from 0.80 to 0.68 for porosity = 0.8 as the Re increases from around 2000 to 9000. Thus, the increase in Re leads to an increase in flow instability, and the increase in porosity leads to a flow distribution that is more uniform in the porous catalytic structure.
Figure 14. Combined smoke–thermal performance index (PI) as a function of porosity for different smoke weight factors
Figure 15. Thermal effectiveness variation with porosity for different inlet smoke temperatures
Figure 16. Flow uniformity index variation with Reynolds number (Re) for different porosity levels
Figure 17 depicts the change of residence time with porous thickness for permeability values of 1 × 10⁻⁸, 5 × 10⁻⁸, and 1 × 10⁻⁷ m². With the increase of porous thickness between 0.03 m and 0.18 m, residence time increases from approximately 0.205 s to 0.335 s for 1 × 10⁻⁸ m², from 0.187 s to 0.223 s for 5 × 10⁻⁸ m², and from 0.183 s to 0.203 s for 1 × 10⁻⁷ m². The results show that thicker porous media also prolong the residence time of the flow, whereas larger permeability decreases flow resistance and reduces the residence duration of the fluid in the catalytic converter.
Figure 17. Effect of porous thickness and permeability on flow residence time in the catalytic converter
Figure 18. Effect of permeability and porous thickness on heat absorption efficiency in the catalytic converter
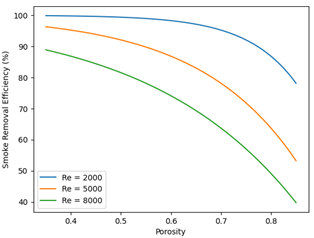
Figure 19. Effect of porosity and Reynolds number (Re) on normalized smoke attenuation in the porous catalytic converter
Figure 18 shows that heat absorption efficiency increases with permeability for porous thicknesses of 0.05 m, 0.10 m, and 0.15 m. The heat absorption efficiency increases with increasing permeability from approximately 1 × 10⁻⁸ to 1 × 10⁻⁷ m², from about 7.7% to 9.6% for 0.05 m, from about 8.4% to 12.2% for 0.10 m, and from 9.1% to almost 14.8% for 0.15 m. Normalized smoke attenuation between Re of 2000, 5000, and 8000 is shown in Figure 19 as a function of porosity. For Re ≈ 2000, the efficiency decreases from ~99% to 78%, to ~96% to 53% for Re ≈ 5000, and from ~89% to ~40% for Re ≈ 8000 when porosity increases from approximately 0.38 to 0.83. These results confirm that larger porosity and higher Re decrease the smoke removal capability since the presence of particles in a porous catalyst leads to reduced interactions between smoke particles and the porous catalyst medium.
The influence of porosity is determined by the balance between the flow resistance and fluid-solid interaction within the porous medium. At low porosity values, the decreased void space is able to increase the Darcy resistance and enhance the contact between the smoke-polluted flow and porous matrix, leading to less pressure loss and better thermal energy exchange. As porosity increases, the flow routes are more limited and the pressure loss is minimized, and the flow penetration becomes more efficient; however, more porosity reduces the available solid surface area for particle capture and heat transfer, and thus the smoke removal and thermal absorption are reduced in the absence of aerodynamic resistance. Theoretically, the porosity region around 0.65 is the best region where the two processes are balanced.
The effects of porous thickness and permeability are largely related to the residence time and momentum loss. Increasing porous thickness increases the distance traveled by the exhaust gases in the catalytic structure and hence increases residence time and allows more thermal energy to be transferred from the gas phase to the porous medium, which increases the heat absorption efficiency. However, the longer the flow path, the higher the frictional and inertial losses and therefore the pressure drop. On the other hand, larger permeability reduces the resistance of the flow and allows the fluid to flow in the porous matrix and thus helps to keep the flow going while also reducing pressure losses. The overall performance depends on finding a perfect balance between thermal enhancement and hydraulic penalties.
The reduced smoke-removal efficiency at higher Re is due to shorter interaction times between smoke particles and the porous catalytic structure. With higher Re, the flow velocity increases and the residence time in the porous medium decreases. The smoke particles have less time to pass through, intercept or interact with the porous matrix. Moreover, the particles are transported by the inertial forces through the porous structures, so that the amount of attenuation is reduced. Higher Re may improve convective transport, but they also decrease pollution-removal performance because the smoke particles have less time to meet the catalytic structure.
Overall, catalytic converter performance is governed by the interplay among hydraulic resistance, fluid residence time, and convective heat transfer. The higher the flow resistance, the better the smoke attenuation and thermal absorption through longer interaction in the porous structure, but if flow transport is better, there is less pressure loss but also less pollutant removal. Optimum system operation therefore requires a multi-criteria trade-off among the competing transport mechanisms, rather than the maximization of any single performance metric.
3.3 Influence of flow velocity, porosity, permeability, and porous thickness on thermal and flow characteristics of the catalytic converter
The distribution of the outlet smoke temperature with inlet velocity with porosity values of 0.4, 0.6, and 0.8 can be shown in Figure 20. As the inlet velocity goes from about 0.35 m/s to 1.45 m/s, the outlet temperature drops from roughly 338 K to 318 K (for porosity = 0.4), from 337 K to 315 K (for porosity = 0.6), 336 K to nearly 312 K (for porosity = 0.8). The increase in inlet velocity, along with increased porosity, allows for better convective heat transfer with the outlet smoke and therefore cool it and lower the heat transfer rates at outlet, as mentioned previously.
Figure 21 shows the pressure drop for porous thicknesses 0.05 m, 0.10 m, and 0.15 m, and the pressure drop is quite pronounced on porous thicknesses ranging from about 0.38 to 0.83, reaching around 510 Pa → 135 Pa and from 900 Pa → 150 Pa to 0.10 m and 1300 Pa → nearly 165 Pa for 0.15 m; these figures demonstrate that an increase in porosity reduces flow resistance while the increase in porous thickness greatly increases pressure losses to the interior of the catalytic converter.
Figure 20. Influence of inlet velocity and porosity on outlet smoke temperature in the porous catalytic converter
Figure 21. Effect of porosity and porous thickness on pressure drop in the catalytic converter
Figure 22. Axial variation of smoke mass fraction through porous media at different porous thicknesses
Figure 23. Effect of flow velocity and porosity on heat absorption efficiency in the porous catalytic converter
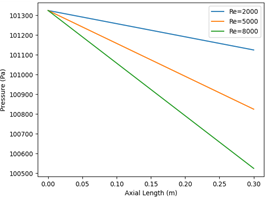
Figure 24. Axial pressure distribution in the catalytic converter for different Reynolds numbers (Re)
Figure 25. Axial velocity profiles in the porous catalytic converter for different permeability values
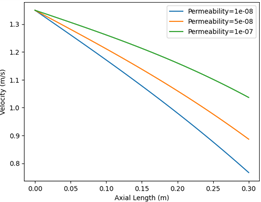
Figure 22 shows the decay of the smoke mass fraction along the axial length of the porous catalytic converter for the porous thicknesses of 0.05 m, 0.10 m, and 0.15 m; As the axial distance increases from 0 m to 0.30 m, the smoke mass fraction decreases abruptly from 1.0 to almost 0.01 for 0.05 m, from 1.0 to about 0.05 for 0.10 m and from 1.0 to slightly 0.14 for 0.15 m; thin porous media is shown to cause faster smoke attenuation, while thicker porous media allow deeper smoke penetration prior to significant concentrated loss. The relationship between heat absorption efficiency and flow velocity was demonstrated for porosity values of 0.4, 0.6, and 0.8 (Figure 23). From around 0.2 m/s up through about 1.4 m/s, the heat absorption efficiency increases from approximately 2.2% to 9.0% for porosity = 0.4, from 2.4% to 9.8% for porosity = 0.6 and from about 2.6% to 10.6% for porosity = 0.8. These outcomes suggest that the increasing flow velocity and porosity improve the convective heat transfer, the optimal thermal absorption in the catalytic converter. The pressure along the axial length of the catalytic converter for 2000 Reynolds, 5000 Reynolds and 8000 Reynolds is displayed in Figure 24. The pressure decreases from ca. 101325 Pa to ca. 101125 Pa at a distance of 0 m to 0.30 m for Re = 2000; 101325 Pa to ca. 100825 Pa for Re = 5000; and 101325 Pa to ca. 100525 Pa for Re = 8000. Higher Re are confirmed as a source of momentum losses and pressure fall because of increasing flow resistance and turbulence in the porous catalytic structure. To show the change of flow velocity throughout at the axial length of the catalytic converter to permeability 1 × 10⁻⁸, 5 × 10⁻⁸, and 1 × 10⁻⁷ m², a plot of Figure 25 is shown. As the axial distance grows from 0 m to 0.30 m, it loses the velocity from around 1.35 m/s to 0.77 m/s for 1 × 10⁻⁸ m², for 1.35 m/s to around 0.89 m/s for 5 × 10⁻⁸ m², and from 1.35 m/s to almost 1.04 m/s for 1 × 10⁻⁷ m². The findings showed that the increased permeability lowers the resistance of the flow in the porous catalytic medium, enabling the flow propagation with velocity up the length of the converter.
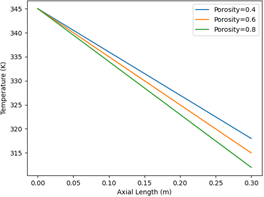
Figure 26 shows the temperature along the axial axis of the catalytic converter with porosity of 0.4, 0.6, and 0.8 values. The temperature decreases at a larger axial distance from 0 m-0.30 m from 345 K to 318 K for porosity = 0.4, from 345 K to about 315 K for porosity = 0.6, and from 345 K to almost 312 K for porosity = 0.8. It can be seen that the higher the porosity, the larger the heat transfer and cooling of the porous medium, which leads to an increased reduction in temperature along the converter length.
Figure 26. Axial temperature distribution in the porous catalytic converter for different porosity values
3.4 Computational Fluid Dynamics visualization of temperature and velocity fields inside the porous catalytic converter
The static temperature contours, as shown in Figure 27, vary from around 345 K at the inlet region to around 310–315 K at the outlet region of the catalytic converter. The highest temperature zones are the inlet pipe and diffuser zone, which show high thermal energy of the inlet exhaust gases. The temperature slowly decreases from the porous catalytic region as the flow passes through the porous region, which provides more surface area for heat absorption and convective heat transfer.
Figure 27. Static temperature contours inside the porous catalytic converter
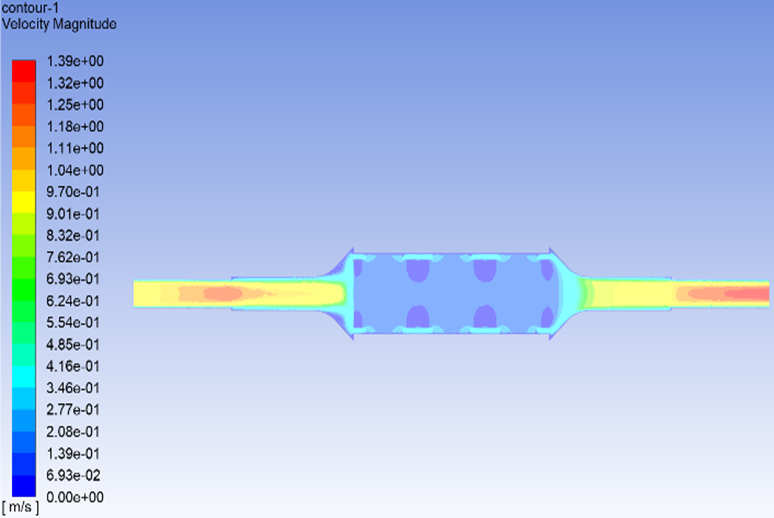
The velocity magnitude contours are shown along the catalytic converter in Figure 28, where one can see that the velocity in the inlet region is around 1.35 m/s while in the porous catalytic zone the velocity ranges between 0.15–0.30 m/s. The velocity is maximum at the pipes leading into and out of the porous region, and drops considerably in the porous region where flow resistance and momentum loss occur. This velocity reduction implies that the porous catalytic structure has a beneficial effect on reducing velocity, which increases the interaction time between exhaust gases and the porous medium.
Figure 28. Velocity magnitude contours inside the porous catalytic converter
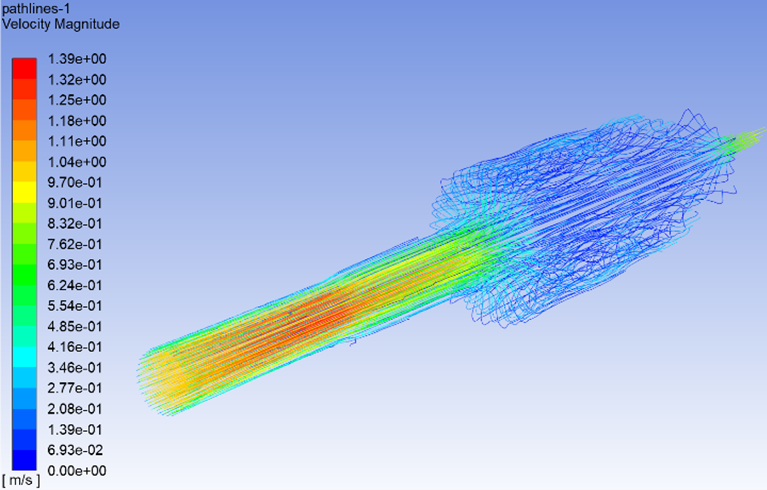
The velocity pathlines (Figure 29) within the catalytic converter indicate the velocity magnitude changes between approximately 1.35 m/s at the inlet region and about 0.2 – 0.6 m/s within the porous region. The pathlines are similar to the flow entering the system as a relatively uniform flow that has strong dispersion and recirculation within the porous region. These flow structures ensure mixing and increase the interaction between exhaust gases and porous catalytic medium, thus increasing the heat transfer and smoke attenuation.
Figure 29. Velocity pathlines and flow behavior through the porous catalytic converter
Figure 30 shows the temperature vector distribution along the catalytic converter which varies from about 350 K at the inlet region to about 305–310 K at the outlet end of the converter. The following figure shows strong thermal gradients near the diffuser region where the flow enters the porous structure during the exhaust flow indicated by the vectors. The temperature gradually cools as the gases flow through the porous catalytic zone because of increased heat absorption and energy dissipation in the porous medium.
Figure 30. Temperature vector distribution and thermal transport inside the porous catalytic converter
The present CFD results are compared to those in published porous-media and heat-transfer studies in qualitative trends and order of magnitude performance indicators. The Darcy–Forchheimer model was used by Abbas et al. [1] to investigate convective heat and mass transfer in porous media and the present work has been able to absorb heat up to ~14.8%, although direct quantitative comparison cannot be made easily due to differences in geometry, fluid type, and boundary conditions. Al-Gaheeshi et al. [2] in their study examined the effect of permeability on pressure drop for porous media and in the present study, the increase in the porosity from 0.38 to 0.83 significantly decreased the pressure drop, which can be compared with the Darcy–Forchheimer behavior reported by Al-Gaheeshi et al. [2] but not in a direct percentage comparison because of the different geometrical configurations of the two studies. Elrahmani et al. [10] studied particle migration in porous media and pointed out the effects of pore geometry on transport, but these are the percentage differences in the geometry-specific test with the geometry-specific boundary conditions used in this study and should not be directly compared with percentage differences in different geometric systems. The present CFD results demonstrate that a smoke dilution index of 0.92 is achieved by smoke inside the porous converter, that is a significant airflow effect on smoke dispersion in the ventilated car park, which is qualitatively similar to the result reported by Rahif and Attia [11] for the smoke transport due to the airflow, but not applicable for quantitative comparison due to the different application domains. Sivasankaran and Bhuvaneswari [7] reported that the performance of the heat transfer of hybrid nanofluids in porous channels was improved at the expense of higher pressure drop; in the present study, similar performance trade-off is obtained in the catalytic converter, with improved performance of thermal performance at the expense of higher pressure drop. When considering the results as a whole, the overall trends seen in these earlier studies are confirmed by the results in the present study, and the range of optimal porosity identified (0.60-0.65) is deemed to be appropriate for the specific geometric and flow parameters explored in this study.
Table 5. Verification of Computational Fluid Dynamics (CFD) predictions against expected porous-media behavior
|
Parameter |
Expected Physical Behavior |
CFD Result |
Verification Status |
|
Pressure Drop vs. Velocity |
Increases with velocity |
Qualitatively observed (see Fig. and text) |
Physically consistent |
|
Pressure Drop vs. Permeability |
Decreases with permeability |
Qualitatively observed (see Fig. and text) |
Physically consistent |
|
Residence Time vs. Thickness |
Increases with thickness |
Observed |
Verified |
|
Heat Absorption vs. Thickness |
Increases with thickness |
Observed |
Verified |
|
Smoke Attenuation vs. Porous Resistance |
Increases with resistance |
Observed |
Verified |
|
Velocity Retention vs. Permeability |
Increases with permeability |
Observed |
Verified |
|
Temperature Reduction Along Converter |
Progressive decrease |
Observed |
Verified |
3.5 Model verification and validation assessment
Although direct experimental measurements for the catalytic-converter configuration were not available, several verification and physical consistency tests were done to confirm the accuracy of the CFD predictions. First of all, we tested the numerical results against the expected Darcy-Forchheimer behavior in the case of flowing through porous media. According to porous-media transport theory, the pressure drop should increase with increasing flow velocity and porous resistance but decrease with increasing permeability. The CFD predictions were indeed in this direction throughout the whole parameter range we investigated. For example, the pressure drop is increasing with increasing inlet velocity and porous thickness, but it drops significantly with permeability, from 1 × 10⁻⁸ to 1 × 10⁻⁷ m². These results are fully consistent with the Darcy-Forchheimer model used in the numerical simulations. Moreover, the flow-field behaviour is physically realistic, as shown in Table 5. The velocity significantly decreased in the porous catalytic region due to the viscous and inertial resistance effects, while the temperature decreased along the converter length due to the heat absorption of the porous medium. Similarly, the reduced normalized smoke concentration along the flow direction is consistent with increased residence time and the interaction of the transported scalar with the porous structure. These trends are confirmed in the porous channels and catalytic converter systems from CFD and porous media literature. Moreover, the predicted operating ranges were examined for physical realism. The pressure drop values, outlet temperatures, and flow velocities
Porous resistance exerted a significant influence on smoke attenuation across the converter. The study confirming that higher porous resistance promotes effective pollutant removal. Porosity was found to substantially affect smoke penetration depth. The study indicates that higher porosity facilitates deeper smoke diffusion within the porous structure. The best combined smoke–thermal performance index (PI) can be attained at porosity ≈ 0.65, which values reached maximum performance values of approximately 82, 78, and 76 with smoke weighting factors of 0.3, 0.5, and 0.7, respectively. At 0.83 porosity, the performance index (PI) decreased to ~80, 67, and 55, indicating that increased porosity reduces the total efficiency. Thermal effectiveness decreased with increasing porosity; specifically, increasing porosity from 0.38 to 0.83 reduced thermal effectiveness from 6.7% to 3.4% at 330 K, from 6.5% to 3.3% at 340 K, and from 6.3% to 3.2% at 350 K, owing to diminished solid–fluid thermal exchange. The residence time of exhaust gases increased with porous thickness. For permeability 1 × 10⁻⁸ m², residence time increased from 0.205 s to 0.335 s with thickness 0.03 m to 0.18 m, and residence time decreased to 0.183–0.203 s for higher permeability (1 × 10⁻⁷ m²). Heat absorption efficiency was enhanced by both porous thickness and permeability. At a thickness of 0.15 m, efficiency increased from 9.1% to approximately 14.8% as permeability increased from 1 × 10⁻⁸ m² to 1 × 10⁻⁷ m² due to the higher permeability. Normalized smoke attenuation decreased with increasing porosity and Re. At Re ≈ 2000, smoke attenuation efficiency decreased from 99% to 78% as porosity increased from 0.38 to 0.83, while at Re ≈ 8000, efficiency decreased from approximately 89% to approximately 40%. Increasing inlet velocity from 0.35 m/s to 1.45 m/s reduced the outlet smoke temperature from 338 K to 318 K at a porosity of 0.4, from 337 K to 315 K at a porosity of 0.6, and from 336 K to 312 K at a porosity of 0.8, owing to enhanced convective heat transfer. These findings collectively indicate that the most effective porous media configuration is achieved at a porosity range of 0.60–0.65, combined with adequate permeability and optimized porous thickness, to maximize smoke attenuation, heat absorption, and hydraulic performance.
The overall performance results in Table 6 are summarized, as it can be observed that no single performance parameter is optimal at the same porosity level. Lower porosity is more effective at smoke attenuation but leads to higher pressure loss, and higher porosity is better at hydraulic resistance but weaker in smoke removal and thermal exchange. The intermediate porosity range of about 0.60–0.65 is the best compromise between smoke attenuation, heat absorption, temperature reduction, and pressure drop. This balance is also reflected in the maximum values of the smoke–thermal performance index (PI), so it is also the most appropriate choice of the design range. From the design point of view, the results indicate that porous-media optimization should be based on a multi-dimensional approach and not on one single performance measure. Whereas lower porosity causes better smoke attenuation and higher porosity reduces the flow resistance, neither of them provides the best overall performance. The recommended porosity range of 0.60–0.65 is the best configuration to achieve smoke transport attenuation, thermal absorption, and hydraulic performance and is the preferred configuration for the catalytic-converter design.
While the current experiment is valuable in understanding the dynamics of the smoke transport, the heating, the heat absorption, and the flow phenomena in a porous catalytic converter, we can further consider several implications for future research. First, empirical verification of this numerical data is suggested to verify the CFD predictions realized for the automotive exhaust conditions. Second, in future investigations could be carried out by evaluating various porous materials and catalyst substrates (e.g., ceramic honeycomb or metallic foams) and their effects on heat transfer and pollutant removal efficiency. Third, the impacts of chemical reactions that take place inside the catalytic converter could also be included in the CFD model in which the actual catalytic oxidation and reduction of exhaust gases can be imitated. In addition, some future work may concentrate on the effects of transient engine parameters, for instance, changing exhaust temperature and flow rate, on the performance of the porous catalytic system. Last but not least, optimization methodologies and sophisticated computational methods (machine learning or multi-objective optimization) could be used to find an ideal porosity, permeability and geometric parameters trade-offs in smoke attenuation while minimizing pressure losses.
Table 6. Summary of key performance indicators for representative porosity values
|
Porosity |
Smoke Removal Efficiency (%) |
Temperature Reduction (K) |
Pressure Drop (Pa) |
Heat Absorption Efficiency (%) |
Performance Index (PI) |
|
0.40 |
High (95–99) |
Moderate |
High (500–900) |
High (6.5–6.7) |
70 |
|
0.60 |
High (85–92) |
High |
Moderate (250–450) |
High (5.5–6.0) |
78–82 |
|
0.65 |
High (82–90) |
High |
Moderate |
High |
Maximum |
|
0.80 |
Moderate (40–70) |
Very High |
Low (130–200) |
Low (3.2–3.8) |
44–55 |
Note: Recommended Design Range: Porosity ≈ 0.60–0.65.
The authors are grateful to the College of Mechanical Engineering, University Technology – Iraq for providing the facilities and computational resources for this study. The authors are also grateful to Al-Mustaqbal University College, Hillah, Babylon, Iraq, Department of Chemical Engineering and Petroleum Industries for their support and cooperation. This research did not receive any external funding.
Yasmeen H. Abed: Conceptualization, Methodology, Writing – Original Draft, Visualization. Jinan Mahdi Hadi: Methodology, Software, Validation, Formal Analysis. Qahtan A. Al-Nakeeb: Investigation, Resources, Data Curation, Writing – Review & Editing. Ahmed Hikmet Jassim: Software, Validation, Formal Analysis, Visualization. Muna S. Kassim: Investigation, Resources, Writing – Review & Editing. Hasan Shakir Majdi: Supervision, Project Administration, Writing – Review & Editing, Funding Acquisition.
The authors declare that there are no known conflicts of interest associated with this publication and there has been no significant financial support for this work that could have influenced its outcome.
The data presented in this study are available upon reasonable request from the corresponding author. The CFD simulation results, including mesh files, boundary condition settings, and post-processing data, were generated using ANSYS Fluent and are available from the corresponding author on reasonable request.
The authors used language-editing tools to enhance the clarity and readability of the English language during the preparation of this manuscript. The full scientific content, research methodology, data analysis, CFD simulations and conclusions are solely the responsibility of the authors. The main technical parts of this paper, the creation of data and the core research content were not generated using AI tools. This publication is the sole responsibility of the authors.
There are no supplementary data files for this study. All numerical results, boundary conditions, mesh statistics and governing equations are presented in full in the main manuscript. The whole CFD simulation data set (mesh files, ANSYS Fluent case, data files and post-processed results) can be obtained on request from the corresponding author (Yasmeen H. Abed; 20060@uotechnology.edu.iq) on reasonable basis.
|
ρ |
Fluid density, kg·m⁻³ |
|
$\underset{u}{\mathop{\to }}\,$ |
Velocity vector, m·s⁻¹ |
|
p |
Static pressure, Pa |
|
μ |
Dynamic viscosity, kg·m⁻¹·s⁻¹ |
|
Sm |
Momentum source term, N·m⁻³ |
|
K |
Permeability of porous medium, m² |
|
C₂ |
Inertial resistance factor, m⁻¹ |
|
T |
Temperature, K |
|
Cp |
Specific heat capacity, J·kg⁻¹·K⁻¹ |
|
keff |
Effective thermal conductivity, W·m⁻¹·K⁻¹ |
|
Sh |
Volumetric heat source term, W·m⁻³ |
|
Ys |
Smoke mass fraction |
|
Deff |
Effective diffusion coefficient, m²·s⁻¹ |
|
Ss |
Species source term, kg·m⁻³·s⁻¹ |
|
ε |
Porosity |
|
Vf |
Fluid volume, m³ |
|
Vt |
Total porous volume, m³ |
|
ΔP |
Pressure drop, Pa |
|
ηh |
Heat-absorption efficiency, % |
|
ηs |
Smoke-removal efficiency, % |
[1] Abbas, A., Shafqat, R., Jeelani, M.B., Alharthi, N.H. (2022). Convective heat and mass transfer in third-grade fluid with darcy–forchheimer relation in the presence of thermal-diffusion and diffusion-thermo effects over an exponentially inclined stretching sheet surrounded by a porous medium: A CFD study. Processes, 10(4): 776. https://doi.org/10.3390/pr10040776
[2] Al-Gaheeshi, A.M.R., Rashid, F.L., Al-Obaidi, M.A., Hammoodi, K.A., Agyekum, E.B. (2024). CFD modelling of Darcian flow of water in porous media: Effects of sand grain size. International Journal of Thermofluids, 24: 100990. https://doi.org/10.1016/j.ijft.2024.100990
[3] Elrahmani, A., Al-Raoush, R.I., Seers, T.D. (2023). Clogging and permeability reduction dynamics in porous media: A numerical simulation study. Powder Technology, 427: 118736. https://doi.org/10.1016/j.powtec.2023.118736
[4] Xiong, H., Zhang, Z.M., Yin, Z.Y., Chen, X.S., Zhou, W.H. (2024). Microscopic origins of shape effects on migration and clogging of fines in porous media using coupled CFD-iDEM. Acta Geotechnica, 19(8): 5001-5029. https://doi.org/10.1007/s11440-024-02281-4
[5] Simonov, O.A., Erina, Y.Y., Ponomarev, A.A. (2023). Review of modern models of porous media for numerical simulation of fluid flows. Heliyon, 9(12): e22292. https://doi.org/10.1016/j.heliyon.2023.e22292
[6] Moghadasi, H., Bayat, M., Aminian, E., Hattel, J.H., Bodaghi, M. (2022). A computational fluid dynamics study of laminar forced convection improvement of a non-newtonian hybrid nanofluid within an annular pipe in porous media. Energies, 15(21): 8207. https://doi.org/10.3390/en15218207
[7] Sivasankaran, S., Bhuvaneswari, M. (2022). Numerical study on influence of water based hybrid nanofluid and porous media on heat transfer and pressure loss. Case Studies in Thermal Engineering, 34: 102022. https://doi.org/10.1016/j.csite.2022.102022
[8] Yang, D.Z., Ahmad, S., Ali, K., et al. (2024). CFD analysis of paraffin-based hybrid (Co–Au) and trihybrid (Co–Au–ZrO2) nanofluid flow through a porous medium. Nanotechnology Reviews, 13(1): 20240024. https://doi.org/10.1515/ntrev-2024-0024
[9] Ranjbarzadeh, R., Sappa, G. (2025). Numerical and experimental study of fluid flow and heat transfer in porous media: A review article. Energies, 18(4): 976. https://doi.org/10.3390/en18040976
[10] Elrahmani, A., Al-Raoush, R.I., Abugazia, H., Seers, T. (2022). Pore-scale simulation of fine particles migration in porous media using coupled CFD-DEM. Powder Technology, 398: 117130. https://doi.org/10.1016/j.powtec.2022.117130
[11] Rahif, R., Attia, S. (2023). CFD assessment of car park ventilation system in case of fire event. Applied Sciences, 13(18): 10190. https://doi.org/10.3390/app131810190
[12] Stan, C., Năstase, I., Bode, F., Calotă, R. (2024). Smoke and hot gas removal in underground parking through computational fluid dynamics: A state of the art and future challenges. Fire, 7(11): 375. https://doi.org/10.3390/fire7110375
[13] Shybetsky, V., Korobiichuk, I., Kalinina, M., Nowicki, M., Shopova, Z., Khyzhna, D. (2025). Classification and comparative analysis of acoustic agglomeration systems for fine particle removal. Applied System Innovation, 8(4): 116. https://doi.org/10.3390/asi8040116
[14] Armand, P., Tache, J. (2025). 3D modelling and simulation of thermal effects and dispersion of particles carrying infectious respiratory agents in a railway transport coach. Scientific Reports, 15: 2202. https://doi.org/10.1038/s41598-024-84411-2
[15] Benam, K.H. (2024). Multidisciplinary approaches in electronic nicotine delivery systems pulmonary toxicology: Emergence of living and non-living bioinspired engineered systems. Communications Engineering, 3(1): 123. https://doi.org/10.1038/s44172-024-00276-3
[16] Du, S.M., Wen, Z.Y., Yu, J.H., Meng, Y.Y., Liu, Y.L., Xia, X.J. (2024). Breath and beyond: Advances in nanomedicine for oral and intranasal aerosol drug delivery. Pharmaceuticals 17(12): 1742. https://doi.org/10.3390/ph17121742
[17] Hamann, L., Foat, T., Blanke, A. (2025). The diversity of biological models for bio-inspired aerosol filters. Journal of the Royal Society Interface, 22(227): 20250221. https://doi.org/10.1098/rsif.2025.0221
[18] Lachowicz, J.I., Milia, S., Jaremko, M., et al. (2022). Cooking particulate matter: A systematic review on nanoparticle exposure in the indoor cooking environment. Atmosphere, 14(1): 12. https://doi.org/10.3390/atmos14010012
[19] Sosnowski, T.R. (2024). Towards more precise targeting of inhaled aerosols to different areas of the respiratory system. Pharmaceutics, 16(1): 97. https://doi.org/10.3390/pharmaceutics16010097
[20] Al-Yaari, A., Ching, D.L.C., Sakidin, H., et al. (2024). The effects of nanofluid thermophysical properties on enhanced oil recovery in a heterogenous porous media. Case Studies in Chemical and Environmental Engineering, 9: 100556. https://doi.org/10.1016/j.cscee.2023.100556
[21] Feng, Z.H., Zhang, J.L., Gu, J.C., Leng, X.Y., He, Z.X., Nishida, K. (2025). Improving biodiesel atomization performance in CI engines: A review of spray behavior, droplet impingement, and advanced techniques. Processes, 13(8): 2527. https://doi.org/10.3390/pr13082527
[22] Gorain, S., Pandey, R., Kumar, A. (2025). A systematic review of the diesel particulate matter composition, health risks, measurement and mitigation techniques in underground mines. Journal of Industrial Safety, 2(4): 250-269. https://doi.org/10.1016/j.jinse.2025.10.001
[23] Marcato, A., Boccardo, G., Marchisio, D. (2022). From computational fluid dynamics to structure interpretation via neural networks: An application to flow and transport in porous media. Industrial & Engineering Chemistry Research, 61(24): 8530-8541. https://doi.org/10.1021/acs.iecr.1c04760
[24] Otaru, A.J., Alhulaybi, Z.A., Owoseni, T.A. (2023). On the hydrodynamics of macroporous structures: Experimental, CFD and artificial neural network analysis. Chemical Engineering Journal Advances, 16: 100545. https://doi.org/10.1016/j.ceja.2023.100545
[25] Săftoiu, G.V., Constantin, C., Nicoară, A.I., Pelin, G., Ficai, D., Ficai, A. (2024). Glass fibre-reinforced composite materials used in the aeronautical transport sector: A critical circular economy point of view. Sustainability, 16(11): 4632. https://doi.org/10.3390/su16114632