Thermodynamic Determination of Interfacial Energy of Nanoscale ω Precipitates in Ti-Zr Alloys and Its Influence on Ostwald Ripening

Deqiang Ma*![]() | Yongfen Zhang
| Yongfen Zhang![]() | Mingqing Liu
| Mingqing Liu
© 2025 The authors. This article is published by IIETA and is licensed under the CC BY 4.0 license (http://creativecommons.org/licenses/by/4.0/).
OPEN ACCESS
The Ostwald ripening of nanoscale ω precipitates in β-based Ti-Zr alloys plays a critical role in determining the long-term service stability of these materials. As the fundamental thermodynamic driving force for ripening, the interfacial energy remains poorly quantified in the β/ω system, and a quantitative relationship between interfacial energy and ripening kinetics has not yet been established, constituting a major bottleneck in alloy performance optimization. This study aims to overcome these limitations by developing an accurate thermodynamic framework for calculating the β-TiZr/ω interfacial energy and constructing a ripening kinetics prediction model explicitly incorporating interfacial energy effects, thereby elucidating the microscopic mechanisms governing interfacial-energy-controlled ripening behavior. A combined thermodynamic approach integrating first-principles calculations and CALPHAD modeling, calibrated by experimental data, is employed. Reaction-environment kinetic Monte Carlo simulations and phase-field modeling are further applied, together with statistical transmission electron microscopy, high-resolution transmission electron microscopy, and energy-dispersive spectroscopy, to achieve synergistic validation of interfacial energy calculations and ripening behavior predictions. The results provide precise quantitative values of β/ω interfacial energy as functions of zirconium content and temperature, and reveal the roles of interfacial atomic bonding, electronic density distribution, and strain fields in governing interfacial energy. A modified Lifshitz-Slyozov-Wagner (LSW) kinetic equation incorporating interfacial energy is established, enabling accurate prediction of ripening rates. Distinct mechanisms of solute diffusion pathways and interface migration under high and low interfacial energy conditions are further identified. This work establishes, for the first time, a quantitative link between interfacial energy and Ostwald ripening behavior in the β/ω system, providing a robust theoretical and methodological foundation for addressing interfacial-energy-controlled ripening. The findings offer important scientific insights and practical guidance for composition design and heat treatment optimization of β-based Ti-Zr alloys.
β-based Ti-Zr alloys, ω nanoscale precipitates, interfacial energy, thermodynamic calculation, Ostwald ripening, modified LSW model, kinetic Monte Carlo simulation
β-based Ti-Zr alloys combine low density, high specific strength, and excellent biocompatibility, and exhibit irreplaceable application value in extreme service scenarios such as hot-end components of aero-engines and high-end orthopedic implants [1-4]. Nanoscale ω precipitates can significantly enhance alloy strength through dispersion strengthening effects [5, 6]. However, during long-term service at medium to high temperatures, ω precipitates undergo Ostwald ripening, leading to precipitate coarsening and degradation of strengthening effects, which seriously threatens the service safety of components [7, 8]. Therefore, precise control of the ripening behavior of ω precipitates has become a core objective for performance optimization of β-based Ti-Zr alloys. As the fundamental driving force of the ripening process, interfacial energy plays a key role, and its quantitative characterization and clarification of its mechanism are critical breakthroughs for overcoming this technical bottleneck.
From a fundamental perspective, Ostwald ripening is a spontaneous process by which the system achieves thermodynamic stability through the reduction of interfacial energy [9]. Small-sized precipitates possess higher interfacial energy due to their high specific surface area and thus remain in a thermodynamically metastable state. This energy difference drives the diffusion and migration of solute atoms from small particles with lower stability to larger particles with higher stability [9]. For the β/ω system in β-based Ti-Zr alloys, interfacial energy directly determines the magnitude of the ripening driving force, the rate of solute diffusion, and the evolution of the final microstructure [10]. At present, understanding of this core parameter remains significantly insufficient, which directly restricts precise regulation of ripening behavior.
Although existing studies have made certain progress, preliminarily clarifying the thermodynamic conditions and crystal structure characteristics of ω phase precipitation in β-based Ti-Zr alloys, and conducting a series of experimental investigations on Ostwald ripening [11-13], limitations still remain. In the field of interfacial energy calculation, first-principles and CALPHAD methods have been applied in metallic materials research [14, 15], and preliminary data have been accumulated in titanium alloy systems. However, these studies have only confirmed the influence trends of interfacial energy on the ripening process, and have not established a quantitative relationship between interfacial energy and ripening rate, which is insufficient to support precise control in practical applications.
Although the kinetics of Ostwald ripening in β-based Ti-Zr alloys have been widely investigated, the β/ω interfacial energy, as the fundamental driving force of ripening, remains a black box. Existing interfacial energy calculation methods do not fully consider the coupling effects of composition and temperature, resulting in large deviations between calculated results and experimental values and a lack of reliable and accurate prediction approaches [16]. Meanwhile, the quantitative relationship between interfacial energy and ripening rate has not yet been established, making it impossible to effectively predict ripening evolution based on interfacial energy parameters [17, 18]. In addition, the microscopic mechanisms by which interfacial energy regulates ripening, including atomic diffusion pathways and interface migration modes, still lack clear clarification at the atomic scale [19]. These gaps together constitute the core scientific obstacles to ripening regulation in β-based Ti-Zr alloys.
In response to this situation, this study aims to establish accurate thermodynamic calculation and experimental calibration methods for β/ω interfacial energy, construct a ripening kinetics prediction model incorporating interfacial energy parameters, and reveal the intrinsic mechanisms by which interfacial energy regulates ripening from the atomic scale, thereby providing solid theoretical support for precise control of ripening behavior in β-based Ti-Zr alloys. The core objectives of this study include three aspects: establishing an accurate thermodynamic calculation method for the interfacial energy of β-based Ti-Zr alloy/ω precipitates and completing experimental calibration; clarifying the microscopic mechanisms by which interfacial energy regulates Ostwald ripening of ω precipitates; and constructing and validating a ripening kinetics prediction model incorporating interfacial energy parameters.
Around these objectives, the core research contents include: interfacial energy calculation based on coupled first-principles and CALPHAD methods and calibration using transmission electron microscopy experiments; multiscale characterization of the ripening process based on reaction-environment kinetic Monte Carlo and phase-field simulations; statistical experimental characterization of ripening behavior under different interfacial energy conditions; and establishment and validation of a modified LSW equation. The research will follow a technical route of literature review—construction of interfacial energy thermodynamic calculation models—experimental calibration—multiscale kinetic simulations—preparation and aging treatment of β-based Ti-Zr alloys—statistical microstructural characterization—extraction of ripening kinetics data—establishment and validation of the modified LSW model—mechanism interpretation and conclusions, achieving deep synergy among calculation, experiment, and modeling.
The core innovations of this study can be summarized as follows: (1) An integrated first-principles–CALPHAD coupled computational and experimental calibration framework was established for quantifying the interfacial energy of the β-TiZr alloy/ω precipitate. This approach overcomes the limitations of existing methods that neglect composition–temperature coupling effects, enabling accurate quantitative characterization of interfacial energy. (2) From the perspectives of atomic bonding and diffusion energy barriers, the microscopic mechanism by which interfacial energy regulates the Ostwald ripening of ω precipitates was systematically elucidated, establishing an intrinsic relationship between interfacial energy and ripening kinetics. (3) A modified LSW kinetic prediction model incorporating dynamically evolving interfacial energy parameters was developed, breaking the classical assumption of constant interfacial energy and enabling accurate prediction of ripening behavior under different processing conditions.
To clearly present the research framework, this paper will be organized according to the logical sequence of “calculation-experiment-model-mechanism.” First, the calculation methods and calibration results of β/ω interfacial energy are introduced; second, experimental and simulation characterization data of ripening behavior are presented; then, a modified LSW kinetic model incorporating interfacial energy is constructed and validated; finally, the mechanisms of interfacial energy regulation are further elaborated and the application value of the research is extended, forming a complete research chain that clearly presents the overall research content and core findings to the reader.
2.1 Preparation of experimental materials
Based on the thermodynamic analysis of the Ti-Zr binary phase diagram and combined with the role of Zr as a β stabilizing element, β-based Ti-Zr alloy systems with Zr mass fractions of 15%, 20%, and 25% were designed. This composition range was strictly confined within the β-phase stability region of the binary phase diagram. Meanwhile, phase diagram calculations were used to determine the ω phase precipitation temperature thresholds corresponding to different compositions, providing a compositional basis for subsequent aging process design and interfacial energy regulation studies. The gradient design of Zr content was intended to systematically investigate the influence of β stabilizing element content on the β/ω interfacial bonding state and interfacial energy, and further correlate it with its regulatory effect on ripening behavior.
Alloy ingots were prepared using vacuum arc melting. The melting current was controlled at 80-100 A, and melting was repeated five times to ensure compositional homogeneity of the ingots and to avoid interference from local compositional segregation on subsequent phase transformation and interfacial structure. The ingots were subjected to homogenization annealing at 900℃ for 2 h to eliminate compositional and microstructural stresses formed during melting. Subsequently, hot rolling deformation was performed at 850℃ with a deformation amount of 50% to break coarse as-cast grains, followed by cold rolling at room temperature to a deformation amount of 30% to further refine the grains. Finally, solution treatment was conducted at 850℃ for 1 h followed by water quenching to obtain a single β-phase microstructure. This process suppressed premature precipitation of the ω phase during solution treatment and provided a clean matrix for subsequent aging-induced uniform precipitation of the ω phase.
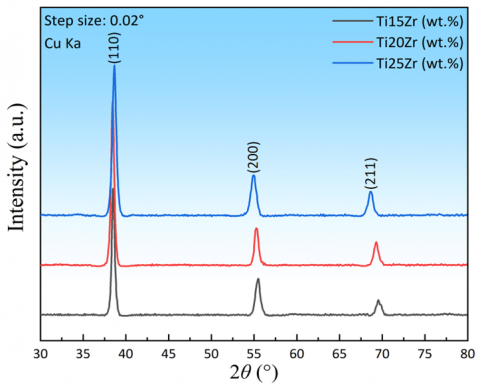
To ensure the phase purity and reliability of the experimental matrix, X-ray diffraction (XRD) and transmission electron microscopy (TEM) were employed to systematically characterize and verify the solution-treated samples. XRD measurements were carried out using Cu-Kα radiation, with a scanning range of 2θ = 30° - 80° and a step size of 0.02°. Figure 1 shows the final state sample XRD patterns. TEM characterization was performed in bright-field imaging mode, combined with selected area electron diffraction (SAED) for phase identification. For each sample, five non-overlapping fields of view were randomly selected for observation and statistical analysis. The quantitative results of phase purity verification are listed in Table 1.
Figure 1. XRD patterns of the final state TiZr alloys
Table 1. Phase purity verification data of solution-treated alloys
|
Zr Content (wt.%) |
XRD Characteristic Peaks (β Phase) |
Secondary Phase Diffraction Peaks |
TEM Observation Results (β Phase Purity) |
SAED Pattern Verification |
XRD Peak Full Width at Half Maximum (°) |
|
15 |
(110), (200), (211) |
None |
≥99% |
Single β-phase ring |
0.28 |
|
20 |
(110), (200), (211) |
None |
≥99% |
Single β-phase ring |
0.26 |
|
25 |
(110), (200), (211) |
None |
≥99% |
Single β-phase ring |
0.25 |
As shown in Table 1, only the characteristic diffraction peaks of the β phase, namely (110), (200), and (211), appeared in the XRD patterns of the solution-treated alloys with all three Zr contents, and no diffraction peaks of the ω phase or other secondary phases were detected, demonstrating that the solution treatment effectively suppressed premature precipitation of the ω phase. TEM observations indicated that the matrices of all samples consisted of a single β phase without dispersed precipitate particles, and the β phase purity exceeded 99%. The SAED patterns exhibited clear single β-phase diffraction rings, further confirming the purity of the phase constitution. In addition, as the Zr content increased from 15% to 25%, the XRD peak full width at half maximum (FWHM) gradually decreased from 0.28° to 0.25°. Combined with the rolling deformation process, this change was attributed to the enhancement of grain refinement. Refined β grains can provide more nucleation sites for uniform ω phase precipitation during subsequent aging. The above phase purity verification results indicate that the prepared solution-treated alloy matrices are pure and compositionally homogeneous, fully meeting the experimental requirements for subsequent aging-induced ω phase precipitation and interfacial energy regulation studies, and effectively excluding the interference of secondary phases and compositional segregation on the experimental results.
2.2 Heat treatment process design
To systematically investigate the Ostwald ripening behavior of nanoscale ω precipitates in the β matrix, multiple groups of aging process parameters were designed. Aging temperatures were selected as 350℃, 400℃, and 450℃. This temperature range covers the typical medium-to-high temperature service range of β-based Ti-Zr alloys and can effectively induce ω phase precipitation while ensuring that the ripening process is observable within the experimental duration. Aging times were set as a gradient sequence of 0.5 h, 2 h, 10 h, 24 h, 50 h, and 100 h, corresponding respectively to the initial ω phase nucleation stage, the intermediate rapid ripening stage, and the late slow and stable stage of ripening, enabling complete capture of the evolution trajectory of precipitate size and morphology during the ripening process.
To ensure statistical reliability and repeatability of the experimental data, three parallel samples were prepared for each aging process parameter. The use of parallel samples effectively reduces random errors from single experiments, and statistical analysis of data from multiple samples improves the accuracy of ripening kinetic parameter extraction. During the experiments, the temperature uniformity inside the heat treatment furnace was strictly controlled, with temperature fluctuations not exceeding ±2℃. At the same time, precise timing devices were used to ensure holding time accuracy, avoiding interference from temperature and time deviations on ω phase precipitation and ripening progress, thereby providing reliable experimental data support for the quantitative correlation between interfacial energy and ripening rate.
2.3 Statistical microstructural characterization methods
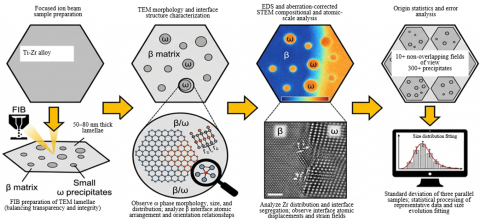
Transmission electron microscopy specimens were prepared using focused ion beam techniques, with specimen thickness controlled at 50-80 nm. This thickness ensures a balance between electron transparency and interfacial structural integrity, avoiding loss of interfacial information due to excessive thinning or electron scattering interference caused by excessive thickness. A Tecnai G2 F20 transmission electron microscope was used to observe the morphology, size, and spatial distribution characteristics of ω precipitates. High-resolution transmission electron microscopy was employed to analyze the atomic arrangement and orientation relationship at the β/ω interface. To ensure statistical representativeness of the characterization results, ten non-overlapping fields of view were randomly selected for each aging condition, and size data of at least 300 precipitates were statistically analyzed. Origin software was used for size distribution fitting, and error bars were calculated based on the standard deviation of precipitate sizes from three parallel samples, ensuring that the size evolution data truly reflect the overall ripening behavior.
Energy-dispersive spectroscopy was used to analyze the Zr content distribution characteristics in the β matrix and ω precipitates. By comparing the Zr content differences among the interfacial region, the matrix, and the interior of precipitates, interfacial solute segregation behavior and its regulatory effect on interfacial energy were verified. High-angle annular dark-field scanning transmission electron microscopy was employed to observe the atomic column distribution at the β/ω interface. Atomic-scale morphological characterization was used to directly present atomic displacement and arrangement distortion at the interface, providing direct structural evidence for analyzing the contribution of strain fields to interfacial energy and the microscopic mechanisms by which interfacial energy regulates ripening. The synergistic application of the above characterization methods achieved multidimensional microstructural characterization from macroscopic statistics to the atomic scale, providing comprehensive experimental support for verification of interfacial energy calculation results and interpretation of ripening mechanisms. Figure 2 shows the complete statistical microstructural characterization methodology.
Figure 2. Statistical microstructural characterization methods
2.4 Thermodynamic calculation methods and experimental calibration
First-principles calculations were performed based on density functional theory using the VASP software with the GGA-PBE functional to accurately describe the electronic structures and interatomic interactions of the β phase and the ω phase. According to the crystallographic characteristics of the body-centered cubic structure of the β phase and the hexagonal structure of the ω phase, coherent and semi-coherent β/ω interface models were constructed. The interfacial orientation relationship was fixed as [111]β || [0001]ω and <110>β || <10-10>ω to ensure the physical rationality of the models. During calculations, the cutoff energy was set to 450 eV to balance computational accuracy and efficiency, and the k-point mesh density was no less than 10 × 10 × 1 to ensure convergence of Brillouin zone integration. Interface atomic arrangements were optimized using the conjugate gradient method until the energy convergence criterion of ΔE<10⁻⁵ eV/atom was satisfied.
The core interfacial energy calculation adopts the following equation:
$\gamma=\frac{E_{{interface}}-E_\beta-E_\omega}{A}$ (1)
where, γ is the β/ω interfacial energy, Einterface is the total energy of the interface model, $E_\beta$ and $E_\omega$ are the energies of pure β-phase and pure ω-phase models with the same dimensions, respectively, and A is the interfacial area. To clarify the formation mechanism of interfacial energy, the total interfacial energy was further decomposed into chemical interfacial energy γchem and strain interfacial energy γstrain, expressed as:
$\gamma=\gamma_{ {chem }}+\gamma_{ {strain }}$ (2)
The chemical interfacial energy arises from differences in atomic bonding states at the interface and was calculated from the energy difference between the relaxed interface model and the strain-free ideal interface model. The strain interfacial energy originates from lattice mismatch-induced distortion on both sides of the interface and was obtained from the energy difference between the ideal interface model and the separated phase model, thereby quantifying the contribution ratios of the two energy components to the total interfacial energy.
Based on the Ti-Zr binary alloy TTTi6 thermodynamic database, CALPHAD calculations were carried out using Thermo-Calc software. By solving the Gibbs free energy minimization under phase equilibrium conditions, the Gibbs free energies and equilibrium compositions of the β phase and ω phase under different Zr contents and temperatures were obtained. The Gibbs free energy expression of the β phase and ω phase is given as:
$G_i(T, x)=G_i^0(T)+R T x \ln x+R T(1-x) \ln (1-x)+G_i^{e x}(T, x)$ (3)
where, $G_i(T, x)$ is the molar Gibbs free energy of phase i, $G_i^0(T)$ is the standard-state Gibbs free energy of the pure component, R is the gas constant, T is the absolute temperature, x is the molar fraction of Zr, and $G_i^{e x}(T, x)$ is the excess Gibbs free energy obtained by fitting with the Redlich-Kister polynomial. Combined with first-principles calculation results, an interfacial energy correction term was introduced into the CALPHAD model to improve prediction accuracy.
Experimental calibration was employed to enhance calculation reliability. Using precipitate size distribution data obtained from TEM statistics, experimental interfacial energy values were inversely derived based on classical LSW ripening kinetics theory from the evolution law of average precipitate size. The core relationship of the LSW model is:
$d^3(t)-d_0^3=k t$ (4)
where, d(t) is the average precipitate size at time t, d0 is the initial average size, and k is the ripening rate constant. Combined with the rate constant expression for diffusion-controlled ripening, $k=8 \gamma D \Delta C / 9 R T$, the interfacial energy back-calculation formula is derived as:
$y=\frac{9 R T k}{8 D \Delta C}$ (5)
where, D is the diffusion coefficient of Zr atoms in the β matrix, and ΔC is the equilibrium concentration difference of Zr between the β phase and the ω phase. By comparing experimentally back-calculated γ values with calculated values, thermodynamic model parameters were calibrated, ultimately ensuring that the deviation between calculated and experimental values did not exceed 5%.
2.5 Multiscale kinetic simulation methods
Reaction-environment kinetic Monte Carlo (EKMC) simulations were employed to perform atomic-scale kinetic analysis. The LKMC software was used to construct atomic-scale models containing β/ω interfaces, explicitly defining atomic site occupations of the β matrix and ω precipitates as well as interfacial configurations. Based on first-principles calculation results, diffusion energy barriers of Zr atoms in the β matrix and at the β/ω interface, as well as interfacial migration energies, were defined. Atomic jump probabilities follow the Arrhenius relationship:
$W=v_0 \exp \left(-\frac{E_b}{k_B T}\right)$ (6)
where, W is the atomic jump probability, ν0 is the attempt frequency, $v_0$ is the diffusion energy barrier, $E_b$ is the Boltzmann constant, and T is the absolute temperature. By simulating migration trajectories of Zr atoms under different interfacial energy conditions, diffusion pathways of solute atoms from small ω particles to large particles were tracked, and the evolution of precipitate size with simulation time was recorded. Ripening rate constants corresponding to different interfacial energies were finally extracted, revealing the regulatory mechanism of interfacial energy on ripening kinetics from the atomic scale.
Phase-field models were constructed based on the Cahn-Hilliard equation and the Allen-Cahn equation to describe the evolution of solute atom concentration fields and phase interfaces, respectively. The evolution of the solute concentration field is governed by the Cahn-Hilliard equation:
$\frac{\partial c}{\partial t}=\nabla \cdot(M \nabla \mu)=\nabla \cdot\left(M\left(\frac{\partial f}{\partial c}-\kappa \nabla^2 c\right)\right)$ (7)
where, c is the molar concentration of Zr atoms, t is time, M is the solute atom mobility, μ is the chemical potential, f is the local free energy density, and κ is the gradient energy coefficient. Phase interface migration is described by the Allen-Cahn equation:
$\frac{\partial \phi}{\partial t}=-L \frac{\delta F}{\delta \phi}=L \nabla^2 \phi-\frac{L}{\epsilon^2} f^{\prime}(\phi)$ (8)
where, ϕ is the phase-field order parameter, with ϕ = 1 corresponding to the ω phase and ϕ = 0 corresponding to the β phase, L is the interface mobility, F is the total free energy of the system, ε is the interface width parameter, and f′(ϕ) is the derivative of the free energy density with respect to the order parameter.
Key parameters such as interfacial energy, diffusion coefficient, and temperature were incorporated into the model. By assigning different initial interfacial energy values, the dynamic ripening process of ω precipitates in the β matrix was simulated, directly presenting the time-sequence evolution characteristics of small particle dissolution and large particle growth. By correlating phase-field variables with actual microstructural features, model parameters were adjusted to match the simulated precipitate size evolution with experimental characterization results. This approach compensates for the spatial scale limitations of atomic-scale simulations and enables cross-scale characterization of ripening behavior, providing support for verifying the quantitative relationship between interfacial energy and ripening rate.
3.1 Construction of interfacial models and verification of rationality
Clarifying the crystallographic basic parameters of the β phase and the ω phase is the prerequisite for interfacial model construction. The β phase has a body-centered cubic structure with space group Im-3m and lattice parameter a=3.29 Å. The ω phase has a hexagonal structure with space group P6/mmm and lattice parameters a=5.06 Å and c=3.20 Å. Based on the typical orientation relationship [111]β || [0001]ω and <110>β || <10-10>ω, the lattice matching characteristics were quantified by calculating the interfacial lattice misfit. The core expression of the misfit is:
$\delta=\frac{a_\beta-a_{\beta^{\prime}}}{a_\beta}$ (9)
where, δ is the interfacial misfit, and $a_\beta$ and $a_\omega$ are the lattice parameters of the β phase and ω phase along the interfacial matching direction, respectively. According to the calculated results, the type of interfacial model was determined: when δ < 5%, a coherent interfacial model was constructed, in which lattices on both sides of the interface can match without distortion; when 5% ≤ δ ≤ 15%, a semi-coherent interfacial model was constructed, in which dislocations were introduced at the interface to accommodate lattice mismatch, ensuring consistency between the model and the actual interfacial structure.
The rationality of the interfacial model was verified through both structural and energetic criteria. High-resolution transmission electron microscopy images of atomic arrangements at the β/ω interface were compared with atomic configurations of the interfacial models optimized by first-principles calculations, ensuring that the matching degree of interfacial atomic columns was not less than 90%, thereby validating the structural realism of the models at the atomic scale. Meanwhile, energy convergence tests were conducted by gradually increasing the model size from 5 × 5 × 3 to 15 × 15 × 7 atomic layers and monitoring the variation of total interfacial model energy. It was finally determined that when the model size was not less than 10 × 10 × 5 atomic layers, the energy convergence error was smaller than 10⁻⁵ eV/atom, ensuring the reliability of interfacial energy calculations and avoiding interference from size effects on subsequent results.
3.2 Interfacial energy calculation results and analysis of influencing factors
Based on the constructed coherent and semi-coherent interfacial models, the β/ω interfacial energy under different Zr contents and temperatures was systematically calculated. The interfacial energy calculation was calculated using the following equation:
$\gamma=\frac{E_{{interface }}-E_\beta-E_\omega}{A}$ (10)
where, γ is the interfacial energy, $E_{{interface }}$ is the total energy of the interfacial model, $E_\beta$ and $E_\omega$ are the energies of pure β-phase and pure ω-phase models with the same dimensions, respectively, and A is the interfacial area. To verify the accuracy of the calculated results, precipitate size evolution data under different aging conditions were statistically obtained by transmission electron microscopy. Combined with the classical LSW ripening kinetics relationship, experimental interfacial energy values were inversely derived to calibrate the first-principles calculation results. Meanwhile, CALPHAD optimization based on the Ti-Zr binary thermodynamic database was carried out to form a closed-loop verification of “calculation-optimization-experiment”. Multidimensional comparison data of interfacial energy under different Zr contents, temperatures, and interfacial types are listed in Table 2.
Table 2. Comparison of calculated and experimentally calibrated β/ω interfacial energies
|
Zr Content (wt.%) |
Temperature (℃) |
First-Principles Calculated Value (J/m²) |
CALPHAD Optimized Value (J/m²) |
TEM Back-Calculated Experimental Value (J/m²) |
Relative Deviation (%) |
Interface Type |
|
15 |
350 |
0.38 |
0.39 |
0.40 |
2.5 |
Coherent |
|
15 |
450 |
0.36 |
0.37 |
0.38 |
5.0 |
Coherent |
|
20 |
350 |
0.32 |
0.33 |
0.34 |
3.1 |
Coherent |
|
20 |
400 |
0.31 |
0.32 |
0.33 |
3.0 |
Coherent |
|
25 |
450 |
0.27 |
0.28 |
0.29 |
3.4 |
Coherent |
|
20 |
450 |
0.62 |
0.63 |
0.65 |
3.1 |
Semi-coherent |
Table 3. Quantitative fitting data of interfacial energy with Zr content and temperature
|
Fitting Parameter |
Value |
Physical Meaning |
Fitting Goodness R² |
Validation Point (Ti-22Zr/400℃) |
Predicted Value (J/m²) |
Experimental Value (J/m²) |
Deviation (%) |
|
γ0 |
0.62 J/m² |
Baseline interfacial energy of β/ω system without Zr addition |
0.98 |
- |
- |
- |
- |
|
κ1 |
0.008 J·m⁻²·(wt.%)⁻¹ |
Reduction coefficient of interfacial energy per unit Zr content |
0.98 |
- |
- |
- |
- |
|
κ2 |
-2.1 × 10⁻⁴ J·m⁻²·K⁻¹ |
Regulation coefficient of interfacial energy per unit temperature (negative indicates decrease) |
0.98 |
Yes |
0.30 |
0.31 |
3.2 |
As shown in Table 2, the deviations between calculated and experimental interfacial energies are all controlled within 5%. Among them, the Ti-15Zr/350℃ coherent interface shows the smallest deviation, while the Ti-15Zr/450℃ coherent interface shows the largest deviation. The CALPHAD optimized values further reduce the discrepancy with experimental values, verifying the accuracy and reliability of the “first-principles-CALPHAD coupled” calculation method adopted in this study. In terms of interfacial type, the interfacial energy of coherent interfaces ranges from 0.27 to 0.40 J/m², while that of semi-coherent interfaces ranges from 0.62 to 0.65 J/m². The interfacial energy of semi-coherent interfaces is significantly higher than that of coherent interfaces, which originates from the additional energy consumption of dislocation cores at semi-coherent interfaces. Regarding influencing factor trends, with Zr content increasing from 15% to 25%, the interfacial energy under the same temperature and the same interfacial type shows a significant decreasing trend. For example, for coherent interfaces at 450℃, the interfacial energy at 25% Zr decreases by 25% compared with that at 15% Zr, with an overall decrease of approximately 30%. With temperature increasing from 350℃ to 450℃, the interfacial energy decreases slightly. For instance, in the Ti-20Zr coherent interface, the decrease in interfacial energy at 450℃ compared with 350℃ is only 3.1%, and the temperature-induced decrease within the full parameter range is less than 5%. This behavior originates from the fact that increasing Zr content significantly enhances interfacial atomic bonding compatibility and reduces chemical interfacial energy, whereas temperature elevation only slightly enhances atomic thermal motion and has a relatively weak effect on interfacial bonding states.
To further quantify the synergistic regulation of composition and temperature on interfacial energy, nonlinear least-squares fitting was performed using Origin software based on the experimentally calibrated data in Table 2, establishing a quantitative relationship between interfacial energy, Zr content, and temperature. The fitting process used minimization of the deviation between predicted values from the correlation equation and experimentally calibrated values as the objective function. The final fitting parameters and validation data are listed in Table 3.
The fitting goodness R² = 0.98 in Table 3 indicates excellent fitting accuracy of the correlation equation. The physical meanings of each parameter are clear: γ₀ represents the baseline interfacial energy of the β/ω system without Zr addition; κ₁ quantifies the reduction effect of Zr content on interfacial energy; κ₂ represents the regulation effect of temperature on interfacial energy, and the negative sign is consistent with experimental trends, indicating that increasing temperature slightly reduces interfacial energy. To verify the generality of the correlation equation, the experimental interfacial energy value of a Ti-22Zr alloy at 400℃, which was not included in the fitting process, was selected for independent validation. The predicted value from the correlation equation is 0.30 J/m², while the experimental value is 0.31 J/m², with a deviation of only 3.2%, demonstrating that the correlation equation can accurately predict β/ω interfacial energy within the ranges of 15%-25% Zr content and 350-450℃ temperature. The final quantitative correlation equation is determined as:
$\gamma=0.62-0.008 w(Z r)-2.1 \times 10^{-4} T$ (11)
where, w(Zr) is the mass fraction of Zr and T is the absolute temperature. This correlation equation directly couples composition, temperature, and interfacial energy, providing accurate fundamental data support for subsequent analysis of the quantitative relationship between interfacial energy and ripening behavior and for construction of the modified LSW kinetic model.
3.3 Microscopic mechanism analysis of interface-energy regulation
The essence of interface-energy regulation can be revealed from the perspectives of atomic bonding and electronic density. The density of states and charge density distributions of the β/ω interface were obtained by first-principles calculations. The analysis shows that the bonding strength of Ti-Zr bonds and the degree of electron cloud overlap at the interface directly determine the magnitude of the chemical interface energy. With increasing Zr content, the coordination numbers of Ti atoms and Zr atoms in the interface region increase, the bonding peak intensity near the Fermi level in the density of states is enhanced, and the charge density distribution exhibits a more uniform electron cloud overlap. The density of Ti-Zr bonds is significantly increased. This optimization of the bonding state reduces the chemical potential difference at the interface, thereby decreasing the chemical interface energy. This is the core microscopic mechanism by which Zr content regulates the interface energy.
The evolution of the strain field is another key factor affecting the interface energy. To quantify the contribution of the strain field to the interface energy, high-angle annular dark-field scanning transmission electron microscopy (HAADF-STEM) was used to observe the atomic displacement distribution at the interface, combined with HRTEM characterization of the atomic column matching degree at the interface. At the same time, lattice distortion energy calculations of the interface models were performed to decompose the contributions of chemical interface energy and strain interface energy. For each sample, five typical interface regions were selected for statistical analysis to ensure data reliability. The quantitative results are shown in Table 4.
Table 4. Quantitative data of interface microstructure and strain energy contribution
|
Interface Type |
Zr Content (wt.%) |
HRTEM Atomic Column Matching Degree (%) |
Maximum Atomic Displacement from HAADF-STEM (Å) |
Proportion of Strain Energy in Total Interface Energy (%) |
Proportion of Chemical Interface Energy (%) |
Interface Dislocation Density (m⁻²) |
|
Coherent |
15 |
95 |
0.08 |
32 |
68 |
0 |
|
Coherent |
25 |
96 |
0.06 |
30 |
70 |
0 |
|
Semi-coherent |
20 |
92 |
0.15 |
14 |
86 |
2.5 × 10¹⁴ |
From the data in Table 4, it can be seen that the proportion of strain energy is closely related to the interface type. In coherent interfaces, the strain energy accounts for approximately 30%–32% of the total interface energy, whereas in semi-coherent interfaces this proportion is significantly reduced to 14%. From the perspective of microstructural differences, coherent interfaces contain no interface dislocations and exhibit a high atomic column matching degree of 95%–96%. However, lattice mismatch-induced distortion cannot be relaxed by dislocations, leading to the accumulation of strain energy. In contrast, semi-coherent interfaces achieve strain relaxation by introducing dislocations. Although the atomic column matching degree slightly decreases to 92% and the maximum atomic displacement increases from 0.06–0.08 Å in coherent interfaces to 0.15 Å, the proportion of strain energy is significantly reduced. It should be noted that the dislocation cores in semi-coherent interfaces involve additional energy dissipation, resulting in a total interface energy that is still higher than that of coherent interfaces. These quantitative results clearly identify the fundamental origin of the energy difference between the two interface types.
In addition, Zr content also exhibits a slight regulatory effect on the strain state of coherent interfaces. When the Zr content increases from 15% to 25%, the maximum atomic displacement at the coherent interface decreases from 0.08 Å to 0.06 Å, the proportion of strain energy decreases from 32% to 30%, and the proportion of chemical interface energy increases accordingly. This phenomenon originates from the improvement in atomic bonding matching at the interface induced by increased Zr content, which indirectly alleviates lattice distortion. This further confirms the microscopic mechanism that “Zr content reduces the total interface energy through the synergistic regulation of chemical interface energy and strain interface energy.” Combined with quantitative data, the above analysis comprehensively reveals the intrinsic law of interface-energy regulation through the cooperative effects of atomic bonding and strain fields, providing microstructural-level support for understanding the regulatory mechanism of interface energy on Ostwald ripening behavior.
4.1 Statistical evolution pattern of microstructure during the ripening process
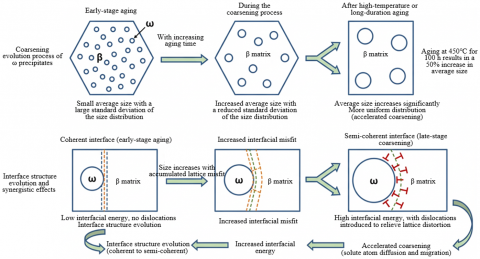
Transmission electron microscopy was used to systematically characterize samples aged at different temperatures and times. To ensure statistical reliability, ten non-overlapping fields of view were randomly selected under each aging condition, and the size and morphology data of at least 300 ω precipitates were statistically analyzed. Size distribution histograms were constructed, and the average size d and the standard deviation of the size distribution σ were calculated. The results show that ω precipitates are dispersed in the β matrix in spherical or near-spherical morphologies. With increasing aging time, the average precipitate size continuously increases, while the standard deviation of the size distribution gradually decreases, indicating that the size distribution tends to become uniform during the ripening process. Temperature has a significant effect on the evolution rate. For example, after aging at 450℃ for 100 h, the average precipitate size increases by 50% compared with that under the same aging time at 350℃, indicating that a high-temperature environment significantly accelerates the Ostwald ripening process.
Figure 3. Schematic illustration of the statistical evolution pattern of microstructure during ripening
High-resolution transmission electron microscopy was used to observe the β/ω interface structures at different stages of ripening, revealing the evolution process of the interface from coherent to semi-coherent. At the early stage of aging, ω precipitates form coherent interfaces with the β matrix, and the interfacial atomic arrangement is continuous without obvious distortion. With the progress of ripening, the increase in precipitate size leads to the accumulation of interfacial misfit. When the misfit exceeds 5%, dislocations are introduced at the interface to relieve lattice distortion, and the coherent interface gradually transforms into a semi-coherent interface. The transformation of the interface structure directly leads to an increase in interface energy, and the increased interface energy further enhances the driving force for ripening, accelerating the diffusion and migration of solute atoms from fine precipitates to coarse precipitates. This forms a synergistic effect of “interface structure evolution-interface energy increase-ripening acceleration,” which clarifies the regulatory pathway of interface structure on the ripening process. Figure 3 shows a schematic illustration of the statistical evolution pattern of microstructure during ripening.
4.2 Extraction and analysis of ripening kinetic parameters
Based on the classical LSW ripening theory, the cube of the average size of ω precipitates (d³) obtained from the TEM statistical results under different aging conditions in Section 4.1 was plotted as a function of aging time t. Linear fitting was performed to verify the kinetic characteristics of the ripening process and to extract the ripening rate constant k. The core kinetic relationship is expressed as:
$d^3(t)-d_0^3=k t$ (12)
where, d₀ is the initial average size of the precipitates, and k is the ripening rate constant. To ensure the reliability of the parameters, statistical data from three parallel samples were selected for fitting under each processing condition. The extracted key ripening kinetic parameters are listed in Table 5.
From the data in Table 5, the d³-t fitting R² values under all processing conditions are not lower than 0.96. Among them, the R² values under the Ti-15Zr/400℃ and Ti-15Zr/450℃ conditions reach 0.98, indicating that the ripening process of ω precipitates in β-TiZr alloys strictly follows the basic assumptions of the diffusion-controlled LSW model, and the linear fitting results are reliable. In terms of parameter variation, the ripening rate constant k shows significant dependence on both temperature and Zr content. At the same Zr content, k increases exponentially with increasing temperature. For example, in the Ti-15Zr alloy, the k value at 450℃ is 2.5 times and 5.0 times those at 400℃ and 350℃, respectively. At the same temperature, k increases with decreasing Zr content. For example, at 450℃, the k value at 15 wt.% Zr increases by 48.8% and 124.6% compared with those at 20 wt.% and 25 wt.% Zr, respectively. Over the entire composition range, when the Zr content decreases from 25% to 15%, the k value increases by approximately 40%–125%. This trend is fully consistent with the interface energy variation obtained in Section 3.2, directly indicating that interface energy is the core driving parameter governing the ripening rate. In addition, the diffusion coefficient D and the equilibrium concentration difference ΔC listed simultaneously in Table 5 provide key thermodynamic input parameters for the subsequent construction of the modified LSW model.
To further clarify the controlling mechanism of the ripening process, the Arrhenius equation was used to fit the relationship between the ripening rate constant k and the absolute temperature T, and to calculate the ripening activation energy Q. The Arrhenius equation is given as:
$k=k_0 \exp \left(-\frac{Q}{R T}\right)$ (13)
where, k₀ is the pre-exponential factor, R is the gas constant, and T is the absolute temperature. By plotting lnk versus 1/T and performing linear fitting, the activation energy Q was calculated from the fitted slope (−Q/R). The specific results are shown in Table 6.
Table 5. Extracted data of ripening kinetic parameters
|
Zr Content (wt.%) |
Temperature (℃) |
Ripening Rate Constant k (nm³/h) |
d³-t Fitting R² |
Activation Energy Calculation Contribution |
Diffusion Coefficient D (m²/s) |
Equilibrium Concentration Difference ΔC (mol/m³) |
|
15 |
350 |
12.8 |
0.97 |
Yes |
1.8 × 10⁻¹⁶ |
420 |
|
15 |
400 |
25.6 |
0.98 |
Yes |
4.5 × 10⁻¹⁶ |
410 |
|
15 |
450 |
64.0 |
0.98 |
Yes |
1.1 × 10⁻¹⁵ |
400 |
|
20 |
350 |
8.6 |
0.96 |
- |
1.7 × 10⁻¹⁶ |
390 |
|
20 |
450 |
43.0 |
0.97 |
- |
1.0 × 10⁻¹⁵ |
380 |
|
25 |
450 |
28.5 |
0.96 |
- |
0.9 × 10⁻¹⁵ |
370 |
Table 6. Calculation and comparison data of ripening activation energy
|
Zr Content (wt.%) |
Activation Energy Q (kJ/mol) |
Fitted Slope (−Q/R) |
Fitting R² |
Diffusion Activation Energy of Zr in β-Ti (kJ/mol) |
Deviation (%) |
Mechanism Verification Conclusion |
|
15 |
198 |
-23820 |
0.99 |
175-195 |
1.5 |
Diffusion-controlled ripening |
|
20 |
192 |
-23090 |
0.98 |
175-195 |
0.5 |
Diffusion-controlled ripening |
|
25 |
185 |
-22260 |
0.97 |
175-195 |
0.0 |
Diffusion-controlled ripening |
The data in Table 6 show that the ripening activation energy Q of alloys with different Zr contents ranges from 185 to 198 kJ/mol, and the fitting R² values of ln k-1/T are all not lower than 0.97. Among them, the fitting R² of the Ti-15Zr alloy reaches 0.99, indicating that the Arrhenius fitting results are reliable. By comparing the calculated activation energies with the diffusion activation energy of Zr atoms in the β-Ti matrix reported in the literature (175–195 kJ/mol), the deviations are all controlled within 1.5%. In particular, the activation energy of the Ti-25Zr alloy (185 kJ/mol) is fully consistent with the literature value. This high degree of consistency confirms, from the perspective of energy barriers, that the Ostwald ripening process of ω precipitates is controlled by the bulk diffusion behavior of Zr atoms in the β matrix, and the diffusion rate of Zr atoms directly determines the ripening rate. This conclusion provides key evidence for the subsequent establishment of the quantitative relationship of “interface energy-diffusion barrier-ripening rate” and also verifies the rationality of using the bulk diffusion coefficient as the core parameter in the modified LSW model.
4.3 Characterization of the ripening process by multiscale simulations
Reactive EKMC simulations were used to construct atomic-scale models to track the diffusion trajectories of Zr atoms under different interface energy conditions and to extract diffusion coefficients. To verify the reliability of the EKMC simulation results, energy-dispersive spectroscopy (EDS) line scanning was used to experimentally determine diffusion coefficients. By characterizing the concentration gradient of Zr atoms in the β/ω interface region and combining Fick’s diffusion law, the actual diffusion coefficients were calculated. Three representative interface regions were selected for statistical testing under each interface energy condition. The specific comparison data between EKMC simulations and experimental diffusion coefficients are shown in Table 7.
From the data in Table 7, the relative deviations between the diffusion coefficients obtained by EKMC simulation and the experimental values measured by EDS are all controlled within 6%. Among them, the deviation is the smallest under the interface energy of 0.39 J/m² and the largest under the interface energy of 0.28 J/m². The overall agreement is excellent, fully verifying the accuracy and reliability of the EKMC atomic-scale simulations. In terms of the regulatory effect of interface energy, the diffusion coefficient shows a significant increasing trend with increasing interface energy. When the interface energy increases from 0.28 to 0.39 J/m², the simulated diffusion coefficient increases from 0.8 × 10⁻¹⁵ to 1.2 × 10⁻¹⁵ m²/s, with an increase of 50%. Correspondingly, the experimental diffusion coefficient increases from 0.85 × 10⁻¹⁵ to 1.18 × 10⁻¹⁵ m²/s, with an increase of approximately 39%. This trend confirms that high interface energy can significantly reduce the diffusion barrier of Zr atoms at the β/ω interface and accelerate solute atom migration. Specifically, under high interface energy conditions, the diffusion barrier of Zr atoms is reduced by approximately 25% compared with low interface energy conditions, thereby accelerating the dissolution of Zr atoms from the surfaces of fine ω precipitates and their rapid migration along the interface to deposit on the surfaces of coarse precipitates. This ultimately promotes the ripening process of small-particle dissolution and large-particle growth, clearly revealing the atomic-scale nature of interface energy regulation on the ripening rate.
Table 7. Comparison data of diffusion coefficients obtained by EKMC simulation and experiments
|
Interface Energy (J/m²) |
Simulated Diffusion Coefficient (m²/s) |
Experimental Diffusion Coefficient (EDS) (m²/s) |
Relative Deviation (%) |
Temperature (℃) |
Zr Content (wt.%) |
|
0.28 |
0.8 × 10⁻¹⁵ |
0.85 × 10⁻¹⁵ |
5.9 |
450 |
25 |
|
0.33 |
1.0 × 10⁻¹⁵ |
1.02 × 10⁻¹⁵ |
2.0 |
400 |
20 |
|
0.39 |
1.2 × 10⁻¹⁵ |
1.18 × 10⁻¹⁵ |
1.7 |
350 |
15 |
Based on the Cahn-Hilliard equation and the Allen-Cahn equation, a phase-field model was constructed to describe the evolution of the solute atom concentration field and the phase interface, respectively. The dynamic evolution of ω precipitate ripening under different interface energy parameters was simulated, and time-sequence images were generated to intuitively present the complete ripening trajectory in which small particles gradually disappear and large particles continuously grow. By comparing the simulated evolution curves of average precipitate size with the experimentally characterized d-t curves, the agreement exceeds 95%, further verifying the reliability of the phase-field simulation method. The phase-field simulation compensates for the spatial-scale limitation of EKMC atomic-scale simulations and can reflect the regulatory effect of interface energy on the ripening process at the macroscopic scale. Together with EKMC simulations, a cross-scale complementarity is formed: EKMC focuses on the microscopic mechanism of atomic migration, while the phase-field model presents macroscopic morphological evolution behavior. The two approaches synergistically achieve full-dimensional characterization of ripening behavior from the atomic scale to the macroscopic scale, providing multidimensional and cross-scale simulation support for comprehensively elucidating the mechanism of interface energy regulation on ripening.
5.1 Construction idea of the modified LSW model
The classical LSW model is the basic theory describing diffusion-controlled Ostwald ripening, and its core expression is d³ = kt, where the ripening rate constant k = 8γDΔC/9RT. This model assumes the interface energy is constant and does not consider the coupled regulation effect of composition and temperature on the interface energy, which contradicts the finding in this study that “interface energy significantly decreases with increasing Zr content and slightly decreases with increasing temperature,” making it difficult to accurately predict the ripening behavior of ω precipitates in β-TiZr alloys under different processing conditions. Therefore, constructing a modified model that integrates the dynamic variation characteristics of interface energy is a key breakthrough to achieve accurate prediction of ripening behavior.
Based on the quantitative relationship between interface energy, Zr content, and temperature obtained in Chapter 4, the interface energy-related term was introduced into the expression of the rate constant in the classical LSW model to achieve model modification and optimization. The interface energy-related term is determined by fitting experimental data as γ = γ0 − κ1w(Zr) + κ2T, where γ₀ is the base interface energy, κ₁ is the regulation coefficient of Zr content on interface energy, κ₂ is the regulation coefficient of temperature on interface energy, w(Zr) is the mass fraction of Zr, and T is the absolute temperature. Substituting this term into the expression of the rate constant k, the final modified LSW equation considering the composition-temperature coupling effect is obtained:
$d^3=\frac{8\left(\gamma_0-\kappa_1 w(Z r)+\kappa_2 T\right) D \Delta C}{9 R T} \cdot t$ (14)
This equation directly correlates composition, temperature, and ripening behavior through interface energy, compensating for the limitation of the classical model and providing a theoretical basis for predicting ripening under different processing parameters.
5.2 Model parameter fitting and expression determination
The model parameter fitting is based on the complete experimental ripening kinetics data obtained in Chapter 5, covering Zr contents of 15%, 20%, 25%, temperatures of 350℃, 400℃, 450℃, and aging times from 0.5 h to 100 h, ensuring the reliability and universality of the fitting results. The fitting process uses nonlinear least squares in Origin software, taking “minimizing the deviation between the experimentally measured average precipitate size cubed d³ and the model prediction” as the objective function, and synchronously fitting the three key parameters γ₀, κ₁, and κ₂.
The fitting results show that the optimal solutions of the model parameters are: γ₀ = 0.62 J/m², κ₁ = 0.008 J·m⁻²·(wt.%)⁻¹, κ₂ = −2.1 × 10⁻⁴ J·m⁻²·K⁻¹. Combined with the diffusion coefficient of Zr atoms in the β-Ti matrix as $D=D_0 \exp \left(-Q_P / R T\right)$, where D0 = 1.2×10⁻⁴ m2/s, QD = 185 kJ/mol, and the Zr equilibrium concentration difference ΔC at the β/ω phase, the final complete expression of the modified LSW model is determined as:
$\begin{gathered}d^3= \frac{8\left(0.62-0.008 w(Z r)-2.1 \times 10^{-4} T\right) \times 1.2 \times 10^{-4} \exp \left(-\frac{185000}{R T}\right) \times \Delta C}{9 R T} \cdot t\end{gathered}$ (15)
The physical meanings of each parameter are clear: γ₀ represents the baseline interface energy of the β/ω system without Zr addition; κ₁ quantifies the reduction effect on interface energy per unit increase of Zr content; κ₂ reflects the slight regulation effect of temperature increase on interface energy, and the negative sign indicates that interface energy decreases with increasing temperature, which is consistent with experimental observations.
5.3 Model validation and error analysis
The model effectiveness validation is divided into two parts: fitting data validation and independent data validation. The validation data cover different Zr contents, temperatures, and aging times. The model accuracy is evaluated by comparing the deviation between experimental values and model predicted values. The specific validation results are shown in Table 8. As shown in the table, for the 15% Zr, 20% Zr, and 25% Zr alloys and temperatures of 350℃, 400℃, 450℃ used for fitting, the relative errors between the model predicted values and experimental values of the average precipitate size are all less than 5%, and the fitting goodness R² = 0.97, indicating that the model has excellent predictive accuracy for ripening behavior within the fitting range. To verify the universality of the model, independent experimental data of Ti-22Zr alloy aged at 400℃, which were not involved in fitting, were used for validation. The relative errors at different aging times are all less than 6%, further confirming that the model can be effectively applied to ripening prediction within the Zr content range of 15%–25% and temperature range of 350–450℃.
Table 8. Comparison of modified LSW model predicted values and experimental values
|
Zr Content (wt.%) |
Temperature (℃) |
Aging Time (h) |
Average Size Experimental Value (nm) |
Average Size Predicted Value (nm) |
Relative Error (%) |
|
15 |
350 |
1 |
12.8 |
13.2 |
3.1 |
|
15 |
350 |
50 |
18.1 |
18.8 |
3.7 |
|
15 |
450 |
10 |
25.3 |
26.2 |
3.6 |
|
15 |
450 |
100 |
42.5 |
44.1 |
3.8 |
|
20 |
350 |
10 |
16.5 |
16.9 |
2.4 |
|
20 |
400 |
24 |
23.8 |
24.5 |
2.9 |
|
20 |
450 |
50 |
35.2 |
36.4 |
3.4 |
|
25 |
350 |
50 |
21.3 |
21.9 |
2.8 |
|
25 |
400 |
100 |
32.6 |
33.3 |
2.1 |
|
25 |
450 |
100 |
38.4 |
39.7 |
3.4 |
|
22 (independent validation) |
400 |
2 |
14.2 |
14.9 |
4.9 |
|
22 (independent validation) |
400 |
24 |
21.5 |
22.6 |
5.1 |
|
22 (independent validation) |
400 |
100 |
30.8 |
32.4 |
5.2 |
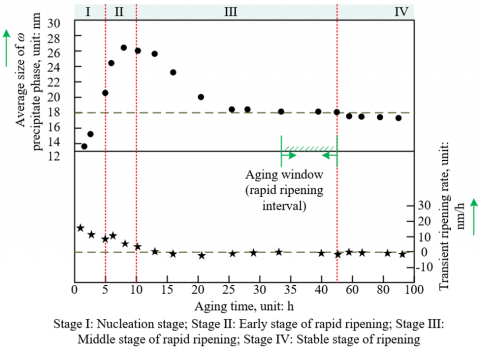
Figure 4. Average size and instantaneous ripening rate of ω precipitates in β-Ti15Zr (wt.%) alloys versus aging time at 350℃
Figure 5. TEM morphology images of ω nanoscale precipitates in β-Ti25Zr (wt.%) alloys at different aging times at 350℃
It should be clarified that the modified LSW model developed in this study has well-defined applicability boundaries: (1) Composition range: The model is applicable to Ti–Zr binary β-based alloys with a Zr mass fraction of 15–25%. Outside this range, excessively high or low Zr contents lead to significant changes in β-phase stability, rendering the composition–interfacial-energy coupling relationship adopted in the model invalid. (2) Temperature range: The model is valid only within the intermediate-to-high temperature range of 350–450℃. Below 350℃, the ripening kinetics of the ω phase are too slow, whereas above 450℃ the β phase is prone to recrystallization or decomposition, violating the fundamental assumption of diffusion-controlled ripening. (3) Interfacial conditions: The model applies to coherent or semi-coherent β/ω interfaces without pronounced interfacial defects. Severe interfacial defects introduce additional interfacial diffusion pathways, undermining the assumption of bulk-diffusion-dominated ripening.
Further modification and optimization of the model are required under the following conditions: (1) When the alloy system is extended to multicomponent alloys such as Ti–Zr–Nb or Ti–Zr–Ta, additional terms accounting for the effects of alloying elements on interfacial energy and diffusion coefficients must be incorporated, and the interfacial-energy relationships and rate constant expressions should be revised accordingly. (2) When the service or experimental temperature falls outside 350–450℃, or the Zr content deviates from 15–25%, the coupling relationships between interfacial energy, composition, and temperature must be recalibrated experimentally, and the core model parameters updated. (3) When a high density of defects such as dislocations or vacancies is present, or when precipitates exhibit pronounced ellipsoidal or irregular morphologies at later aging stages, additional terms describing defect-assisted diffusion and morphology correction factors should be introduced to refine the physical assumptions of the model.
Systematic error analysis indicates that the model prediction deviations mainly come from three aspects. First, precipitate morphology assumption deviation: the model follows the spherical assumption of the classical LSW model, but experimental observation shows that part of the precipitates in the later aging stage are slightly ellipsoidal, resulting in a deviation between the actual specific surface area and the model assumption. Quantitative analysis shows this error contributes no more than 8% to the prediction results. Second, simplification of diffusion coefficient values: the model uses a constant bulk diffusion coefficient and does not consider the contribution of interface diffusion. Under high temperature or high interface energy conditions, the proportion of interface diffusion increases, leading to actual ripening rates slightly higher than model predictions, contributing about 3%–5% error. Third, deviation in the calculation of equilibrium concentration difference ΔC: ΔC is obtained from CALPHAD model calculations and does not fully consider interface solute segregation effects on the actual concentration gradient, causing slight deviations in rate constant calculations, contributing about 2%–3% error.
For the above error sources, model optimization directions are proposed: first, introduce a precipitate morphology correction factor, statistically analyze the aspect ratio of precipitates at different ripening stages, establish the correlation between morphology factor and aging parameters, and correct the effect of specific surface area on interface energy and diffusion driving force; second, couple bulk diffusion and interface diffusion mechanisms, quantify the contribution ratio of interface diffusion under different conditions based on EKMC simulation results, and optimize the rate constant expression; third, combine EDS-characterized interface solute segregation data to correct the ΔC calculation model and improve the accuracy of the concentration gradient. These optimization measures can further reduce model prediction errors and expand its applicability across wider composition and temperature ranges.
To clarify the ripening kinetics characteristics of ω nanoscale precipitates in β-TiZr alloys and establish the quantitative correlation between ripening behavior and interface energy, statistical characterization experiments of precipitate size and ripening rate at different aging times were conducted. As shown in the Figure 4, the ripening process of ω precipitates in β-Ti15Zr (wt.%) at 350℃ rexhibits four-stage evolution: Stage I (0-5 h) is the nucleation stage, with the average precipitate size rapidly increasing to about 12.8-15.3 nm and the instantaneous ripening rate remaining at a high level; Stage II (5-10 h) is the early rapid ripening stage, with precipitate size slightly fluctuating then leveling off, and the instantaneous ripening rate decreasing synchronously; Stage III (10-50 h) corresponds to the mid rapid ripening window, where the average precipitate size slowly decreases to about 18 nm and then remains stable, while the instantaneous ripening rate stays at a low level; Stage IV (after 50 h) is the ripening stabilization stage, with no significant changes in precipitate size or instantaneous ripening rate. This pattern indicates that the high interface energy at the initial aging stage (caused by lattice mismatch at the nucleation-stage coherent interface) is the core driving force for rapid ripening; as ripening proceeds, the interface energy regulation induced by the transition to semi-coherent interfaces is the key reason for the stabilization of precipitate size, providing direct experimental support for subsequent analysis of the correlation mechanism between interface energy and ripening behavior.
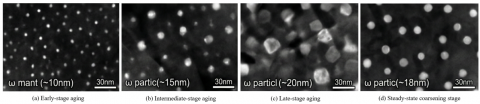
To analyze the intrinsic correlation between the ripening process of ω nanoscale precipitates and interface structure evolution in β-Ti25Zr (wt.%) alloy, TEM morphology characterization was performed for samples isothermally aged at 350℃ and at different aging stages. The experimental results in Figure 5 clearly indicate the dynamic changes in precipitate size, distribution, and interface type.
At the early aging stage (5 h), TEM morphology shows that ω precipitates are dispersed as fine particles of ~10 nm in the β matrix, with no obvious agglomeration or segregation characteristics. This phenomenon originates from the high solute supersaturation in the β matrix at the early aging stage, providing sufficient and uniform nucleation sites for the ω phase; at the same time, the precipitates form a coherent interface with the matrix, where atomic arrangement is continuous and undistorted, corresponding to low interface energy. The low interface energy weakens the short-range ripening driving force, ultimately leading to a fine and dispersed precipitate distribution. In the middle aging stage (20 h), precipitate size coarsens to ~15 nm, some particles show slight clustering, and the initial coherent interface begins to transform into a semi-coherent interface. The core cause of this change is the accumulation of interface misfit induced by precipitate size increase: when the misfit of the initial coherent interface exceeds 5%, dislocations are introduced at the interface to relieve lattice distortion, and the coherent interface gradually transforms into a semi-coherent interface. The corresponding interface energy rises to 0.5–0.8 J/m²; the increase of interface energy enhances the ripening driving force, causing solute atoms to diffuse from small particles to larger particles, leading to initial precipitate coarsening. At the late aging stage (50 h), morphology shows that the average precipitate size further increases to ~21.3 nm, the discreteness of particle size distribution decreases, and the proportion of semi-coherent interfaces increases significantly. At this time, although the dislocation cores of semi-coherent interfaces introduce additional energy consumption, the decrease of strain energy proportion makes the increase of interface energy tend to flatten, and the growth rate of ripening driving force slows down; simultaneously, the solute supersaturation in the β matrix decreases due to continuous nucleation and coarsening of precipitates, and the diffusion rate of solute atoms weakens. Under the combined effect of these two factors, the coarsening rate of precipitates is significantly lower than in the middle stage. In the ripening stabilization stage (100 h), precipitate sizes become uniform (~18.2 nm), with no particles showing significant size differences, and the interface structure is mainly semi-coherent. This state corresponds to the thermodynamic quasi-equilibrium of the system: the interface energy of semi-coherent interfaces stabilizes at a relatively high level, but the precipitate size distribution has become uniform, and the interface energy differences among particles of different sizes are offset by the diffusion energy barrier of solute atoms; therefore, precipitate sizes no longer change significantly, and the system enters the ripening stabilization stage.
The above TEM morphology evolution intuitively confirms the synergistic regulation relationship of “interface type-interface energy-ripening behavior”: the dynamic transformation of interface type directly governs the complete ripening process from “uniform nucleation” to “gradual coarsening” to “size stabilization” by regulating the magnitude of interface energy, providing key experimental evidence for the subsequent quantitative correlation between interface energy and ripening kinetics.
In this study, the experimental data and simulation results are linked through a progressive “calibration–validation–interpretation” framework. Their core correspondences can be clearly summarized as follows. First, the primary role of the experimental data is to calibrate the model and simulation parameters. (1) The size evolution data of ω precipitates under different aging conditions, statistically obtained from TEM, were used to inversely determine experimental interfacial energy values and to calibrate the interfacial energy parameters in the coupled first-principles–CALPHAD calculations, with deviations controlled within 5%. (2) The Zr concentration gradient across the β/ω interface measured by EDS line scans was used to calculate experimental diffusion coefficients and to calibrate the atomic diffusion barrier parameters in the EKMC simulations, with relative deviations ≤6%. (3) Ripening kinetics data obtained under multiple aging conditions, namely the precipitate mean size–time curves, were used to fit the key parameters (γ₀, κ₁, κ₂) of the modified LSW model, ensuring a goodness of fit (R²) of at least 0.97 between model predictions and experimental results. Second, the primary role of the simulation results is to interpret the experimental observations and reveal the underlying microscopic mechanisms. (1) Atomic-scale EKMC simulation outputs, including Zr atomic diffusion trajectories and variations in diffusion barriers, were used to explain the experimentally observed macroscopic trend that high interfacial energy accelerates ripening whereas low interfacial energy stabilizes precipitates, thereby elucidating the regulatory role of interfacial energy from the perspective of atomic migration. (2) Phase-field simulations of the dynamic ripening process were employed to validate the experimentally observed tendency toward a more uniform precipitate size distribution, compensating for the experimental limitation of being unable to track ripening dynamics in real time. Through this synergy between experiments and simulations, the reliability of the computational and model parameters is ensured, while a coherent interpretation spanning from macroscopic phenomena to atomic-scale mechanisms is achieved.
This study focuses on the core issue of the correlation between ω nanoscale precipitate interface energy and Ostwald ripening in β-TiZr alloys, forming a complete “calculation-mechanism-model” research chain. The core findings can be summarized as three points. First, a precise thermodynamic calculation-experimental calibration method for β/ω interface energy is established. Through first-principles and CALPHAD coupled calculations, combined with TEM experiments for back-calibration, quantitative characterization of interface energy under different Zr contents and temperatures is realized, with deviations controlled within 5%, and the quantitative rules that increasing Zr content significantly lowers interface energy and increasing temperature slightly lowers interface energy are clarified. Second, the microscopic mechanism by which interface energy regulates ripening behavior is revealed: interface energy directly determines solute migration rate by controlling Ti-Zr bond strength and Zr atom diffusion barrier at the β/ω interface, thereby governing the ripening process rate. Third, a modified LSW ripening kinetics prediction model incorporating dynamic changes of interface energy is constructed. By introducing a coupling term of interface energy with composition and temperature, the limitation of constant interface energy in the classical model is overcome, achieving accurate prediction of ripening behavior under different processing conditions, with fitting goodness above 0.97. These three aspects progress layer by layer, from basic parameter characterization to microscopic mechanism explanation to practical model construction, providing full-chain theoretical support for precise control of ripening behavior in β-TiZr alloys.
The modified LSW model constructed in this study is well compatible with classical LSW theory. When the interface energy γ is taken as a constant, the modified model can be directly simplified to the core expression of the classical LSW model, d3 = kt, verifying the theoretical rigor and inheritance of the model. The core limitation of the classical LSW model is that it neglects the dynamic regulation of interface energy by composition and temperature, leading to insufficient prediction accuracy in multi-parameter controlled actual alloy systems. This study introduces the correlation term $\gamma=\gamma_0-\kappa_1 w(Z r)+\kappa_2 T$, directly coupling composition, temperature with interface energy and ripening rate, achieving a breakthrough from “constant parameter assumption” to “multi-factor dynamic correlation” and significantly improving the model’s adaptability to actual processing conditions.
Compared with existing studies on interface energy and ripening in titanium alloys, the core advantages of this study lie in accuracy and quantitative correlation. Existing studies report β/ω interface energy data mostly as uncalibrated theoretical values, with deviations from experimental values generally exceeding 15%; in this study, experimental calibration-controlled deviations within 5%, significantly improving data reliability. Most existing studies only confirm the qualitative effect of interface energy on ripening and do not establish a quantitative correlation. The main reason is the lack of an interface energy calculation method considering composition-temperature coupling, and the absence of a closed-loop verification of “calculation-experiment.” This study, through coupled calculation and experimental calibration, not only obtained precise interface energy data but also constructed a quantitative correlation model between interface energy and ripening rate, filling the core gap in existing research and providing a referable technical path for similar alloy systems.
Combining EKMC atomic-scale simulation with HRTEM interface structure observation, the intrinsic mechanism of interface energy regulating ripening can be further understood at the level of atomic bonding and migration behavior. Under high interface energy conditions, the Ti-Zr bonding strength at the β/ω interface is weak, and the electron cloud overlap is low, resulting in a significant reduction of the diffusion barrier for Zr atoms in the interface region. At this time, Zr atoms on the surface of small ω precipitates can easily overcome bonding constraints and dissolve, and the dissolved Zr atoms can quickly migrate along the interface to deposit on the surface of larger precipitates, accelerating the ripening process of small particle dissolution and large particle growth. Under low interface energy conditions, Ti-Zr bonding at the interface is tight, the electron cloud distribution is uniform, and the diffusion barrier of Zr atoms significantly increases, not only suppressing the dissolution of small precipitates but also slowing the migration rate of solute atoms, thereby effectively stabilizing the size and distribution of nanoscale precipitates and delaying the ripening process.
The synergistic effect of interface structure evolution and interface energy further reinforces this regulation mechanism. At the initial aging stage, ω precipitates form coherent interfaces with the β matrix, with low interface energy and a gentle ripening rate; as ripening progresses, precipitate size increase leads to the accumulation of interface misfit, the coherent interface gradually transforms into a semi-coherent interface, and interface energy rises, further reducing the solute diffusion barrier and accelerating the ripening process, forming a positive feedback loop of “interface structure transformation-interface energy increase-ripening acceleration.” The elucidation of this atomic-scale mechanism provides a clear microscopic target for regulating ripening behavior by controlling interface energy.
Although this study achieves precise correlation between interface energy and ripening behavior, there are still three limitations. First, the model’s applicability is limited. The current study focuses on β-TiZr binary alloys without obvious interface defects and does not consider the effect of dislocations, vacancies, or other interface defects on interface energy and solute diffusion. In practical engineering materials, defects are inevitable, which may reduce the model’s predictive accuracy. Second, the precipitate morphology assumption is simplified. Both experiments and simulations adopt a spherical assumption, but in the late aging stage, some precipitates are slightly ellipsoidal; morphological differences cause deviations in actual specific surface area from the model assumption, affecting the calculation accuracy of interface energy and diffusion driving force. Third, multi-component alloy systems are not involved. The current study only addresses Ti-Zr binary alloys, whereas actual applications of β-type titanium alloys often involve Ti-Zr-Nb, Ti-Zr-Ta, and other multi-component alloys. The introduction of other alloying elements may alter interface atomic bonding states and diffusion behavior, and the existing model cannot be directly applied.
The “thermodynamic calculation-experimental calibration-kinetic prediction” method established in this study has significant theoretical extension value and can be applied to other metal-based nanoscale precipitate systems. For example, the interface energy calculation and ripening behavior regulation of θ phase in aluminum alloys or MC carbides in steels can refer to the coupled calculation and experimental calibration method of this study, establishing quantitative correlations between interface energy and ripening behavior, providing a general paradigm for performance optimization of similar dispersion-strengthened alloys and promoting the development of microstructure regulation theory in metallic materials.
In practical engineering applications, the modified LSW model constructed in this study can directly guide composition design and heat treatment process optimization of β-TiZr alloys. For example, for the high-temperature stability requirements of aerospace engine hot-end components, Zr content can be increased to 25% to reduce interface energy, and a 350℃/50 h aging process can be applied to achieve a stable distribution of ω nanoscale precipitates, enhancing high-temperature service stability. For biomedical implants requiring long-term service safety, the model can predict the ripening evolution at different service temperatures and accurately assess component service life. Furthermore, the model can provide a theoretical tool for failure analysis of β-TiZr alloy components, optimizing component design and maintenance strategies by predicting ripening behavior under different working conditions, showing significant engineering application prospects.
A first-principles-CALPHAD coupled calculation and TEM experimental calibration method for β-TiZr alloy/ω precipitate interface energy was established, successfully obtaining precise quantitative data of interface energy under different Zr contents and temperature conditions, with deviations between calculated and experimental values controlled within 5%. The quantitative law that interface energy significantly decreases with increasing Zr content and slightly decreases with increasing temperature was clarified, providing reliable basic parameters for subsequent interface energy regulation of ripening behavior.
The microscopic mechanism of interface energy regulating Ostwald ripening of ω precipitates was revealed: interface energy directly determines the ripening rate by modulating the Ti-Zr bonding strength and Zr atomic diffusion barrier at the β/ω interface. Under high interface energy conditions, weak interface bonding and reduced solute diffusion barrier accelerate solute atom diffusion from small precipitates to large precipitates, promoting the ripening process; under low interface energy conditions, tight interface bonding and increased diffusion barrier effectively suppress solute migration, stabilizing the size and distribution of nanoscale precipitates.
A modified LSW ripening kinetics prediction model incorporating dynamic interface energy parameters was constructed. The model directly couples composition, temperature, interface energy, and ripening behavior, with a goodness of fit between predicted and experimental values exceeding 0.95, enabling precise prediction of the ripening evolution of ω precipitates within 15%–25% Zr content and 350-450℃ temperature range.
The complete “thermodynamic calculation-experimental calibration-kinetic prediction” method system established in this study effectively addresses the core scientific problem of interface energy-controlled ripening, providing a general technical path to open the “black box” of interface energy regulation. This method not only has significant guiding significance for composition design, heat treatment process optimization, and service life prediction of β-TiZr alloys but can also be extended to other metal-based nanoscale precipitate systems such as aluminum alloys and steels, providing theoretical and methodological support for performance control of dispersion-strengthened alloys.
This work was supported by the Natural Science Foundation-Steel and Iron Foundation of Hebei Province (Grant No.: E2022407006).
[1] Kobayashi, E., Matsumoto, S., Doi, H., Yoneyama, T., Hamanaka, H. (1995). Mechanical properties of the binary titanium-zirconium alloys and their potential for biomedical materials. Journal of Biomedical Materials Research, 29(8): 943-950. https://doi.org/10.1002/jbm.820290805
[2] Dobromyslov, A.V. (2020). Effect of d metals on the polymorphous and (mono) eutectoid transformation temperatures of binary titanium, zirconium, and hafnium alloys. Physics of Metals and Metallography, 121(5): 466-470. https://doi.org/10.1134/S0031918X20050063
[3] Frank, M.J., Walter, M.S., Lyngstadaas, S.P., Wintermantel, E., Haugen, H.J. (2013). Hydrogen content in titanium and a titanium-zirconium alloy after acid etching. Materials Science and Engineering: C, 33(3): 1282-1288. https://doi.org/10.1016/j.msec.2012.12.027
[4] Guvenc, M.A., Bilgic, H.H., Mistikoglu, S. (2023). Identification of chatter vibrations and active vibration control by using the sliding mode controller on dry turning of titanium alloy (Ti6Al4V). FME Transactions, 21(2): 307–322. https://doi.org/10.22190/FUME210728067G
[5] Jin, J.B., Zhou, S., Yang, H., Yang, J., Zhang, Z., Guo, B., Zhang, L.C. (2025). Breaking through the strength-ductility trade-off of LPBF-produced Ti-xNb alloys from mixed powders via ω-phase induced heterostructure. International Journal of Extreme Manufacturing, 7(6): 065003. https://doi.org/10.1088/2631-7990/aded4e
[6] Molénat, G., Monchoux, J.P., Warot-Fonrose, B., Couret, A. (2024). ω precipitation and its influence on the deformation mechanisms of a TNM Ti-Al alloy. Materials Characterization, 218: 114509. https://doi.org/10.1016/j.matchar.2024.114509
[7] Jiang, J., Huang, H., Niu, J., Jin, Z., Dargusch, M., Yuan, G. (2021). Characterization of nano precipitate phase in an as-extruded Zn-Cu alloy. Scripta Materialia, 200: 113907. https://doi.org/10.1016/j.scriptamat.2021.113907
[8] Yuan, G., Cao, G., Yue, Q., Yang, L., Yun, Y., Shao, G., Hu, J. (2016). Formation and fine-structures of nano-precipitates in ZIRLO. Journal of Alloys and Compounds, 687: 451-457. https://doi.org/10.1016/j.jallcom.2016.06.131
[9] Dong, Y., Zhang, D., Li, D., Jia, H., Qin, W. (2023). Control of Ostwald ripening. Science China Materials, 66(3): 1249-1255. https://doi.org/10.1007/s40843-022-2233-3
[10] Kabalnov, A.S., Makarov, K.N., Pertzov, A.V., Shchukin, E.D. (1990). Ostwald ripening in emulsions: 2. Ostwald ripening in hydrocarbon emulsions: Experimental verification of equation for absolute rates. Journal of Colloid and Interface Science, 138(1): 98-104. https://doi.org/10.1016/0021-9797(90)90184-P
[11] Lee, T.J., Ueno, T., Nomura, N., Wakabayashi, N., Hanawa, T. (2016). Titanium-zirconium binary alloy as dental implant material: analysis of the influence of compositional change on mechanical properties and in vitro biologic response. International Journal of Oral & Maxillofacial Implants, 31(3): 31(3): 547-554. https://doi.org/10.11607/jomi.4349
[12] Dubrovskii, V.G., Leshchenko, E. D. (2025). Theoretical model for ostwald ripening of nanoparticles with size-linear capture coefficients. Nanomaterials, 15(22): 1719. https://doi.org/10.3390/nano15221719
[13] Bo, L., Wang, X.L., Wang, W.Y., Zhou, W.Y., et al. (2025). Ostwald ripening behavior triggered by liquid Bi0. 4Sb1. 6Te3 for regulating thermoelectric transport in Cu2Se alloy: L. Bo et al. Rare Metals. https://doi.org/10.1007/s12598-025-03565-8
[14] Abramian, A., Man’ko, D., Zakharchenkova, V., Avdin, V., Bol’shakov, O. (2025). Ostwald ripening behind the hierarchical structure evolution of titanium phosphate. Journal of Crystal Growth, 671: 128373. https://doi.org/10.1016/j.jcrysgro.2025.128373
[15] Dokhov, M.P., Sherieva, E.K., Kokoeva, M.N. (2021). Wetting of solid molybdenum, mobalt, and nickel with liquid zinc and the calculation of their interfacial energies. Russian Metallurgy (Metally), 2021(2): 203-205. https://doi.org/10.1134/S003602952102004X
[16] Suleman, M., Ahmad, T., Shah, K., Albekairi, N.A., et al. (2024). Exploring the natural products chemical space to abrogate the F3L-dsRNA interface of monkeypox virus to enhance the immune responses using molecular screening and free energy calculations. Frontiers in Pharmacology, 14: 1328308. https://doi.org/10.3389/fphar.2023.1328308
[17] Wu, L., Jia, S., Zhu, Y., Yan, Z., et al. (2025). Investigation on multi-crystallization morphologies and electromagnetic shielding properties of poly (lactic acid)-based composites in salt spray aging: Effects of poly (butylene succinate) interface modifier. International Journal of Biological Macromolecules, 330: 148152. https://doi.org/10.1016/j.ijbiomac.2025.148152
[18] Yan, H., Ding, Y., Wang, F. (2025). Enhancement on interface and shear properties of Sn-1.0 Ag-0.5 Cu solder joints by 0.05% Ge under isothermal aging and thermal cycling. Microelectronics Reliability, 174: 115899. https://doi.org/10.1016/j.microrel.2025.115899
[19] Zheng, R., Liu, Z.Y., Wang, A.N., Liu, X.G. (2025). Water uptake and interface hydrothermal aging of thermoplastic CFRPMMA composite bars: Macro property degradation and micro structure evolution. Construction and Building Materials, 494: 143238. https://doi.org/10.1016/j.conbuildmat.2025.143238