Kumar Chougala*![]() | Sidramappa Alur
| Sidramappa Alur![]()
© 2025 The authors. This article is published by IIETA and is licensed under the CC BY 4.0 license (http://creativecommons.org/licenses/by/4.0/).
OPEN ACCESS
The thermophysical properties of Graphene-MWCNT/DW-EG (70:30) hybrid nanofluids at different volume concentrations (0.001, 0.01 ad 0.1%) and at temperatures (30℃ to 60℃) were measured and were compared with those obtained for the distilled water. The thermal conductivity and the Viscosity of the Nanofluid increase with increase in volume concentration and A 0.1% volume concentration and temperature of 60℃ temperature will result in the maximum increase in the value of the thermal conductivity (by 30%) and the decrease in the value of viscosity. The Nano fluid was tested for the stability. characterization techniques indicate a hexagonal structure in the MWCNT with porosity zones seen on the surface of MWCNT and EDS images indicate a purity of Graphene-MWCNT. Surface Tension of nanofluids was found to be more sensitive to temperature changes rather than on concentration. The contact angle depends both on the Nanoparticle concentration and surface modification achieved through the use of Nanofluids. The Levenberg Marquardt machine learning model was found to be more accurate as compared to the Scaled Conjugate Gradient artificial neural network model and gave the minimum mean square error and higher coefficient of correlation values and a good agreement with the experimental data for thermal conductivity ratio with the predicted values obtained within 1% of the experimentally measured values.
hybrid nanofluids, thermal conductivity, ethylene glycol, viscosity, Levenberg Marquardt, scaled conjugate gradient
The limited heat transfer capability of traditional heat transfer fluids has motivated the development of nanofluids in recent years. DW-EG mixture (usually in a 70:30 volume ratio) can be important base fluid because of its balanced thermal stability, low volatility, and attractive rheological behaviour. The synergistic effects of two or more distinct types of nanoparticles when in suspension within a solvent fluid can be observed by the improvements in the thermophysical properties. The potential for hybrid nanofluids to outperform conventional single nanoparticle nanofluids in terms of thermal performance has been impressive for the 50: 50 Graphene - Multi-walled Carbon Nanotubes (MWCNTs), The hybridization will yield a better surface area, high aspect ratio, and remarkable thermal conductivity. The two-dimensional structure of Graphene and the one-dimensional tubular structure of MWCNTs are intended to be utilized to establish a percolation network that promotes effective heat transfer.
Determining the thermophysical characteristics of these hybrid nanofluids along with the stability is essential for comprehending their functionality and applicability for real-world heat transfer systems like electronic devices, thermal management, automotive cooling, and renewable energy systems. Furthermore, understanding the mechanisms controlling heat transport and nanofluid behaviour can be gained by examining the microstructure, zeta potential, and dispersion stability using methods like FESEM, EDS AND X-RD The synthesis, characterisation, and performance assessment of Graphene-MWCNT (50:50)/DW-EG hybrid nanofluids are thus the main topics of this study, which adds to the expanding corpus of information on advanced nanofluids.
However, it can be difficult and frequently resource-intensive to measure and estimate the thermal conductivity ratio precisely under different operating conditions. Because of their accuracy and computational efficiency, the Levenberg–Marquardt (LM) and Scaled Conjugate Gradient (SCG) algorithms are among the best techniques for training ANN models in this paper and have been compared for their prediction accuracy in the present undertaken work.
Onyiriuka [1] used volume fraction, temperature, nano-particle shape and base fluids as input variables and output variable as thermal conductivity. They found the model based on the proposed feature selection algorithm predicted better than the other algorithms with a root-mean-squared error of validation of 1.83 and a R2 value of 0.94 on validation dataset. Nayebpashaee et al. [2] were able to improve the value of thermal conductivity of Graphene-Al2O3 Nanofluid by 44% while conducting the experiment at a temperature of 303 K and the solid volume fraction of 2.5%, and contributed a new correlation to estimate the thermal conductivity of the said Nanofluid.
$\frac{k_{n f}}{k_{b f}}=0.944\left[\left[1+\frac{T}{T_{\max }}\right]^{0.108}(1+\varphi)^{0.27}(1+\alpha)^{0.013}\right]$ (1)
They also proposed a new correlation to estimate the thermal conductivity and correlation shown in Eq. (2).
$\frac{k_{h n f}}{k_{b f}}=0.146+0.002 T+0.49$ (2)
Liu et al. [3] conducted an experimental investigation for the sake of determining the thermophysical properties of synthesized Mg–Al bimetal oxide/water nanofluid and were able to improve the value of the thermal conductivity by 15% as compared to water only fluid at the temperature of 375 K. Han et al. [4] developed a fitted nonlinear correlation equation for predicting the thermal conductivity of water-based ZnO Nanofluids and obtained a maximum increase in the value of thermal conductivity of the said Nanofluids by 44% at 75℃, as compared to the water. Li et al. [5] conducted the stability analysis of the reduced graphene oxide/gold (rGO-Au) hybrid nanofluids at different Ph values and were able to stabilize the prepared hybrid nanofluid for more than 6 months in the presence of Polyglycerol. Azharuddin and Saini [6] were able to increase the thermal conductivity of the Aqueous AgNO3–Graphene hybrid nanofluids to 24% as compared to that of base fluid by increasing the volume concentration from 0.01%, to 0.03%. Borode et al. [7] used ANN and RSM model to model and correlate the thermal conductivity, electrical conductivity, and viscosity of GNP–Fe2O3 hybrid nanofluids. They studied the effect of particle mixing ratio on the said properties and found that ANN model was able to predict more accurately as compared to RSM model. Zaikovsky et al. [8] were able to stabilize the sphere-shaped nanoparticles in water by Sodium Dodecyl Sulfate and observed no change in the value of viscosity up to the mass concentration of 0.04% but remained lower than the thermal conductivity of water by 4% at the said concentration. Momin et al. [9] studied the cumulative effect of varying the proportion of ZnO Nanoparticles in ZnO- MWCNT hybrid Nanofluid from 20:80 to 80:20 in ZnO- MWCNT hybrid Nanofluid along with temperature change from 20 to 55℃ at 0.1% of volume concentration on viscosity, thermal conductivity, and electrical conductivity and obtained an increase in the value of thermal conductivity by 10% to 20% with the increase in temperature from 20 to 55℃ for 20:80 proportion ratio. They developed correlations to approximate the value of thermal conductivity of the said hybrid nanofluids to cover both the proportion ratio and the temperature. Bhanuteja et al. [10] used Gr-CNT /EG-H2O hybrid nanofluid at the weight fraction from 0.0625% to 0.5% and at the temperatures from 50℃ to 70℃ and obtained the enhancement in the value of thermal conductivity from 15% to 24%. They also developed the correlations which were able to predict the value of thermal conductivity and viscosity within 10% and their developed ML models were able to predict the said properties within 4%. The developed correlations are depicted in Eqs. (3) and (4). Zamany et al. [11] used ANN models to predict the thermophysical properties of ZnO-MWCNT/EG-water hybrid nanofluid and found that radial basis function neural networks model (RBF) model shows the best accuracy with R2 values of 0.9951 and with average absolute relative deviation (AARD %) of 0.3532% as compared to the other models. Liu et al. [3] studied the effect of mass fraction of nanoparticles and the temperature on the thermophysical properties of Magnesium aluminum bimetallic oxide nanofluids and it was found that, both the thermal conductivity and viscosity increase with increased nanoparticle content, but the value of viscosity and surface tension was found to decrease with the increase in the temperature of nanofluids. Topal et al. [12] measured the dynamic viscosity of Nanofluids containing Al2O3, TiO2, and ZnO nanoparticles in water and used both multi-layer perceptron ANN and genetic algorithm (GA) for predicting the viscosity value and found that designed ANN model is a promising option for detecting the dynamic viscosity of Nanofluids. Bansal et al. [13] determined the thermophysical properties of GO-DW Nanofluids at low weight concentrations (0.0125-0.0375%) and at varying temperatures (10℃-60℃) and could improve the value of thermal conductivity and thermal diffusivity by 14% and 31% respectively but however the value of specific heat decreased by maximum up to 33%. Dosodia et al. [14] dispersed oxidized MWCNT in weight percentages of 0.0625, 0.125, 0.25, and 0.5 into Ethylene Glycol-Water to get a stable Nanofluid which resulted in a significant improvement in thermal conductivity. Masood et al. [15] conducted the experimental examination of the thermal conductivity of MWCNT based Nanofluids at different nanofluid temperatures (℃) and nanoparticle concentrations (mass/%) and response surface methodology (RSM)-based predictive model for the thermal conductivity was developed and checked for accuracy with R2 equal to 0.986. Sahin [16] tested the stability of Al2O3 and SiO2 nanoparticles existing as the solo nanofluids and also as a hybrid nanofluids with the help of sedimentation and zeta potential measurements and measured the thermal conductivity at different temperatures and proposed a new correlation based on an ANN model (MSE = 8.2175 × 10⁻⁵ and R² = 0.99958) within 4% of the experimental readings. Almurtaji et al. [17] focused on the physical stability of MWCNTs-water nanofluids prepared through bath temperature-controlled method at different volume concentrations and temperatures and asserted that concentrations higher than 1:1 surfactant to MWCNTs ratio can stabilize the Nanofluid up to a week. Atmaca et al. [18], compared nanoparticles SiO2, TiO2, MWCNT, and ZnO as solo nanofluids from 0.1% to 1% volume concentrations with binary, ternary and quaternary hybrid nanofluids at 0.1% volume concentrations with EG solvent. SiO2 nanoparticles exhibited the greatest stability, remaining intact for nearly a month while ZnO nanoparticles collapsed within a week. Shahrivar et al. [19] developed a comprehensive and accurate ANN using 800 laboratory data and the 5–13–1 topology was suggested as the best architecture with MSE and R2 of about 0.000238 and 0.9975, confirming the excellent ability of the present model in predicting the thermal conductivity of nanofluids. The model predicted better the thermal conductivity of oil and radiator coolant as compared to Ethylene Glycol and water with MSE and R2 being obtained at about 0.000037 and 0.000042, respectively. Huang et al. [20] measured the thermophysical properties of SiC-MWCNT/heat transfer oil at different temperatures and volume concentration and found that the thermal conductivity of the hybrid nanofluid was increased by 22.6% at 1.00 vol% and 80℃ and stabilized the hybrid nanofluid with the dispersant content of 3.0 wt%. Akhatov et al. [21] developed a correlation to predict the dynamic viscosity of MWCNT based nanofluid at different temperatures using the polynomial regression technique. The R2-value and RMSE were 0.99 and 1.18×10⁻⁶, respectively. The correlation for viscosity of nanofluids was shown in Eq. (3).
$\begin{gathered}\mu_{n f}=-1.378 \times 10^{-8} T^3+2.437 \times 10^{-8} T^2- 0.0001444 T+0.003532\end{gathered}$ (3)
Chalespar et al. [22] investigated how the temperature and solid volume fraction (SVF) parameters affected the dynamic viscosity of water hybrid nanofluids. Zirconium oxide (ZrO2)–Tungsten oxide (WO3)–MWCNTs Nanoparticles in mono, binary and ternary mixture with water have been examined for the stability using both the photographic technique and the zeta potential test. Ternary HNF resulted in 57% reduction of the dynamic viscosity.
Namarvari et al. [23] proposed a molecular dynamic simulation-based prediction of the viscosity of a typical SWCNT based Nanofluid and related the viscosity, temperature, and volume fraction as shown in Eq. (4).
$\mu_{n f}=A(\operatorname{Ln} T)^n+B \phi$ (4)
Dong et al. [24] observed that both the thermal conductivity and viscosity of the Propylene Glycol‑Based Graphene Nanofluids increase with the increase of the graphene concentration and mass concentration of graphene higher than 0.2 wt % will not contribute much to the heat transfer enhancement.
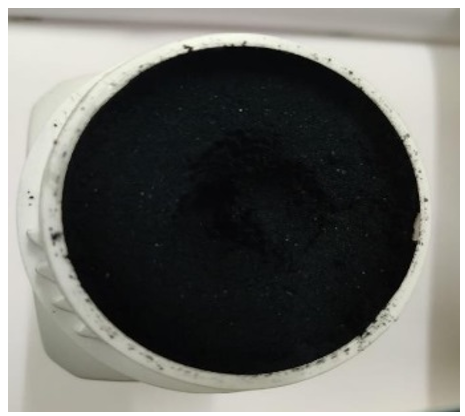
Graphene and MWCNT Nanoparticles were purchased from suppliers (Adnano Technologies Pvt. Limited Shimoga, Karnataka) and it is shown in Figure 1. The average diameter of the nanoparticles was less than 30 nm. The surface area of Graphene and MWCNT nanoparticles was 100 m2/g and 260 m2/g, respectively. Thermophysical properties of Graphene and MWCNT as provided by the suppliers are as shown in Table 1 and Table 2, respectively.
Figure 1. Graphene-MWCNT hybrid nanoparticles
Table 1. Thermophysical properties of graphene
|
Name of the Product |
Graphene |
|
Color |
Black |
|
Purity |
99% |
|
Diameter Average |
10µm |
|
Thickness |
5-10nm |
|
Specific surface area |
100 m2/g |
|
True Density |
2.267 g/cm3 |
|
Thermal Conductivity |
4000 W/m-K |
Table 2. Thermophysical properties of MWCNT
|
Parameter |
MWCNT |
|
Color |
Black |
|
Purity |
98% |
|
Diameter |
5-15nm |
|
SSA |
260 m2/g |
|
True density |
2.1 g//cm3 |
|
Thermal Conductivity |
3000 W/m-K |
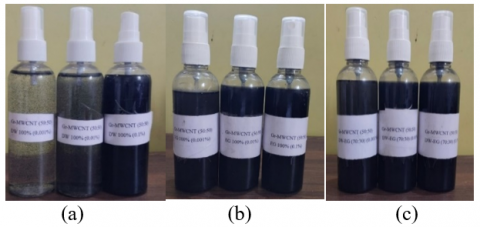
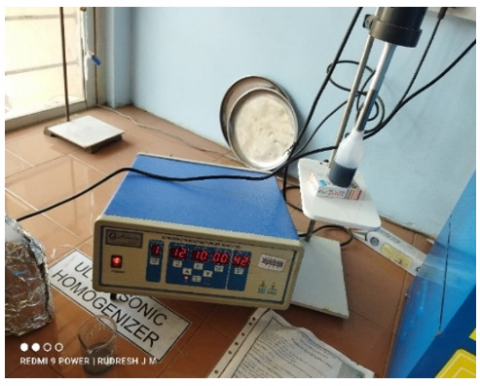
The first stage in doing experimental research using nanofluids is the preparation of the fluids. By dispersing solid particles with a nanometer size into base liquids like distilled water and ethylene glycol. Two different techniques have been used to prepare nanofluids. One approach is done using one step method, whereas the other is done using two step method. The two-step method was used in this investigation to prepare the nanofluids. Firstly, a precise balance is used to weigh the Graphene-MWCNT (50:50). It is then mixed with a known amount of Distilled Water-Ethylene Glycol to prepare hybrid nanofluids based on Graphene and MWCNT at different volume concentrations of 0.001%, 0.01%, and 0.1%. The Graphene-MWCNT nanoparticles with DW-EG (70:30) at various concentrations, including 0.001%, 0.01%, and 0.1%, is depicted in Figure 2. The powder particles are quickly mixed with distilled water and ethylene glycol in a number of phases to prepare the hybrid nanofluids; surfactant is not used in this process. For a duration of 12 hours, the hybrid nanofluids that were prepared were placed in an ultrasonic vibrator to achieve a stable and uniform suspension as shown in Figure 3. Stability tests were conducted subsequent to the nanofluids preparation. The experiments are conducted by making use of the prepared nanofluids.
Figure 2. Prepared graphene-MWCNT/distilled water, ethylene glycol and DW-EG(70:30) samples
Figure 3. Sonification
4.1 X-Ray Diffraction (X-RD)
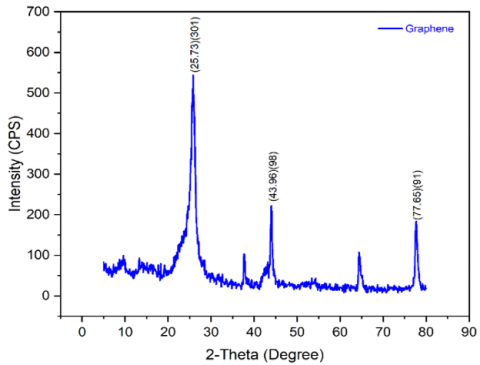
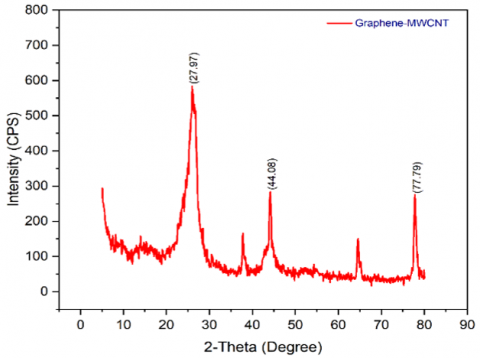
The XRD spectra of Graphene-MWCNT are utilized to determine its degree of oxidation, purity, and crystal size (Figure 4(a)). The characteristic peak of graphene-MWCNT is thought to be the most elevated peak observed at 2θ = 27.97°. The two low intensity peaks at 2θ = 44.08° and 77.79° correspond to the diffraction signature of the interwall spacing for the (308) (90) and (88) planes, respectively, and the distance between the walls of CNTs. The similarity between the prepared sample's XRD profile and the pure MWCNT obtained using JCPDS card No.: 89-8487 indicates that the prepared powder sample comprises pure form of graphene-MWCNT. The presence of a hexagonal structure (P63mc space group) in the MWCNT is confirmed by the diffraction peak observed at around 27.97°.
Figure 4. X-RD pattern of graphene-MWCNT hybrid nanoparticles
4.2 SEM and EDS of hybrid nanoparticles
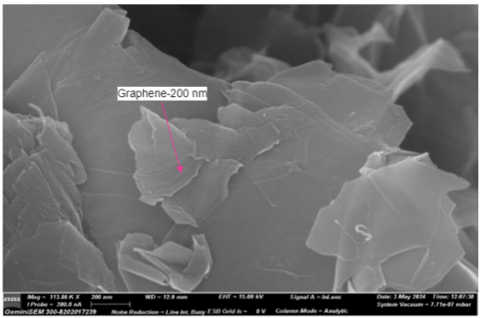
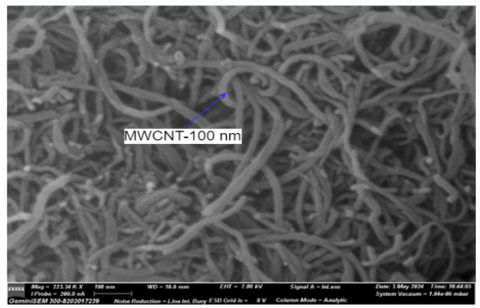
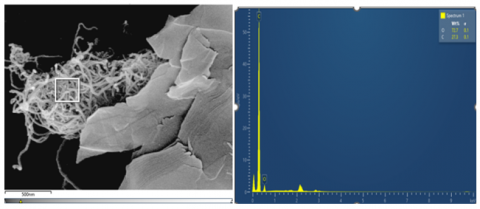
A FESEM image is utilized to quantify the nano powders surface shape. We purchased MWCNT and Graphene from Adnano Technologies Pvt. Limited Shimoga, Karnataka. Table 1 lists the physical characteristics of Graphene and MWCNT. Using scanning electron microscopy, Graphene-MWCNT's morphological characteristics were determined, as illustrated in Figure 5 and it is evident that MWCNT is a structure with a coiled surface shape that resembles a wrinkled thread. Secondly, several anomalies and porosity zones seen on the surface of MWCNT may be caused by changes in thermal conductivity. Figure 6 displays the elemental composition of MWCNT. It shows only two elements, carbon and oxygen, with corresponding weights of 72.7 and 23.3%. It attests to the great purity of the graphene-MWCNT employed in this investigation and shows correlation with the XRD result.
Figure 5. FESEM images of graphene and graphene-MWCNT nanoparticles at different magnifications
Figure 6. EDS images of graphene-MWCNT hybrid nanoparticles
5.1 Thermal conductivity of hybrid nanofluids
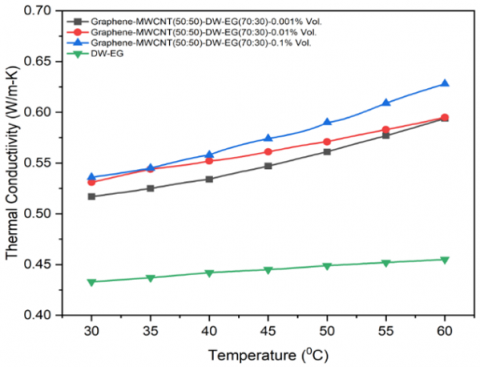
Figure 7(a) depicts how temperature affects the thermal conductivity of hybrid nanofluid concentrations. Here, the effectiveness of hybrid nanoparticles-based distilled water with ethylene glycol was experimentally determined by using thermal analyzer (KD2 pro, Decagon Device) with connection to a thermal bath. During measurement, the sensor needle (KS-1) in the KD2 Pro gadget was constructed of SS material and measured 60mm in length and diameter 0.13 mm. A calibration was performed using evaluating the thermal conductivity of known fluids. The thermal conductivity of distilled water and ethylene glycol was measured to be 0.455 W/m-K.
Figure 7. Thermal conductivity and thermal conductivity enhancement of graphene-MWCNT hybrid nanofluids
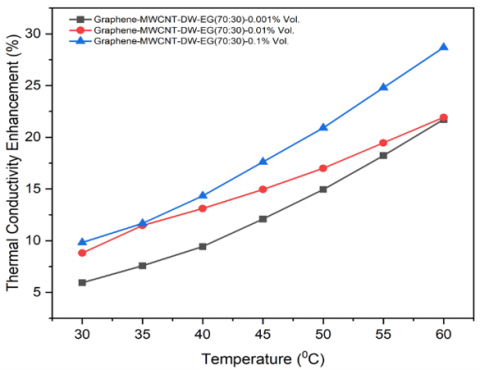
5.2 Evaluation of thermal conductivity
The thermal conductivity of Graphene-MWCNT hybrid nanoparticles distilled with ethylene glycol was measured by a thermal analyzer. The variations of thermal conductivity of Graphene-MWCNT hybrid nanofluid and the enhancement in the value of thermal conductivity in terms of percentage with respect to both the concentration and temperature are shown in Figure 7. The maximum enhancement in the thermal conductivity was observed to be 28.68% at 60℃ for 0.1% nanofluid volume concentration in comparison with DW-EG (70:30) at 30℃. The thermal conductivity of the nanofluid increases with both the concentration and the temperature. Higher conductivity of Graphene-MWCNT nanoparticles contributes to the thermal conductivity of Graphene-MWCNT–based DW-EG Nanofluid. Hybrid nanoparticles move more freely under the influence of Brownian motion as the temperature rises, increasing their thermal conductivity. The maximum thermal conductivity of the Graphene-MWCNT hybrid nanoparticle-based DW-EG is found to be 0.628 W/m-K at 60℃. The thermal conductivity values of Graphene-MWCNT/DW-EG are depicted in Table 3.
Table 3. Thermal conductivity of graphene-MWCNT/DW-EG (70:30) hybrid nanofluids
|
Temperature (℃) |
Thermal Conductivity (W/m-℃) |
|||
|
Gr-MWCNT/DW-EG (70:30) 0.001% Vol. |
Gr-MWCNT/ DW-EG (70:30) 0.01% Vol. |
Gr-MWCNT DW-EG (70:30)0.1% Vol. |
DW-EG |
|
|
30 |
0.517 |
0.531 |
0.536 |
0.433 |
|
35 |
0.525 |
0.544 |
0.545 |
0.437 |
|
40 |
0.534 |
0.552 |
0.558 |
0.442 |
|
45 |
0.547 |
0.561 |
0.574 |
0.445 |
|
50 |
0.561 |
0.571 |
0.59 |
0.449 |
|
55 |
0.577 |
0.583 |
0.609 |
0.452 |
|
60 |
0.594 |
0.595 |
0.628 |
0.455 |
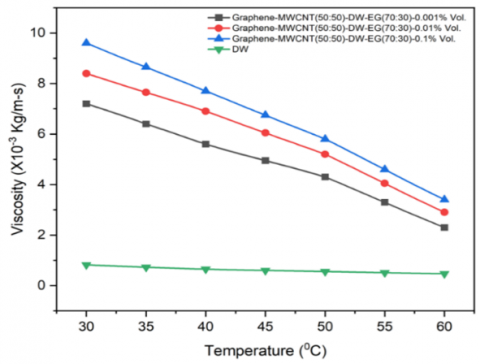
5.3 Viscosity measurement
The resistance of the fluid to deformation is evaluated by its viscosity. The viscometer is calibrated against the known values of the viscosity of Ethylene Glycol and Distilled water. The variation of viscosity of Graphene-MWCNT Nanofluid with both the concentration and temperature of the Nanofluid is shown in Figure 8. The viscosity of the fluids increases with the addition of nanoparticles into the base fluids. However, with the increase in temperature, the dynamic viscosity of the nanofluid decreases. The viscosity values of the Graphene-MWCNT/DW-EG hybrid nanofluids are depicted in Table 4.
Figure 8. Viscosity of graphene-MWCNT/DW-EG hybrid nanofluids
Table 4. Viscosity of graphene-MWCNT/DW-EG hybrid nanofluids
|
Viscosity (×10-3 Kg/m-s) |
||||
|
Temperature (℃) |
Gr-MWCNT/DW-EG (70:30) 0.001% Vol. |
Gr-MWCNT/ DW-EG (70:30) 0.01% Vol. |
Gr-MWCNT DW-EG (70:30) 0.1% Vol. |
DW-EG |
|
30 |
7.2 |
8.4 |
9.6 |
7.12 |
|
35 |
6.4 |
7.65 |
8.65 |
7.04 |
|
40 |
5.6 |
6.9 |
7.7 |
6.96 |
|
45 |
4.95 |
6.05 |
6.75 |
6.87 |
|
50 |
4.3 |
5.2 |
5.8 |
6.79 |
|
55 |
3.3 |
4.05 |
4.6 |
6.705 |
|
60 |
2.3 |
2.9 |
3.4 |
6.62 |
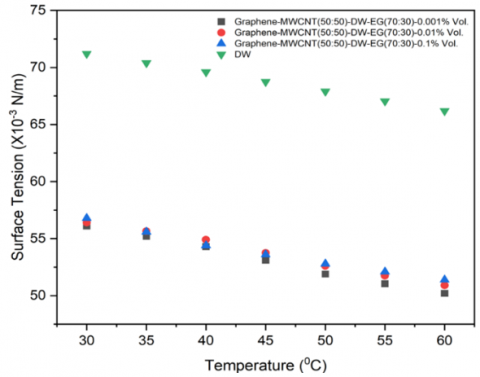
5.4 Surface tension measurement
The Figure 9 depicts the effect of temperature on the surface tension of graphene-MWCN/DW-EG (70:30) at 0.001, 0.01 and 0.1% nanofluids concentrations. The surface tension of graphene-MWCNT/ethylene glycol at 300C are 56.1 × 10³, 56.4 × 10³ and 56.8 × 10³ N/m respectively at 0.001%, 0.01% and 0.1% volume concentrations. The surface tension of graphene-MWCNT/DW-EG (70:30) nanofluids increases as the temperature rises from 30℃ to 60℃ for all tested concentrations (0.001%, 0.01% and 0.1%). The maximum surface tension was obtained at 0.1% of graphene-MWCNT/DW-EG (70:30) nanofluids concentrations at 60℃ is 51.4 × 10³ N/m. At higher temperatures, increased molecular motion reduces cohesive forces at the liquid surface, resulting in lower surface tension. The presence of nanoparticle s slightly offsets this effect, as they influence intermolecular interactions. However, the overall trend remains a gradual reduction. Higher nanoparticle concentrations show marginally lower surface tension due to enhanced surface activity an interaction between graphene and MWCNTs. This behaviour is beneficial for improving for heat transfer applications. The effect of temperature on surface tension of graphene-MWCNT/DW-EG(70:30) hybrid nanofluids values are depicted in Table 5.
Figure 9. Surface tension of graphene-MWCNT/DW-EG hybrid nanofluids
Table 5. Surface tension of graphene-MWCNT/DW-EG hybrid nanofluids
|
Surface Tension (× 103 N/m) |
||||
|
Temperature (℃ ) |
Gr-MWCNT/DW-EG (70:30) 0.001% Vol. |
Gr-MWCNT/ DW-EG (70:30) 0.01% Vol. |
Gr-MWCNT DW-EG (70:30) 0.1% Vol. |
DW-EG |
|
30 |
56.1 |
56.4 |
56.8 |
71.2 |
|
35 |
55.2 |
55.65 |
55.6 |
70.4 |
|
40 |
54.3 |
54.9 |
54.4 |
69.6 |
|
45 |
53.1 |
53.75 |
53.6 |
68.7 |
|
50 |
51.9 |
52.6 |
52.8 |
67.9 |
|
55 |
51.05 |
51.75 |
52.1 |
67.05 |
|
60 |
50.2 |
50.9 |
51.4 |
66.2 |
5.5 Contact angle
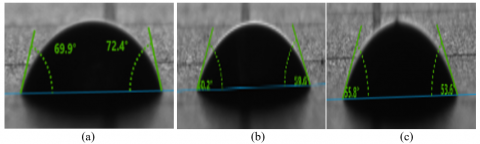
The effectiveness of nanofluids in enhancing pool boiling heat transfer primarily stems from their ability to alter surface wettability. The addition of these nanoparticles, particularly Graphene-MWCNT hybrids, changes the physical properties of the base fluid and influences the interaction between the fluid and the heated surface. One important aspect influencing pool boiling heat transfer is the contact angle formed between the nanofluid droplet and the heated surface. The contact angle, representing the wetting behavior of the fluid on the surface, plays an important role in determining the formation and detachment of vapor bubbles during boiling. Figure 10(c) shows the minimum contact angle value of 53.6° at 0.1% volume concentration of Graphene-MWCNT in distilled water with ethylene glycol whereas the contact values for 0.001% and 0.01% hybrid nanofluids volume concentration are 59.6° and 72.4°, respectively. It is observed from Figure 10 that, the lower the contact angle indicates better wetting and improved surface coverage by the nanofluid, facilitating enhanced nucleation and heat transfer. Experimental investigations have shown that Graphene-MWCNT/DW-EG hybrid nanofluids show varying contact angles depending on the concentration of nanoparticles and the surface characteristics. At lower concentrations (0.001% to 0.01%), the contact angle tends to decrease compared to pure base fluids like distilled water. This reduction suggests improved wetting behavior and increased surface coverage, promoting enhanced nucleation sites and potentially higher boiling heat transfer coefficients. Finally, it is clear that, the effectiveness of Graphene-MWCNT/DW-EG hybrid nanofluids in enhancing pool boiling heat transfer hinges on their ability to modify surface wettability. Understanding the relationship between contact angle, nanoparticle concentration, and heat transfer enhancement is important for optimizing nanofluids for specific applications.
Figure 10. Contact angles of graphene-MWCNT/DW-EG(70:30) hybrid nanofluids
5.6 Stability
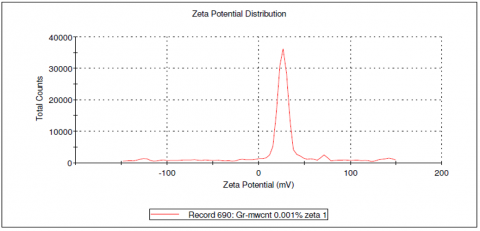
Figure 11 depicts the Zeta potential distribution in the Graphene-MWCNT in DW-EG (70:30) nanofluid at 0.001% volume concentration. The stability of Graphene-MWCNT hybrid nanoparticles based nanofluid was measured by Zeta-Potential Analyzer. Zeta potential is the charge that develops at the interface between the solid particles within a liquid medium. It is the repulsive force between two solid particles being immersed in the fluid that prevents the particles from agglomerating and thus is used to hold the particles in a suspension and stabilize the nanofluid. If the Vandar Waal’s forces dominate this repulsive force, the nanoparticles will turn into clusters and then settle down making the nanofluid unstable. Colloidal stability is reduced when the zeta potential reduces below 30 mV. It was observed from Figure 11 that, the zeta-potential value is close to 30mV at 0.001% hybrid nanofluid concentration which provides the good dispersion of the Graphene-MWCNT nanoparticles in the base fluids making the hybrid nanofluid stable. For graphene–MWCNT/DW–EG (70:30) hybrid nanofluids to have constant thermophysical characteristics and dependable heat transmission performance, stability is essential. When nanoparticles disperse uniformly over time without experiencing noticeable sedimentation or agglomeration, this is referred to as stability. By creating a stable three-dimensional structure, the combined presence of MWCNTs and graphene sheets strengthens the inter-particle network in this hybrid system, lowering sedimentation. Dispersion stability is further enhanced by the DW–EG (70:30) base fluid's superior viscosity and lower evaporation as compared to pure water. To reduce van der Waals forces and avoid clustering, surfactants are frequently used. In order to produce uniform dispersion and break down aggregates, ultrasonication was also utilized during preparation. Nevertheless, agglomeration may still occur as a result of extended storage, high particle concentration, or high operating temperatures, changing viscosity and thermal conductivity. Stability can be monitored with the aid of visual observation and routine zeta potential measurements. Although the graphene-MWCNT/DW-EG hybrid nanofluids show better stability overall than single nanoparticle systems, their long-term effectiveness in heat transfer applications depends on maintaining ideal preparation and operation conditions.
Figure 11. Stability of graphene-MWCNT in DW-EG (70:30) at 0.001% volume concentration
Prior research on single-component nanofluids, including graphene/DW and MWCNT/EG, revealed improvements in thermal conductivity of about 8–12% at 0.1 vol.%, but frequently with a notable increase in viscosity (over 25%), which limited their practical application. Hybrid nanofluids have shown better performance; for instance, Suresh et al. [25] showed ~13% enhancement for Al₂O₃–Cu/water nanofluids at comparable concentrations, while Trinh et al. [26] reported ~15% enhancement for graphene–CNT/EG nanofluids at 0.1 vol.%. Nevertheless, the majority of these systems either showed abrupt increases in viscosity or lacked stability.
On the other hand, the current investigation of graphene–MWCNT (50:50)/DW–EG nanofluids shows gains in thermal conductivity of up to approximately 18–20% at 0.1 vol.%, while the increase in viscosity is limited to less than 15%. This suggests a better balance between heat transmission and pumping power. Stability tests also exceeded many previous results by demonstrating no discernible sedimentation for over four weeks without extensive surfactant application. The proposed hybrid nanofluid formulation's uniqueness and potential for practical heat transfer applications are confirmed by its balanced performance, which shows that it offers improved thermophysical qualities when compared to both single-component and previous hybrid nanofluids.
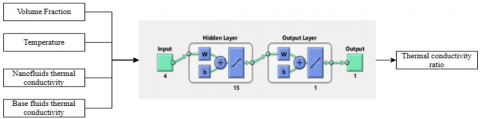
The ANN architecture consists of three layers: input, hidden, and output are displayed in Figure 12. The experimental data were divided into three data sets: training, validation, and testing. During each epoch, the model was trained to find a broad trend among the input and output parameters. Beyond training, the model validated the data for each epoch. The ANN model was created using the neural network function in MATLAB. The construction of popular neural network designs and their current engineering applications are covered by artificial neural networks. In order to make the model more realistic, a certain number of neurons and hidden layers must be selected. If the number of neurons and hidden layers is too low, the neural architecture will not be able to match the correct behavior of the input data, and if the error is too large, the training process will speed up and a local minimum will be reached. Therefore, selecting the proper neurons and hidden layers is important for the best-fit model. Each architecture is composed of neurons that function according to Eq. (6).
$z_j=\sum_{k=1}^n\left(w_{j i} x_i+b_j\right)$ (6)
Here, the weight wji$~$represents the association between neurons i and j, the bias of the j neuron is denoted by bj, and the total number of input neurons is represented by n. By using the value zj to represent the output neuron, the architecture's setting of wij$~$is produced. Determining the optimum number of neurons for the hidden layer involves a trial-and-error procedure. Using one hundred twenty experimental data points, the model was built. It is possible to collect many observations at the same concentration and temperature in order to increase the experimental data set and reduce measurement error. This keeps the model from getting too fitted. The model predicts the training set data accurately when overfitting, but it is unable to do so for the test set data. Seventy percent of the available data was used to train the network, fifteen percent was used for validation, and the remaining fifteen percent was used for testing. A hyperbolic tangent sigmoid (TANSIG) was used as the output layer's transfer function. Eq. (8) provides the formula for the transfer functions that were used.
$\operatorname{tansig}(n)=\frac{2}{\left(1+e^{-2 n}\right)}-1$ (7)
A number of statistical indicators, including mean squared error (MSE), and R2, are taken into account when determining the best model for thermal conductivity ratio. The Eqs. (9) through (10) pertaining to these parameters are listed below.
$R^2=1-\frac{\left(\sum_{i=1}^N\left(k_{\text {Exp }}-k_{\text {predicted }}\right)_i^2\right.}{\left(\sum_{i=1}^N\left(k_{\text {Exp }}\right) i^2\right.}$ (8)
$M S E=\frac{1}{N}\left(\sum_{i=1}^N\left(k_{\text {Exp }}-k_{\text {predicted }}\right)_i^2\right)$ (9)
$R^2=1-\frac{\left(\sum_{i=1}^N\left(\sigma_{\text {Exp }}-\sigma_{\text {predicted }}\right)_i^2\right.}{\left(\sum_{i=1}^N\left(\sigma_{\text {Exp }}\right) i^2\right.}$ (10)
$M S E=\frac{1}{N}\left(\sum_{i=1}^N\left(\sigma_{\text {Exp }}-\sigma_{\text {predicted }}\right)_i^2\right)$ (11)
6.1 Optimal artificial neural network architectures for graphene-MWCNT/DW-EG(70:30) hybrid nanofluids
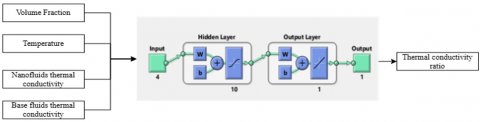
Figure 12 depicts the optimal ANN architectures for Levenberg Marquardt and SCG Machine learning models for Graphene-MWCNT/DW-EG(70:30) hybrid nanofluids. The neural network structure consists of input, hidden, and output layers, as shown in Figure 12. Neural network inputs are received at the input layer. In this layer, the number of neurons is determined based on the number of model inputs so that one neuron is considered for each input data. The second layer in a neural network is the middle (hidden) layer, which leads to training the network and generalizing previous learnings to new inputs. The third layer of a neural network is called the output layer, which identifies the output values of the network. Multilayer neural networks are useful for learning nonlinear problems and for taking multiple decisions.
Figure 12. ANN architecture for prediction of thermal conductivity ratio (a) LM, (b) SCG
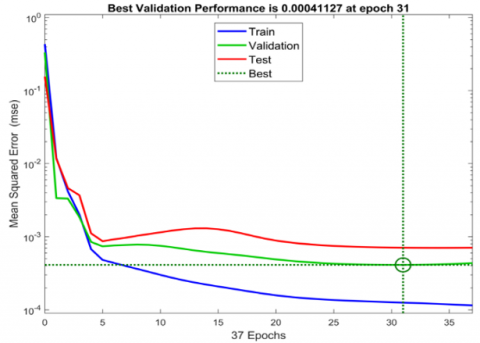
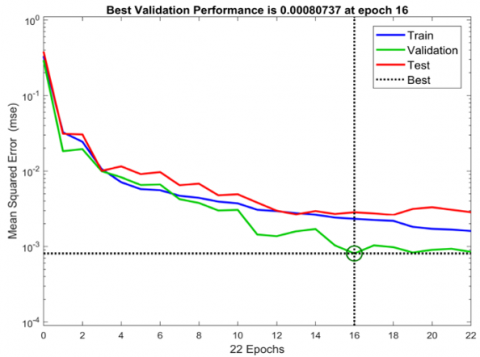
Figure 13. Best validation performance graphs for graphene/DW-EG nanofluids (a) LM, (b) SCG
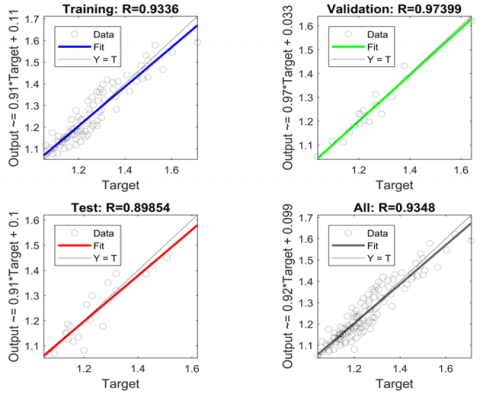
Figure 14. Regression graphs for Graphene/DW-EG Nanofluids (a) LM (b) SCG
Figure 13(a) displays the train, validation, and test data for several iterations of the Levenberg Marquardt algorithm together with the trend of changes in the MSE with respect to the predicted values of the thermal conductivity ratio. The performance validation chart, which displays the variations in MSE over the training phases, is the most effective performance indicator of the ANN training procedure. The vertical axis of the chart shows the MSE, while the horizontal axis shows the number of training loop (epoch) repeats. The MSE in the training, validation, and test points is represented by the three training curves, validation, and test in the Figure 13(a). At the beginning of the training, the MSE value is very high when the network weights are chosen at random, however, it gradually drops when the training loops are repeated. The training points in Figure 13(a) have a lower MSE than the newly added points to the system because the MSE value in the training curve after stopping is lower than the validation and test values. In Figure 13(a), the optimal stop point is represented by a green circle. The Levenberg Marquardt algorithm's lowest MSE value, based on the training diagram's lowest MSE, is 0.00041127 after 31 iterations. 31 distinct ANNs are trained in order to determine the optimal ANN for each training algorithm. The network with the least error is chosen to approximate the output function of the problem. The MSE in the training, validation and test points is represented by the three training curves, validation, and test in Figure 13(b). The validation points in this diagram have a lower MSE than the newly added points to the system because the training curve's MSE value after stopping is lower than the validation and test values. In Figure 13(b), the optimal stop point is represented by a green circle.
The SCG algorithm's lowest MSE value, based on the validation diagram's lowest MSE, is 0.00080737 after 16 iterations. Each training technique uses 16 alternative ANNs to determine which one is better. The prediction of the thermal conductivity ratio of nanofluids using LM model is more accurate as compared to the SCG model. Temperature and volume concentration have no effect on the ANN model's accuracy.
The regression diagram and coefficient of correlation between the target values and the actual output data serve as additional indicators to ensure appropriate ANN training. Figure 14 displays regression graphs for the thermal conductivity ratio parameter. The regression diagram shows the relationship between the targeted and the actual output values. The ANN's actual output values are shown on the vertical axis while the targeted values have been shown on the horizontal axis. Three parameters can be used to assess the regression diagram: the bias (B), slope (M), and coefficient of correlation value (R2). The ideal condition for the regression diagram is when the data points are on the unit-sloped bisector line, the correlation coefficient is equal to one, and the ANN's output equals the desired value. It can be seen that the produced regression diagrams slope value is really near to equally to one. The output values are near the experimental values, and the very few data points are scattered from the 45° lines.
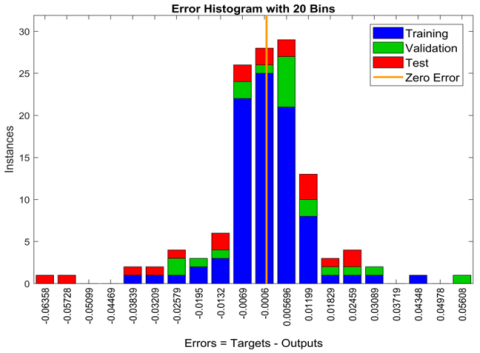
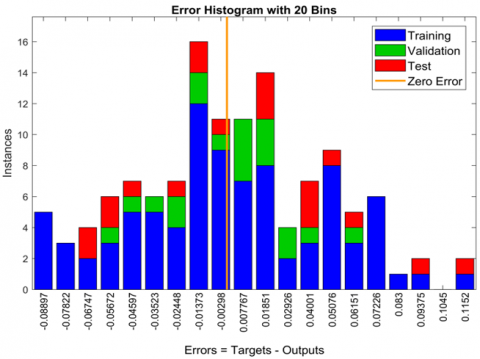
The ANN histogram error bar charts for the thermal conductivity ratio are displayed in Figure 15. This graph, which is displayed as a bar chart, indicates the frequency or quantity of errors in various error values. Error numbers are displayed on horizontal axis, while the frequency or quantity of errors in the target value is represented on vertical axis. The increasing frequency of data errors close to the zero-error line shows that the problem data is well-trained and the system has a low error rate. The output of the problem has been brought extremely close to the target by the selected strategy, as seen by the larger bar charts around the Zero-Error line, which indicate a higher numerical density. The neural network model was first trained using Levenberg-Marquardt backpropagation (LM) to get the best model for predicting the thermal conductivity ratio. The dataset was then trained using learning methods such as SCG backpropagation (SCG) [15-18]. ANN models developed using the SCG training method were contrasted with the optimal model developed by the LM training algorithm. The table shows the MSE and R2 values for the various training methods. It was shown that, the LM approach predicted the lowest MSE. The R2 value for the LM technique is nearer unity when examined in comparison to the SCG training process.
The model may not be as applicable outside of the tested parameters, even while its performance indicators, including Mean Squared Error (MSE) and the coefficient of determination (R2), show excellent predictive power within the examined range. The model was created and verified using experimental data limited to particular base fluid compositions, temperature ranges, and nanoparticle concentrations. Because unmodeled physical factors such as particle agglomeration, changes in thermophysical characteristics, extrapolating predictions to higher concentrations or noticeably wider temperature ranges may result in decreased accuracy. Furthermore, the model does not specifically take into consideration variables like the stability of nanofluids over an extended period of time, changes in heater surface properties, or modifications to heat transfer mechanisms under harsh circumstances. Thus, even though the model is a good predictor within its calibration range, using it in situations outside of the validated dataset should be done with caution. Its robustness and generalizability would be improved with more experimental data including larger parameter ranges and other affecting factors. This ensures the model's continued scientific accuracy and usefulness for actual engineering systems.
Figure 15. Histogram error graphs for graphene/DW-EG nanofluids (a) LM, (b) SCG
Knowing how the Levenberg–Marquardt (LM) and SCG algorithms work will help to explain why LM frequently produces better results when compared to SCG. A combination of gradient descent and the Gauss-Newton method, the LM algorithm offers quick convergence for medium-sized problems with well-behaved error surfaces. Because of its exceptional efficacy in nonlinear least-squares optimization, it is ideally suited for regression tasks with well-defined parameter spaces and little noise. However, for really large datasets, LM may be a restriction due to its greater memory and processing requirements. On the other hand, because the SCG technique does not require the expensive computation of the Hessian matrix, it is more memory-efficient and more appropriate for large-scale tasks. SCG may be more susceptible to local minima and converge more slowly, particularly in cases when the error surface is complicated. In some circumstances, precision is sacrificed for its reduced memory requirements. Because the dataset size in this investigation was relatively moderate and high accuracy in predicting thermal and heat transfer parameters was required, the LM model performed better. Despite having a larger computing cost than SCG, the LM algorithm's quick convergence and accurate weight tuning allowed for better prediction performance.
The purpose of the current work was to create and evaluate a DW-EG(70:30) nanofluid based on Graphene-MWCNT hybrid nanoparticles. At various volume concentrations of Graphene-MWCNT nanoparticles, the experimental study was carried out for the thermal conductivity, viscosity and surface tension, contact angle, and stability of DW-EG(70:30) based hybrid nanofluids. The thermal conductivity ratio was predicted by using an ANN model such as Levenberg Marquardt and SCG algorithm, then a comparison of the two models was done based on prediction accuracy. The experimental results shown that at 30℃ and 0.1% volume concentration, Graphene-MWCNT-based DW-EG(70:30) thermal conductivity increased by 21.01%. The zeta potential values at various volume concentrations were measured for the stability of the nanofluid which causes the thermal conductivity ratio to increase. There was one hidden layer and fifteen neurons in each layer of the developed ANN model. The performance of artificial neural network models was evaluated by mean square error and coefficient of correlation (R2). The mean square error and coefficient of correlation for Levenberg Marquardt and SCG machine learning model’s values are 4.1127 × 10⁻⁴, 8.0737 × 10⁻⁴ and 0.9903, 0.9739, respectively. The Levenberg Marquardt model gave minimum mean square error and higher coefficient of correlation values and it showed a good agreement with the experimental data for thermal conductivity ratio. The margin of deviation between the experimental and predicted data is within 1%. The formulation of graphene–MWCNT (50:50)/DW–EG hybrid nanofluids should be optimized in future studies by experimenting with different nanoparticle ratios, surfactants, and preparation methods in order to improve stability and thermal performance even more. To enhance model generalizability, experimental investigations should be extended to higher temperature ranges, higher concentrations, and a variety of base fluid compositions. Prediction accuracy under complex operating conditions can also be improved by incorporating sophisticated modeling techniques, such as hybrid AI–empirical models. For heat exchangers, cooling systems, and renewable energy applications to be practically applicable in the real world, corrosion studies, long-term stability evaluations, and hands-on system-level testing are also necessary.
|
T |
temperature, K |
|
|
k |
thermal conductivity, Wm-1K-1 |
|
|
SEM |
scanning electron microscopy |
|
|
X-RD |
X-Ray diffractometry |
|
|
LM |
Levenberg Marquardt |
|
|
SCG |
scaled conjugate gradient |
|
|
Greek symbols |
|
|
|
µ |
dynamic viscosity, Kg-m-1s-1 |
|
|
$\varphi$ |
volume fraction |
|
|
$\alpha$ |
thermal diffusivity, m2s-1 |
|
|
σ |
surface tension, Nm-1 |
|
[1] Onyiriuka, E. (2023). Predictive modelling of thermal conductivity in single-material nanofluids: A novel approach. Bulletin of the National Research Centre, 47(1): 140. https://doi.org/10.1186/s42269-023-01115-9
[2] Nayebpashaee, N., Hadavi, S.M.M. (2022). Thermal conductivity and surface tension of graphene–Al2O3/ethylene glycol–water hybrid nanofluid at sub-zero temperatures: An experimental study. Journal of Thermal Analysis and Calorimetry, 147(23): 13039-13057. https://doi.org/10.1007/s10973-022-11587-y
[3] Liu, B., Sun, L., Luo, Z., Zeinali Heris, S., Zhang, X., Yi, W. (2024). Experimental investigation of thermophysical properties of synthesized Mg–Al bimetal oxide/water nanofluid. Journal of Thermal Analysis and Calorimetry, 149(10): 5001-5016. https://doi.org/10.1007/s10973-024-13006-w
[4] Han, X., Lu, L., Yan, S., Yang, X., Tian, R., Zhao, X. (2021). Stability, thermal conductivity and photothermal conversion performance of water-based ZnO nanofluids. Journal of Thermal Science, 30(5): 1581-1595. https://doi.org/10.1007/s11630-021-1501-9
[5] Li, D., Dai, Y., Chen, X., Guo, Y. (2024). Stability and thermophysical properties of reduced graphene oxide-gold hybrid nanofluids. Russian Journal of Physical Chemistry A, 98(7): 1607-1614. https://doi.org/10.1134/S0036024424700626
[6] Azharuddin, Saini, P. (2024). Characterization, preparation and thermophysical properties investigations of aqueous AgNO3–Graphene hybrid nanofluids for heat transfer applications. International Journal of Thermophysics, 45(6): 83. https://doi.org/10.1007/s10765-024-03377-5
[7] Borode, A., Tshephe, T., Olubambi, P., Sharifpur, M., Meyer, J. (2024). Effects of temperature and nanoparticle mixing ratio on the thermophysical properties of GNP–Fe2O3 hybrid nanofluids: An experimental study with RSM and ANN modeling. Journal of Thermal Analysis and Calorimetry, 149(10): 5059-5083. https://doi.org/10.1007/s10973-024-13029-3
[8] Zaikovsky, A.V., Dmitrachkov, A.M., Morozova, M.A. (2024). Thermal conductivity, viscosity, and optical properties of nanofluids based on water and carbon nanoparticles. Thermophysics and Aeromechanics, 31(4): 781-790. https://doi.org/10.1134/S0869864324040164
[9] Momin, M., Sharifpur, M., Meyer, J.P., Murshed, S.M.S., Yasmin, H. (2025). Preparation and measurement of thermophysical and electrical properties of ZnO-MWCNT/DIW hybrid nanofluid. Journal of Thermal Analysis and Calorimetry, 150: 5007-5023. https://doi.org/10.1007/s10973-025-14072-4
[10] Bhanuteja, S., Srinivas, V., Moorthy, C.V., Jai Kumar, S., Lakshmipathi Lakshmipathi Raju, B. (2024). Prediction of thermophysical properties of hybrid nanofluids using machine learning algorithms. International Journal on Interactive Design and Manufacturing (IJIDeM), 18(9): 6559-6572. https://doi.org/10.1007/s12008-023-01293-w
[11] Zamany, M.S., Taghavi Khalil Abad, A. (2025). Statistical analysis and accurate prediction of thermophysical properties of ZnO-MWCNT/EG-water hybrid nanofluid using several artificial intelligence methods. Arabian Journal for Science and Engineering, 50(6): 4167-4176. https://doi.org/10.1007/s13369-024-09565-7
[12] Topal, H.İ., Erdoğan, B., Koçar, O., Onur, T.Ö., Öztop, H.F. (2024). Dynamic viscosity prediction of nanofluids using artificial neural network (ANN) and genetic algorithm (GA). Journal of the Brazilian Society of Mechanical Sciences and Engineering, 46(7): 429. https://doi.org/10.1007/s40430-024-05006-6
[13] Bansal, A., Sharma, G.P., Singh, R. (2023). Thermal properties of graphene oxide nanofluids. Indian Journal of Physics, 97(10): 3003-3010. https://doi.org/10.1007/s12648-023-02671-6
[14] Dosodia, A., Vadapalli, S., Jain, A.K., Mukkamala, S.B., Sanduru, B.T. (2022). Experimental studies and analytical analysis of thermophysical properties of ethylene glycol–water-based nanofluids dispersed with multi-walled carbon nanotubes. International Journal of Thermophysics, 43(12): 175. https://doi.org/10.1007/s10765-022-03106-w
[15] Masood, F., Alam, M.A., Nor, N.B.M., Irshad, K., Elamvazuthi, I., Rehman, S., Akhter, J., Zayed, M.E. (2025). Modeling and optimization of thermal conductivity of synthesized MWCNT/water nanofluids using response surface methodology for heat transfer applications. Journal of Thermal Analysis and Calorimetry, 150(1): 573-584. https://doi.org/10.1007/s10973-024-13847-5
[16] Sahin, F. (2025). Stability optimization of Al2O3/SiO2 hybrid nanofluids and a new correlation for thermal conductivity: An AI-supported approach. International Journal of Thermophysics, 46(1): 9. https://doi.org/10.1007/s10765-024-03487-0
[17] Almurtaji, S., Ali, N., Teixeira, J.A., Addali, A. (2021). Effect of preparation temperature, surfactant, and nanoparticles concentration on the effective thermophysical properties of multi-walled carbon nanotubes’ nanofluids. International Journal of Thermophysics, 42(12): 168. https://doi.org/10.1007/s10765-021-02916-8
[18] Atmaca, B., Yalçın, G., Küçükyıldırım, B.O., Arkadumnuay, T., Leunanonchai, W., Manova, S., Dalkılıç, A.S., Wongwises, S. (2024). Determination of dynamic viscosity and stability for single and hybrid nanofluids of SiO2, TiO2, MWCNT and ZnO nanoparticles. Journal of Thermal Analysis and Calorimetry, 149(12): 6715-6735. https://doi.org/10.1007/s10973-024-13163-y
[19] Shahrivar, I., Ghafouri, A., Niazi, Z., Khoshoei, A. (2023). Development of a neural architecture to predict the thermal conductivity of nanofluids. Journal of the Brazilian Society of Mechanical Sciences and Engineering, 45(12): 646. https://doi.org/10.1007/s40430-023-04555-6
[20] Huang, Y.S., Zou, C.J., Chen, M.J., Sun, H.H. (2022). Research on stability and thermal properties of SiC-MWCNT hybrid nanofluids based on thermal conductive oil. Applied Physics A, 128(9): 794. https://doi.org/10.1007/s00339-022-05934-x
[21] Akhatov, J.S., Juraev, T.I., Halimov, A.S., Karimov, T.K. (2023). A novel correlation for predicting the dynamic viscosity of nanofluids based on MWCNTs. Applied Solar Energy, 59(2): 111-117. https://doi.org/10.3103/S0003701X23600741
[22] Chalespari, S.K., Marzban, A., Toghraie, D. (2025). Experimental investigation of dynamic viscosity of water-based nanofluids containing tungsten oxide–multi-walled carbon nanotubes–zirconium oxide nanoparticles at mono and hybrid conditions. Journal of Thermal Analysis and Calorimetry, 150(4): 2503-2516. https://doi.org/10.1007/s10973-024-13756-7
[23] Namarvari, H., Razmara, N., Meneghini, J.R., Miranda, C.R. (2021). Effect of SWCNT volume fraction on the viscosity of water-based nanofluids. Journal of Molecular Modeling, 27(9): 253. https://doi.org/10.1007/s00894-021-04856-4
[24] Dong, F., Wan, J., Feng, Y., Wang, Z., Ni, J. (2021). Experimental study on thermophysical properties of propylene glycol-based graphene nanofluids. International Journal of Thermophysics, 42(4): 46. https://doi.org/10.1007/s10765-021-02798-w
[25] Suresh, S., Venkitaraj, K.P., Selvakumar, P., Chandrasekar, M. (2011). Synthesis of Al2O3–Cu/water hybrid nanofluids using two step method and its thermo physical properties. Colloids and Surfaces A: Physicochemical and Engineering Aspects, 388(1): 41-48. https://doi.org/10.1016/j.colsurfa.2011.08.005
[26] Trinh, P.V., Anh, N.N., Hong, N.T., Hong, P.N., Minh, P.N., Thang, B.H. (2018). Experimental study on the thermal conductivity of ethylene glycol-based nanofluid containing Gr-CNT hybrid material. Journal of Molecular Liquids, 269: 344-353. https://doi.org/10.1016/j.molliq.2018.08.071