Mohammed Qader Gubari*![]() | Galawesh Norri Taher
| Galawesh Norri Taher![]() | Bayan H. Al-Jaleel
| Bayan H. Al-Jaleel![]() | Aya Aws Saad
| Aya Aws Saad![]() | Ozdan Akram Ghareeb
| Ozdan Akram Ghareeb![]() | Gasheen Ibraheem Baziyani
| Gasheen Ibraheem Baziyani![]() | Mahmod A. Abdulqader
| Mahmod A. Abdulqader![]()
© 2025 The authors. This article is published by IIETA and is licensed under the CC BY 4.0 license (http://creativecommons.org/licenses/by/4.0/).
OPEN ACCESS
This work uses NF90 and NF270 nanofiltration membrane separation to remove direct dyes from aqueous solutions. DR80 and DY8 are the direct dyes used in this investigation. The textile industry releases direct dye effluent into rivers and oceans, causing several major problems. The purpose of this study is to compare the dye rejection and permeate flow performance of nanofiltration membranes (NF90 and NF270) for DR80 and DY8. The study also tested microfilter paper (MF) under 100 KPa to reject DR80 and DY8. The pH, operating pressure, and dye concentration of the original solution determine dye rejection and permeate flow. The investigation shows that NF90 and NF270 reject DR80 at 98.98% and 98.30%, respectively, between 600–1000 KPa. Additionally, DY8 rejection averages 90.18 percent and 97.1 percent. The investigation also found that both dyes had the lowest permeate flux at 1.0 g/L and the greatest at 0.2 g/L. Comparisons show that microfilter paper rejects less than nanofiltration membrane. A predicament arises from the fact that the nanofiltration membrane operates at pressures six to ten times higher than those used in microfiltration, which typically functions at approximately 100 kPa. As a result, a direct comparison between the two filtration methods may lead to misleading conclusions.
dye, permeate flux, solute rejection, alum, nanofiltration membrane
Water shortage has grown increasingly prevalent due to recurrent severe droughts and heightened demand stemming from various sources, including socio-economic development and population growth [1]. A significant issue in the industrial sector is its substantial reliance on freshwater, which may alternatively serve home needs. Nonetheless, water designated for industrial expansion across diverse sectors is at times inadequate [2]. The textile industry significantly contributes to economic development globally. Nonetheless, a major concern associated with textile factories is the discharge of untreated wastewater, especially dye-containing effluents, which are difficult to decompose and pose significant environmental challenges [3]. The textile industry releases various pollutants throughout the entire process of fibre, fabric, and clothing production. Certain dyestuffs and pigments utilised, such as dyeing bath residues, printing pastes, paints, and expired paints, are classified as hazardous waste, whereas others are categorised as non-hazardous waste [4].
Large volumes of wastewater comprising hazardous organic residues are generated during the textile and dye manufacturing processes. The complex aromatic structures of synthetic dyes, which contribute to their stability and resistance to biodegradation, make them particularly difficult to manage [5]. Due to their inherent chemical composition, dyes frequently demonstrate exceptional resistance to fading when subjected to light, water, and a variety of compounds. Basic, acid, dispersed, diazo, azo, anthraquinone-based, and complex metal dyes are among the many types of dyes. These compounds demonstrate exceptional stability, decomposing exclusively at temperatures exceeding 200℃. Consequently, synthetic dyes are a primary focus of research endeavours that are designed to create suitable treatments for textile wastewater [6].
Nanofiltration (NF) membranes are gaining recognition for their wide range of applications, such as water recycling, industrial wastewater management, and the production of potable water. NF plays a vital role in wastewater treatment, marking a noteworthy progression in membrane technology. These membranes are applicable in both aqueous and non-aqueous environments. NF membranes exhibit characteristics that lie between ultrafiltration and reverse osmosis, operating through a blend of pore-size filtration and solution-diffusion mechanisms [7]. The interaction between the membrane and the mixed liquid plays a crucial role in influencing membrane fouling. The interaction is influenced by several critical factors, including the pore size of the membrane, its material composition, and its hydrophobic characteristics [8]. Prior to membrane filtration, wastewater is subjected to pre-treatment processes that effectively remove the majority of suspended or undissolved materials, encompassing suspended solids as well as inorganic and organic compounds. This step is essential to safeguard the membrane from possible harm, considering its significant expense and the guidance provided by membrane manufacturers.
Given that residual contaminants mainly comprise dissolved heavy metal salts, it is crucial to increase the molecular size of these contaminants throughout the purification process. This method facilitates the identification of a suitable membrane filtration technique to efficiently isolate the contaminants [7]. Membrane filtration distinguishes itself from conventional filtration methods through two essential characteristics. Initially, membranes are engineered with an asymmetric configuration, allowing the feed to interact with smaller pores. This design effectively minimises the pressure drop across the membrane, thereby aiding in the prevention of clogging. Additionally, membrane systems function with a transverse flow across the membrane surface, effectively preventing the buildup of filter cakes. Generally, the accumulation or concentration polarisation occurring on the membrane is limited to just a few microns [7, 9]. The NF90 and NF270 nanofiltration membranes are composed of polyamides, featuring a molecular weight cutoff (MWCO) of approximately 100-200 and 150-300 Daltons, respectively [10]. NF270 has a relatively large pore size and a higher surface charge than NF90 [11].
The variation in the weak structure of the membrane results in differing penetration rates, with membranes that possess larger pore sizes demonstrating increased water flow, and conversely, those with smaller pores exhibiting reduced flow. Furthermore, variations in the membrane's porosity and the thickness of the polyamide layer may significantly influence the water flow in nanofiltration [12]. The application of (NF) membranes was investigated as a preliminary treatment for RO in seawater desalination. The NF membranes used in this study were NF270 and NF90 [13].
The literature indicates that the NF 90 membrane consists of an upper layer made from polyamide composition. Polyamide components contain amide and carboxyl functional groups attached to aromatic rings, which typically reduce the hydrophobicity of the membrane [14]. According to a study by [12], NF270 was less susceptible to fouling than NF90. This study aims to compare the performance of two types of nanofiltration membranes (NF90 and NF270) in rejecting two types of dyes (Direct Red 80 and Direct Yellow 8). Additionally, to evaluate the effectiveness of dye rejection through NF and microfilter paper. Furthermore, the investigation will focus on the influence of different parameters, including feed dye concentration, operating pressure, and the primary solution's pH, on the efficacy of dye rejection and permeate flux. The polymer membranes (Filmtec™)NF90 and NF270 (DuPont Water Solutions, Edina, MN, USA) are generally featured to remove high percentages of salts and organic contaminants from surface and ground water [15].
This investigation concentrated on the elimination of direct dye from an aqueous solution through the application of a nanofiltration membrane. The selection of the specific NF membrane is based on numerous studies that have documented the impact of various operating conditions of textile effluents on the performance of NF systems. Furthermore, the studies conducted in the laboratory or pilot plant demonstrated a significant potential for utilising NF in the reclamation of water and chemicals from textile effluents. This work aimed to explore the feasibility of these NF membranes, highlighting their potential for further investigation in the removal of dye.
The artificial wastewater was pretreated using alum, which is well-known for its effectiveness in dye removal. During the pretreatment process, specific amounts of alum, a color removal agent, and an anionic polymer were added [16].
2.1 Membrane
Tables 1 and 2 present the specifications of these membrane types as provided by the supplier. A thin-film polyamide NF membrane was employed in the filtration of direct dye experiments. In this study, two types of commercial thin-film polyamide (NF) membranes, NF90 and NF270, supplied by Dow Film Tec (Minneapolis, MN, USA), were utilised. The manufacturers indicate that these membranes consist of a polyamide thin-film composite, supported by a microporous polysulfone layer. The membranes arrived as flat sheet samples and were kept dry at 4℃. The Filmtec NF90 and NF270 membrane elements demonstrate remarkable efficiency in achieving high productivity while effectively eliminating a substantial amount of organic compounds, such as direct dyes.
Table 1. Properties of nanofiltration membrane type NF90
|
The Type of Membrane |
Polyamide Thin-Film Composite (TFC) |
|
pH Range, Continuous Operation |
2-11 |
|
Free Chlorine Tolerance |
<0.1 ppm |
|
Maximum Feed Flow Rate |
16 gpm (3.6 m3/hr) |
|
Maximum Feed Silt Density Index |
5 SDI |
|
pH Range, Short-Term Cleaning: |
1-12 (30min) |
|
Average Pore diameter |
0.68(nm) |
|
Maximum Operating Pressure |
600 psi (41 bar) |
|
Stabilized Salt rejection |
|
|
MWCO |
150(Da) |
|
Maximum Operating Temperature |
113F (45℃) |
|
Permeate Flux Rate |
2,000 GPD (7.6 m3/day) |
Table 2. Properties of nanofiltration membrane type NF270
|
Membrane Type |
Polyamide Thin-Film Composite (TFC) |
|
Optimum Working Temperature: |
113 F (45℃) |
|
Optimum Working Pressure: |
600 psi (41 bar) |
|
Optimum Feed Flow Rate: |
6 GPM (1.4 m3/hr) |
|
pH Range: |
2-11 |
|
Optimum Feed Silt Density Index: |
5 SDI |
|
Free Chlorine Tolerance: |
< 0.1 ppm |
|
Permeate Flux Rate: |
850 GPD (3.2 m3/day) |
|
Stabilized Salt Rejection: |
> 97.0% |
|
MWCO |
200 (Da) |
|
Average pore diameter |
0.84 (nm) |
2.2 Direct dyes
Table 3 presents the direct dyes utilised in the experiments, detailing their structures, sources, and chemical classifications. The dyestuffs were utilised in their highest commercial grades and applied as received, without any additional purification.
Table 3. Sources and chemical classification of dyes
|
Dye |
Commercial Name |
Synonyms |
Chemical Classification |
Supplier |
|
DR80 |
Direct Red 80 |
Sirius Red |
Polyazo Dyes |
Sigma-Aldrich |
|
DY8 |
Direct Yellow 8 |
Acid Yellow 186 |
Monoazo Dyes |
Sigma-Aldrich |
2.2.1 Direct Red 80
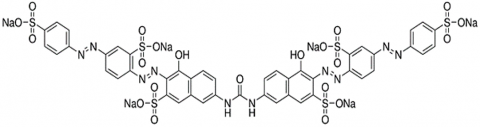
Table 4 presents the characteristics of Direct Red 80, represented by the molecular formula (C45H26N10Na6O21S6), along with its chemical properties sourced from Sigma-Aldrich, as illustrated in Figure 1.
Table 4. Properties of DR 80 dye
|
Abbreviation |
DR 80 |
|
Chemical class |
Polyazo |
|
C.I. name |
Direct Red 80 |
|
Molecular Formula |
C45H26N10Na6O21S6 |
|
Molecular weight |
1373.09 gmol-1 |
|
λmax |
527(nm) |
|
Type of dye |
Anionic |
|
C.I. number |
35780 |
|
CAS number |
2610-10-8 |
|
Dimension of molecular plate |
4.28 × 1.03 nm |
Figure 1. Structure of Direct Red 80 dye
2.2.2 Direct Yellow 8
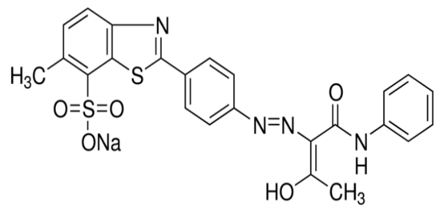
Table 5 presents the properties of Direct Yellow 8 (DY8), which has the molecular formula (C24H19N4NaO5S2). The chemical properties obtained from Sigma-Aldrich are illustrated in Figure 2. These two categories of direct dyes are utilised for the dyeing of paper, plastic, textiles, and other related products. They possess outstanding fastness properties.
Table 5. Properties of DY 8 dye
|
Abbreviation |
DY 8 |
|
Chemical class |
Monoazo |
|
C.I. name |
Direct Yellow 8 |
|
Molecular Formula |
C24H19N4NaO5S2 |
|
Molecular weight |
530.55 gmol-1 |
|
λmax |
390 nm |
|
Type of dye |
Anionic |
|
C.I. number |
13920 |
|
CAS number |
10130-29-7 |
|
Slit Width |
2 nm |
Figure 2. Structure of Direct Yellow 8
2.3 Chemicals
2.3.1 pH adjustment
In the experiments involving pretreatment and filtration, hydrochloric acid (HCl, 0.1 M) and sodium hydroxide (NaOH, 0.1 M) were employed to set the pH of the dye liquids. The membrane laboratory developed these chemical solutions.
2.3.2 Alum for pretreatment
Table 6 and Table 7 present the properties of alum and microfilter paper utilised for pretreatment. Pretreatment in the textile dyeing industry is typically aimed at removing colour from wastewater before employing alum as the coagulation agent for colour elimination.
Sushvanth et al. [17] conducted a comprehensive and critical evaluation of cutting-edge methodologies for the remediation of textile industry effluents, in response to escalating global water scarcity driven by rapid population expansion. The review delineates the inadequacies of conventional wastewater treatment modalities, including physical, chemical, and biological processes, highlighting their suboptimal efficacy in the removal of complex dye and chemical contaminants. Emphasis is placed on the emergent prominence of non-conventional separation technologies, particularly membrane distillation (MD), a thermally driven process that capitalizes on transmembrane vapor pressure differentials to achieve near-complete contaminant rejection. The discourse further interrogates the persistent challenge of membrane fouling, a critical bottleneck impeding long-term operational stability and efficiency. In addressing these constraints, the authors advocate for strategic advancements through membrane surface modification, hybrid integration with complementary treatment techniques, and scalable pathways for MD commercialization. Ultimately, the review posits that these technologically sophisticated, membrane-mediated separation systems are poised to catalyze transformative progress in the sustainable reclamation of industrial wastewater.
A specific quantity of alum was acquired from Sigma-Aldrich, prepared at a concentration of 4 g/L, which is necessary to attain the desired colour removal. Microfilter paper was sourced from Whatman International for this purpose.
Table 6. Properties of alum
|
Color |
Colorless, White |
|
Density |
1.76 gm/cc |
|
Chemical Formulas Construction |
KAl(SO4)212(H2O) |
|
Molecular Weight |
474.39 gm |
|
Synonym |
Native Alum |
Table 7. Properties of microfilter paper
|
MF. no. |
Whatman, 1441-090 |
|
Packaging |
pkg of 100 ea |
|
Limit |
0.22 psi wet burst |
|
Speed |
54 sec/100 mL (Herzberg) |
|
Diam. |
9.0 cm |
|
Thickness |
0.22 mm |
|
Ash |
0.007% |
|
Pore size |
20-25 μm (Particle retention) |
|
Basis weight |
85 g/m2 |
2.4 Methodology
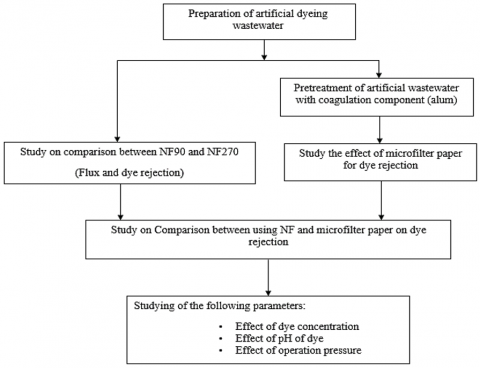
This study primarily investigates the removal of colour from textile wastewater through the use of NF membranes in controlled laboratory batch experiments. Figure 3 describes the flow chart of the comprehensive experiment conducted in this study.
Figure 3. Flow chart of the comprehensive experimental steps
2.4.1 Filtration techniques
Filtration techniques were applied using the dead-end filtration method while incorporating stirring techniques. Nitrogen was utilised to generate the pressure within the chamber. For each experiment, a specific volume of dye solution was formulated utilising distilled water. Following the addition of the solution to the cell, it was securely sealed, and the working pressure was calibrated with a pressure regulator. The dye solution nanofiltration experiments were conducted for approximately 30 minutes each. The permeability was recorded from the base of the cell at 5-minute intervals, while the total volume in the cylinder was measured continuously. The concentrations of permeate containing dyes were measured using a UV-Vis spectrophotometer over a 30-minute experimental period. (Shimadzu model 1601) at wavelengths of 527 nm for Direct Red 80 and 390 nm for Direct Yellow 8. Following each experiment, the membrane and the cell underwent a comprehensive washing process using distilled water. This study involved the use of two distinct types of membranes to evaluate their permeability and dye rejection capabilities. All experiments were conducted at ambient temperature.
2.4.2 Rejection efficiency and permeate flux calculations
The measurement formulas used in these analyses to find the dye rejection efficiency and permeability flux are given in Eq. (1) and Eq. (2) as below:
$R_d=\left(1-\frac{C_{p d}}{C_{0 d}}\right) \times 100 \%$ (1)
$v_\omega=\frac{(\Delta V)}{\Delta t . A}$ (2)
where, Rd is represents the dye rejection percentage (%), C0d is the initial dye concentration in the feed (g/L), Cpd is the dye concentration in the permeate (g/L), $v_\omega$ is the permeate flux (m/s), $\Delta V$ refers to the change in cumulative volume (m3), $\Delta t$ is the time interval (s), and A is the membrane surface area (m2).
2.4.3 The influence of operating pressure on membrane permeability
The filtration of dye was conducted under varying operating pressures of 600, 700, 800, 900, and 1000 kPa, while the initial dye concentrations were set to 0.2, 0.4, 0.6, 0.8, and 1g/L, respectively. Two types of membranes were utilised for filtration to compare their efficiencies. Permeate was gathered from the bottom cell at 5-minute intervals, and the permeate flux was documented by measuring the volume of filtrate collected after a 30-minute duration of experimentation. The dye concentration in the permeate system was assessed by comparing the absorbance of the dye to the calibration curve.
2.4.4 The influence of initial solution's pH on permeate
The pH of the dye solutions was modified through the addition of either 0.1M NaOH or 0.1M HCl. The measurement of pH levels was conducted utilising an HI-9214 temperature and pH meter. The operating pressure for these experiments was established at 600, 700, 800, 900, and 1000 kPa, with the dye concentration ranging from 0.2 to 1 g/L. The pH of the initial solutions was modified to levels of 4, 6, and 10. Permeate was collected from the bottom cell at 5-minute intervals, and the volume of filtrate was utilised to assess the permeate flux. The dye concentration in the permeate system was assessed by comparing the dye absorbance of the collected permeate over a 30-minute period with a calibration curve.
2.4.5 The influence of feed dye concentration
The feed dye concentrations in these experiments were systematically set it to 0.2, 0.4, 0.6, 0.8, and 1 g/L, with the operating pressure maintained at 600, 700, 800, 900, and 1000 kPa. Samples of permeate were collected from the bottom cell at 5-minute intervals, and the volume of filtrate gathered was utilised to document the permeate flux. The absorbance measurements of the permeate were analysed over a 30-minute period and compared to a calibration curve to ascertain the actual dye concentration in the permeate.
2.4.6 Pretreatment before membrane separation
To tackle membrane fouling challenges, it is frequently essential to pretreat dye solutions using chemical coagulants like alum. This study evaluated the impact of pre-treating dye solutions on the performance of membranes. Wastewater containing artificial dye was formulated and subsequently treated using a chemical coagulant prior to its application on the membrane. Different concentrations of Direct Red 80 and Direct Yellow 8, namely 0.2, 0.4, 0.6, 0.8, and 1.0 g/L, were employed to replicate actual dyeing wastewater. The objective was to reproduce the formulation of genuine dyeing wastewater sourced from dyeing facilities. To eliminate DR80 and DY8 dyes, 4.0 g/L of alum was incorporated into the dye solutions and agitated for 20 minutes at a speed of 200 rpm. Following the mixing process, the solution was permitted to rest for an extra 30 minutes to facilitate the precipitation of the alum-induced flocs. The precipitates obtained were subsequently extracted from the solution by employing microfilter paper for filtration.
3.1 Comparison between two types of nanofiltration membranes (NF90 and NF270)
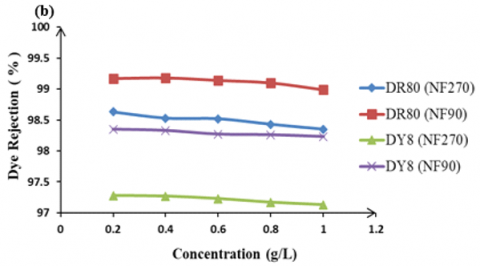
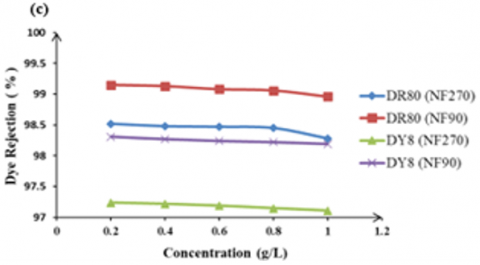
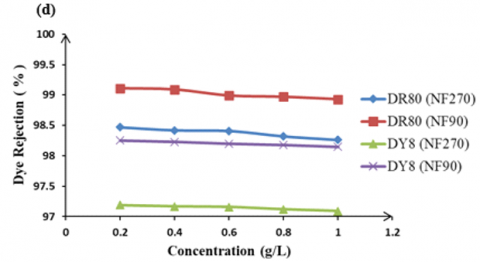
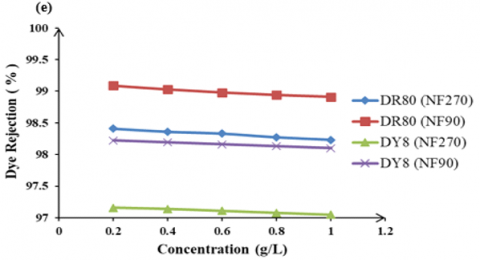
Figure 4 illustrates the changes in dye rejection for DR80 and DY8 using these two membrane types across different operating pressures and dye concentrations. Sepro NFs 6 exhibits a somewhat reduced rejection rate for Direct Red 80 and congo red compared to Sepro NFs2A, attributable to its wider membrane pore size. The rejections of these two dyes by Sepro NF 6 stabilise irrespective of varying operating pressures and dye concentrations [18].
This study investigated the removal of 1.0 g/L of Direct Red 80 (DR80) and Direct Yellow 8 (DY8) from aqueous solutions through the application of the nanofiltration process (NF90 and NF270). In these experiments, five distinct concentrations of two dye types (DR80 and DY8) were selected.
Sepro NF 6 exhibits a salt rejection rate of only 2.6% to 17.9% at a sodium chloride concentration ranging from 0.1 to 40.0 g/L. Simultaneously, these NF membranes exhibit nearly total elimination of (direct) dyes, primarily attributable to the volume extrusion mechanism [18].
The dye concentrations measured were 0.2, 0.4, 0.6, 0.8, and 1.0 g/L. The experiments were implemented at five distinct operating pressures: 600, 700, 800, 900, and 1000 kPa. A comparative analysis of the efficiency in dye removal and permeate flow for these two dye types, considering varying concentrations and operating pressures.
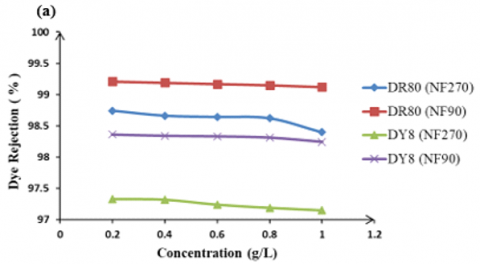
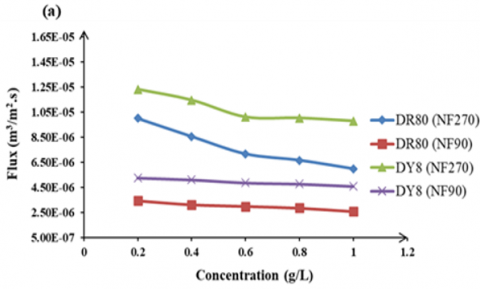
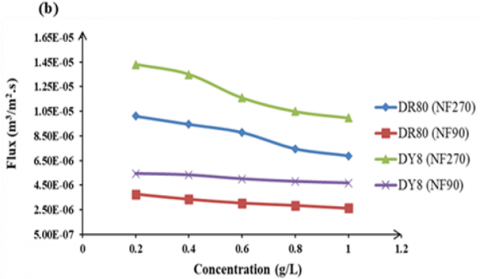
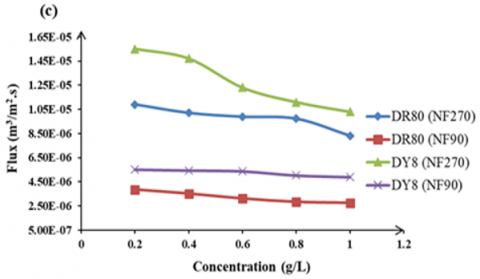
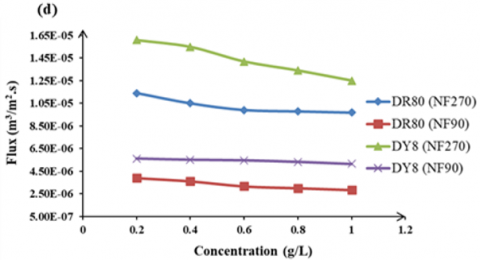
Figure 4. Dye rejection of NF90 and NF270 membranes for DR80 and DY8 at varying concentrations (0.2–1.0 g/L, pH 6) over 30 min under pressures of (a) 600, (b) 700, (c) 800, (d) 900, and (e) 1000 kPa
Figure 5 demonstrates that the NF90 membrane shows a superior removal rate of DR80 and DY8 in comparison to the NF270 membrane. The enhanced performance can be attributed to the reduced average pore size in the NF90 when compared to the NF270. The NF90 is a membrane characterised by its relatively high density, featuring an average pore diameter of 0.68 nm. Conversely, NF 270 can be considered a membrane featuring an average pore diameter of 0.84 nm [19]. Also, it can be observed that the rejection of the dye decreases with increasing dye concentration [20]. It was observed that electrostatic repulsion, effective membrane charge, and available binding sites diminish in effectiveness with an increase in the solute (dye) concentration in the feed. This phenomenon arises from the increased permeation of dye at higher concentrations, leading to a reduction in dye rejection rates. Figure 5 clearly demonstrates that dye rejection significantly diminishes with increasing pressure. Increased pressure differentials amplify the force that propels particles through the membrane pores, thereby decreasing the chances of cake formation on the membrane surface. As a result, this leads to a decreased rejection rate [21]. The significant rejection of dye can be attributed to the particle size of the two types of dyes, which were coarser than the average pore size of nanofiltration. The analysis of the permeate flux for DR80 and DY8 using these two types of membranes under different operating pressures and dye concentrations over time, along with an initial solution pH of 6.
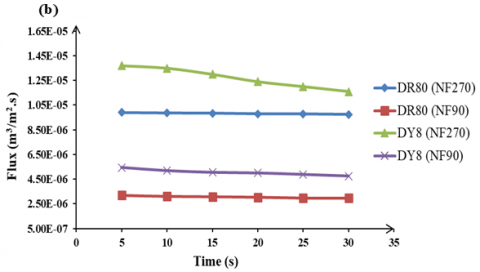
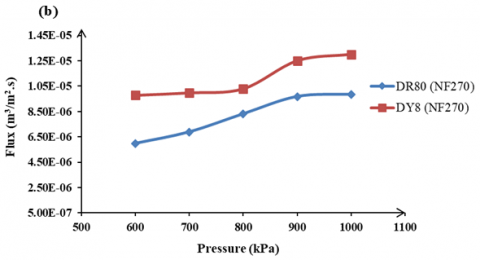
Figure 6 illustrates that the NF270 membrane demonstrates a greater permeate flux for DR80 and DY8 in comparison to the NF90 membrane, attributable to the coarser average pore size of the NF270 relative to that of the NF90 [22]. It was observed that NF90 exhibited lower flux in comparison to NF270 at the same transmembrane pressure. This can be attributed to the fact that the NF90 membrane possesses a relatively smaller pore size and lower porosity than the NF270 membrane, leading to the anticipated higher flux of NF270. It is evident from Figure 6 that the permeate flow shows a marked increase as pressure rises [23]. The findings indicate that as the operating pressure rises, the flux through the membrane also increases. This is attributed to the heightened driving force across the membrane, leading to elevated flux values. The results illustrating the dye rejection coefficient and permeate flux for DR80 and DY8 across two types of nanofiltration membranes, maintained at a constant operating pressure, a consistent dye concentration, an initial solution pH of 6, and varying experimental durations, are presented in Figure 6.
Figure 5. Permeate flux of NF90 and NF270 membranes for DR80 and DY8 at dye concentrations of 0.2–1.0 g/L (pH 6) over 30 min under pressures of (a) 600, (b) 700, (c) 800, (d) 900, and (e) 1000 kPa
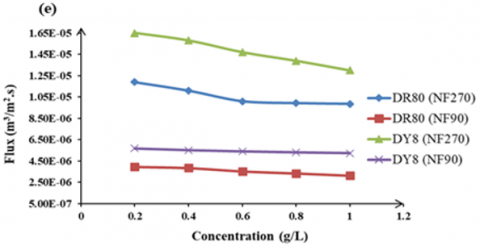
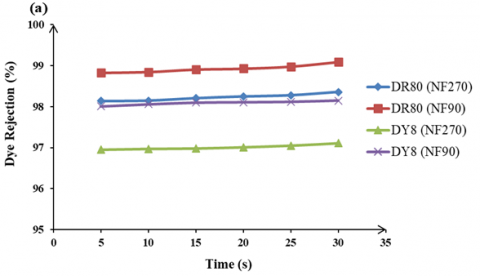
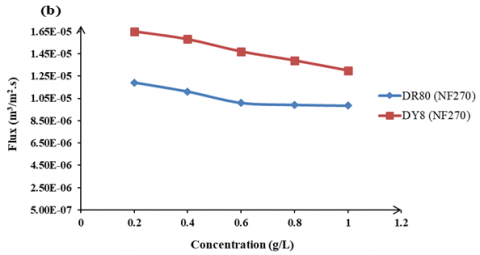
Figure 6. Comparison of NF90 and NF270 membranes for (a) dye rejection and (b) permeate flux of DR80 and DY8 at 1.0 g/L, 1000 kPa, pH 6
In nanofiltration membrane separation, concentration is a crucial factor. Generally, an increased concentration results in elevated osmotic pressure, hence reducing the permeate flux [24]. Figure 6(a) illustrates that the dye rejection rates for DR80 and DY8, when utilising both NF90 and NF270 membranes, show an increase over time. This enhancement is attributed to the formation of a fouling layer, which develops as dye is absorbed onto the membrane, thereby improving dye rejection efficiency. Conversely, Figure 6(b) illustrates that the permeate flux of DR80 and DY8, when utilising the two types of NF90 and NF270, decreased over time. This observation has also been documented by Chakraborty et al. [25]. This illustrates the variation in flow values over time under consistent concentrations of feed materials and operating pressures. The decline in permeate flow over the duration of operation is evident. This occurs as a result of concentration polarisation, resulting in heightened osmotic pressure at the membrane-solution interface and a reduction in effective driving forces (transmembrane pressure), ultimately causing a decrease in flow.
3.2 Comparison between using NF and microfilter paper on dye rejection
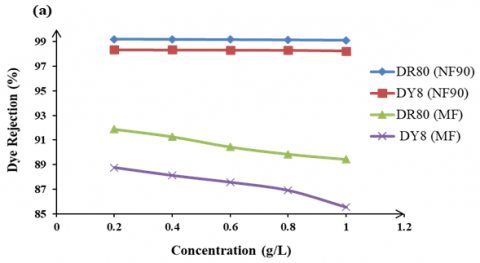
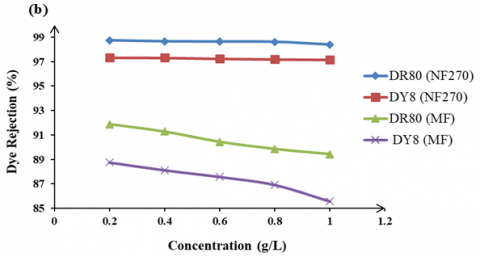
Figure 7 illustrates the comparison of NF and microfilter paper in the removal of DR80 and DY8 from an aqueous solution, as examined in these studies to analyse dye rejection.
Figure 7. Dye rejection of DR80 and DY8 using (a) NF90 vs. microfilter and (b) NF270 vs. microfilter at 0.2–1.0 g/L, 1000 kPa, pH 6 over 30 min
Dye rejection diminishes with increasing transmembrane pressure, attributable to the improved penetration of dyes across the membrane surface under greater driving force. Additionally, other aspects such as dye size and the electrostatic interaction between the dye and the membrane surface [24]. Analysis of the efficacy of NF90 and NF270 in conjunction with alum-enhanced microfilter paper for dye rejection performance concerning DR80 and DY8. In Figure 7, a decrease in rejection is noted with an elevate in dye concentration for both DR80 and DY8, following pretreatment with the addition of 4 g/L alum. The findings show that the dye rejection for DR80 using microfilter paper declined from 91.89% to 91.28% as the dye concentration rose from 0.2 g/L to 0.4 g/L. In a similar manner, for DY8 utilising microfilter paper, the dye rejection decreased from 88.76% to 88.12% with the identical change in concentration. The NF90 membrane exhibited a slight decrease in DR80 removal from 99.21% to 99.19%, while DY8 retention fell from 98.36% to 98.34% as the concentration increased from 0.2 g/L to 0.4 g/L. The rejection rate for the NF270 membrane showed a decrease in DR80 from 98.74% to 98.66%, while DY8 rejection fell from 97.33% to 97.32% under identical conditions. This indicates that both NF90 and NF270 membranes, which have average pore sizes considerably smaller than those of microfilter paper, provide enhanced rejection rates for both DR80 and DY8, averaging approximately 98.40%. Nonetheless, microfilter paper continues to be a budget-friendly choice with reduced energy demands, rendering it appropriate for scenarios where ultra-high purity is not critical.
3.3 Parameter study of two types of nanofiltration membrane
The investigation focused on the influence of operating pressure, feed dye concentration, and initial solution pH on dye removal and permeate flux for DR80 and DY8 dyes. The experiments utilised two varieties of nanofiltration membranes: NF90 and NF270.
3.3.1 The influence of operating pressure
The effect of operating pressure on dye rejection and permeate flux was investigated at various operating pressures (600, 700, 800, 900, and 1000) kPa. A constant dye concentration of 1.0 g/L was used for these experiments.
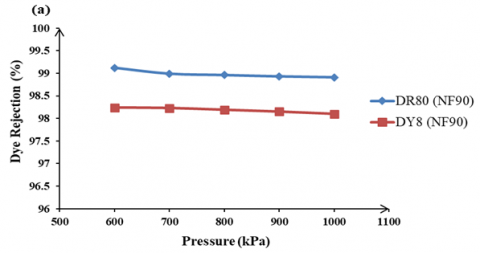
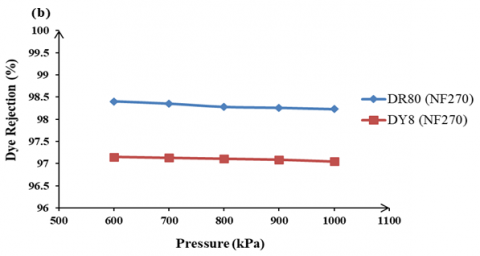
The influence of operating pressure on the dye rejection. Figure 8 describes the influence of operating pressure on the rejection of Direct Red 80 (DR80) and Direct Yellow 8 (DY8) dyes using two types of nanofiltration membranes (NF90 and NF270) at a fixed feed dye concentration of 1.0 g/L. A minor reduction in dye rejection is observed as the operating pressure increases for both membranes. Specifically, Figure 8(a) shows that for NF90, the rejection of DR80 and DY8 slightly decreased from 99.12% and 98.24% at 600 kPa to 98.99% and 98.23% at 700 kPa, respectively. Similarly, Figure 8(b) indicates that for NF270, the rejection of DR80 and DY8 declined from 98.4% and 97.15% at 600 kPa to 98.35% and 97.13% at 700 kPa, respectively.
This slight reduction in rejection performance can be attributed to the combined effects of membrane fouling, concentration polarization, and solute membrane interactions under elevated pressures. As operating, pressure increases, the permeate flux rises, causing an accumulation of dye molecules at the membrane surface a phenomenon known as con centration polarization. This localized concentration gradient can increase the likelihood of dye adsorption onto the membrane or partial pore blockage, ultimately reducing selectivity. Additionally, the elevated pressure may lead to membrane compaction or pore deformation, which could slightly enlarge the pores, allowing smaller dye molecules or degraded fragments to pass through. The higher convective flux also increases the probability of overcoming the electrostatic repulsion between the negatively charged membrane and the anionic dye molecules, resulting in reduced rejection. These findings align with observations reported by Chakraborty et al. [25], who also noted a decrease in dye retention with increasing operating pressure at the same feed dye concentration.
Figure 8. Effect of pressure (600–1000 kPa) on rejection of DR80 and DY8 using (a) NF90 and (b) NF270 at 1 g/L, pH 6 over 30 min
Figure 9. Effect of pressure (600–1000 kPa) on permeate flux of DR80 and DY8 using (a) NF90 and (b) NF270 at 1 g/L, pH 6 over 30 min
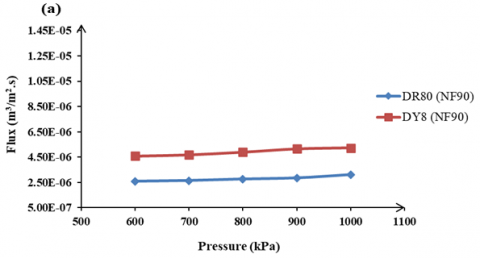
The influence of operating pressure on the permeates flux. Figure 9 shows the effect of operating pressure on the permeate flux of DR80 and DY8 using two types of NF membranes at fixed feed dye concentration.
Figure 9 illustrates that the permeate flux rises as the operating pressure increases, while maintaining a constant dye concentration. In Figure 9(a), the permeate flux for DR80 increased from 2.58E-06 m³/m².s to 2.64E-06 m³/m².s as the pressure was raised from 600 kPa to 700 kPa. Similarly, for DY8, the flux rose from 4.58E-06 m³/m².s to 4.68E-06 m³/m².s with the same pressure adjustment for the NF90 membrane. In Figure 9(b), the permeate flux for DR80 increased from 5.97E-06 m³/m².s to 6.88E-06 m³/m².s, while for DY8, it rose from 9.79E-06 m³/m².s to 9.98E-06 m³/m².s when the operating pressure was elevated from 600 kPa to 700 kPa using the NF270 membrane. This trend aligns with results from another study conducted by Shahtalebi et al. [26]. The results indicated that permeate flux rises with increasing pressure. Higher operating pressures lead to an increase in permeated flux due to the greater driving force.
3.4 The influence of feed dye (solute) concentration
The influence of feed dye concentration on dye rejection and permeate flux was examined across a range of feed dye concentrations: 0.2, 0.4, 0.6, 0.8, and 1.0 g/L. The operating pressure of 1000 kPa was selected as a fixed parameter for these experiments.
The influence of feed dye concentration on the dye rejection. Figure 10 shows the effect of feed dye concentration on the rejection of DR80 and DY8 using two types of NF membrane at fixed operating pressure.
Figure 10. Effect of dye concentration (0.2–1.0 g/L) on rejection of DR80 and DY8 using (a) NF90 and (b) NF270 at 1000 kPa, pH 6 over 30 min
Figure 10 demonstrates that the rejection of dye for DR80 and DY8 with NF90 and NF270 membranes diminishes as the concentration of dye rises while maintaining a constant operating pressure. Figure 10(a) illustrates that the rejection of DR80 dye diminished from 99.09% to 99.03% as the concentration elevated from 0.2 g/L to 0.4 g/L with NF90, while the rejection of DY8 dye decreased from 98.22% to 98.19% under the same concentration change using NF90. Additionally, Figure 10(b) illustrates that the rejection rate of DR80 dye diminished from 98.41% to 98.36% as the concentration increased from 0.2 g/L to 0.4 g/L with NF270, while the rejection rate of DY8 dye also decreased from 97.16% to 97.14% under the same concentration change using NF270 [27]. It was also noted that the initial retention of dye diminishes as the concentration of dye increases. This phenomenon can be elucidated through the concept of concentration polarisation. Concentration polarisation leads to the accumulation of solute particles on the membrane surface, which increases solute penetration through convection across the membrane. Consequently, at first, the permeate concentration rises swiftly, resulting in a significant drop in dye rejection.
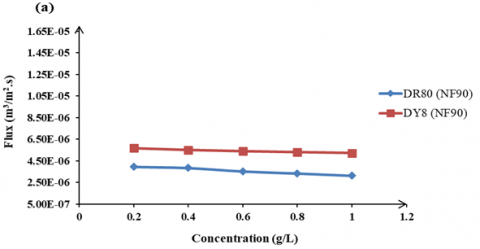
Figure 11. Effect of dye concentration (0.2–1.0 g/L) on permeate flux of DR80 and DY8 using (a) NF90 and (b) NF270 at 1000 kPa, pH 6 over 30 min
The influence of feed dye concentration on the permeate flux. Figure 11 describes the impact of feed dye concentration at a constant operating pressure on the permeate flux. Figure 11 illustrates a clear trend where the permeate flux diminishes with an elevate in the feed dye concentration. Figure 11(a) illustrates that with the NF90 membrane, the flux of DR80 decreased from 3.96E-06 m³/m².s to 3.85E-06 m³/m².s as the concentration elevated from 0.2 g/L to 0.4 g/L, while the flux of DY8 decreased from 5.68E-06 m³/m².s to 5.52E-06 m³/m².s under the same conditions. In a similar manner, Figure 11(b) demonstrates that the flux of DR80 with the NF270 membrane decreased from 1.19E-05 m³/m².s to 1.11E-05 m³/m².s as the concentration elevated from 0.2 g/L to 0.4 g/L. Additionally, the flux of DY8 reduced from 1.65E-05 m³/m².s to 1.58E-05 m³/m².s for the same change in concentration. Similar findings were noted by Wei et al. [27]. This clearly shows that when the dye concentration in the feed elevated, the flux decreased. This was due to clogging of the membrane pores and fouling of the membrane. As the feed concentration increased, more dye particles collected on the membrane surface. Furthermore, the features of NF membranes, including thickness and nanoparticle integration, profoundly influence efficiency, flux, and rejection rates, consequently highlighting the critical significance of membrane design and composition in the removal of contaminants of emerging concern [28].
3.5 The influence of initial solution's pH
The impact of the initial solution's pH on dye rejections and permeate flux was examined across different pH levels of 4, 6, and 10. A parameter of 600 kPa and a feed concentration of 1g/L were selected for the experimental process.
3.5.1 The influence of initial solution's pH on the dye rejection
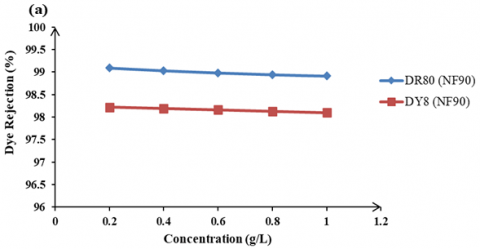
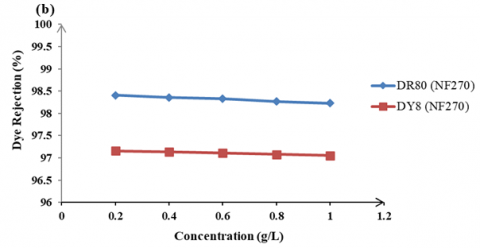
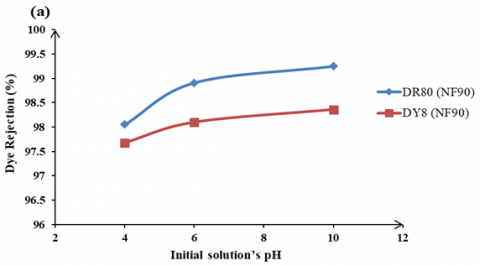
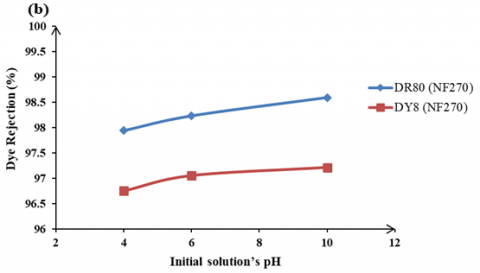
The influence of pH plays an important role in the removal of the dye by nanofiltration, as it affects the charge of the dye molecules and the characteristics of the membrane [21]. Figure 12 demonstrates the impact of the initial pH of the solution on dye rejection for two varieties of nanofiltration membranes, DR80 and DY8, while maintaining a constant operating pressure. Figure 12(a) illustrates that the dye rejection for DR80 rose from 98.05% to 99.25%, while for DY8, it increased from 97.68% to 98.36% as the initial solution's pH was elevated from 4 to 10 for NF90. Furthermore, it is evident in Figure 12(a) that the dye rejection for DR80 rose from 97.94% to 98.59%, while for DY8, it increased from 96.75% to 97.21% as the initial solution's pH was raised from 4 to 10 for NF270 [29] observed that increasing the pH of the initial dye solution resulted in increased dye removal.
Figure 12. Effect of initial pH (4, 6, 10) on rejection of DR80 and DY8 using (a) NF90 and (b) NF270 at 600 kPa, 1.0 g/L over 30 min
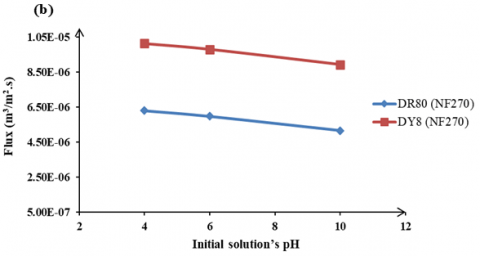
3.5.2 The influence of initial solution's pH on the permeate flux1
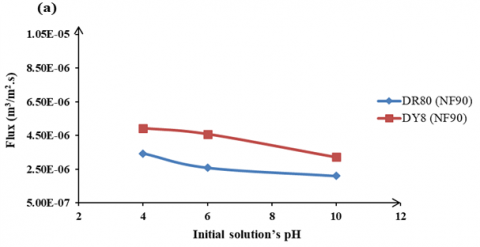
Figure 13 describes the impact of the initial pH of the solutions on the permeate flux for DR80 and DY8 dyes, utilising two distinct types of nanofiltration membranes while maintaining a constant operating pressure. Figure 13 illustrates that the permeate flux for DR80 diminished as the initial solution pH increased. Figure 13(a) illustrates a decline in permeate flux, with values dropping from 3.42E-06 m3/m2.s to 2.10E-060m3/m2.s for NF90 of DR80, and from 4.93E-06 m3/m2.s to 3.21E-06 m3/m2.s for NF90 of DY8, as the solution's pH is raised from 4 to 10. Conversely, Figure 13(b) illustrates a noticeable decline in the permeate flux, which drops from 6.30E-06 m3/m2.s to 5.15E-06 m3/m2.s for NF270 of DR80, and from 1.01E-05 m3/m2.s to 8.92E-06 m3/m2.s for NF270 of DY8, as the pH of the solution is raised from 4 to 10. Raising the pH correlates with a rise in the negative charge within the solution. The accumulation of larger negatively charged particles would impede the permeability of other particles due to electrical repulsion. Consequently, the flux is anticipated to change inversely with the pH value of the solution, as illustrated in Figure 13. Similar findings were noted by Kadhim et al. [30]. They investigated the impacts of pH of initial dye solution on the permeate flux and found that as pH of the solution increases, the permeate flux decreases.
Figure 13. Effect of initial pH (4, 6, 10) on rejection of DR80 and DY8 using (a) NF90 and (b) NF270 at 600 kPa, 1.0 g/L over 30 min
The observed low diversion efficiency, ranging from 0.9% to 2.8%, suggests limited dye passage into the permeate stream under the tested conditions. This relatively low value can be attributed to the tight molecular weight cut-off and effective charge-based repulsion mechanisms of the NF membranes used in this study. Comparable investigations have reported similar trends. For instance, Chakraborty et al. [25] observed dye leakage below 5% during nanofiltration of synthetic textile effluents at comparable feed concentrations and operating conditions. Likewise, Al-Amoudi and Lovitt [31] reported diversion efficiencies under 3% when treating dye-laden wastewater using tight NF membranes, particularly under optimized pH and pressure conditions. These findings suggest that the diversion efficiency obtained in this study is within the expected range for NF membranes operating under similar parameters and reinforces the membranes' capability for effective dye retention.
This study examined the performance of two nanofiltration (NF) membranes, NF90 and NF270, for the treatment of two synthetic dyes, Direct Red 80 (DR80) and Direct Yellow 8 (DY8), under varying operational conditions. The key findings are summarized as follows:
[1] Wang, H., Bracciano, D., Asefa, T. (2020). Evaluation of water saving potential for short-term water demand management. Water Resources Management, 34: 3317-3330. https://doi.org/10.1007/s11269-020-02615-3
[2] Saidan, M.N. (2020). Estimation of industrial water demand and reclamation in Jordan: A cross-sectional analysis. Water Resources and Industry, 23: 100129. https://doi.org/10.1016/j.wri.2020.100129
[3] Yaseen, D., Scholz, M. (2019). Textile dye wastewater characteristics and constituents of synthetic effluents: A critical review. International Journal of Environmental Science and Technology, 16: 1193-1226. https://doi.org/10.1007/s13762-018-2130-z
[4] Hynes, N.R.J., Kumar, J.S., Kamyab, H., Sujana, J.A.J., Al-Khashman, O.A., Kuslu, Y., Ene, A., Kumar, B.S. (2020). Modern enabling techniques and adsorbents-based dye removal with sustainability concerns in the textile industrial sector: A comprehensive review. Journal of Cleaner Production, 272: 122636. https://doi.org/10.1016/j.jclepro.2020.122636
[5] Wang, X., Jiang, J., Gao, W. (2022). Reviewing textile wastewater produced by industries: Characteristics, environmental impacts, and treatment strategies. Water Science and Technology, 85: 2076-2096. https://doi.org/10.2166/wst.2022.088
[6] Dawood, S., Sen, T.K. (2012). Removal of anionic dye Congo red from aqueous solution by raw pine and acid-treated pine cone powder as adsorbent: Equilibrium, thermodynamic, kinetics, mechanism and process design. Water Research, 46(6): 1933-1946. https://doi.org/10.1016/j.watres.2012.01.009
[7] Abdel-Fatah, M.A. (2018). Nanofiltration systems and applications in wastewater treatment: Review article. Ain Shams Engineering Journal, 9(4): 3077-3092. https://doi.org/10.1016/j.asej.2018.08.001
[8] Nittami, T., Hitomi, T., Matsumoto, K., Nakamura, K., Ikeda, T., Setoguchi, Y., Motoori, M. (2012). Comparison of polytetrafluoroethylene flat-sheet membranes with different pore sizes in application to submerged membrane bioreactor. Membranes, 2(2): 228-236. https://doi.org/10.3390/membranes2020228
[9] Abd El-Ghaffar, M., Tieama, H.A. (2017). A review of membranes classifications, configurations, surface modifications, characteristics and its applications in water purification. Chemical and Biomolecular Engineering, 2(2): 57-82. https://doi.org/10.11648/j.cbe.20170202.11
[10] Jadhav, S., Häyrynen, P., Marathe, K., Rathod, V., Keiski, R., Yadav, G. (2018). Experimental and modeling assessment of sulfate and arsenic removal from mining wastewater by nanofiltration. International Journal of Chemical Reactor Engineering, 16(1): 20160103. https://doi.org/10.1515/ijcre-2016-0103
[11] Ramdani, A., Deratani, A., Taleb, S., Drouiche, N., Lounici, H. (2021). Performance of NF90 and NF270 commercial nanofiltration membranes in the defluoridation of Algerian brackish water. Desalination and Water Treatment, 212: 286-296. https://doi.org/10.5004/dwt.2021.26680
[12] Ong, C.S., Lau, W.J., Ismail, A.F. (2012). Treatment of dyeing solution by NF membrane for decolorization and salt reduction. Desalination and Water Treatment, 50(1-3): 245-253. https://doi.org/10.1080/19443994.2012.719473
[13] Adda, A., Hanini, S., Bezari, S., Laidi, M., Abbas, M. (2022). Modeling and optimization of small-scale NF/RO seawater desalination using the artificial neural network (ANN). Environmental Engineering Research, 27(2): 200383. https://doi.org/10.4491/eer.2020.383
[14] Hassani, A., Mirzayee, R., Nasseri, S., Borghei, M., Gholami, M., Torabifar, B. (2008). Nanofiltration process on dye removal from simulated textile wastewater. International Journal of Environmental Science & Technology, 5: 401-408. https://doi.org/10.1007/BF03326035
[15] Farsi, C., Amroune, S., Moussaoui, M., Mohamad, B., Benkherbache, H. (2019). High-gradient magnetic separation method for weakly magnetic particles: An industrial application. Metallophysics and Advanced Technologies (Metallofizika i Noveishie Tekhnologii), 41(8): 1103-1119. https://doi.org/10.15407/mfint.41.08.1103
[16] Mo, J.H., Lee, Y. H., Kim, J., Jeong, J.Y., Jegal, J. (2008). Treatment of dye aqueous solutions using nanofiltration polyamide composite membranes for dye wastewater reuse. Dyes and Pigments, 76(2): 429-434. https://doi.org/10.1016/j.dyepig.2006.09.007
[17] Reddy, A.S., Kalla, S., Murthy, Z.V.P. (2022). Textile wastewater treatment via membrane distillation. Environmental Engineering Research, 27(5): 210228-210220. https://doi.org/10.4491/eer.2021.228
[18] Lin, J., Ye, W., Zeng, H., Yang, H., Shen, J., Darvishmanesh, S., Luis, P., Sotto, A., Van der Bruggen, B. (2015). Fractionation of direct dyes and salts in aqueous solution using loose nanofiltration membranes. Journal of Membrane Science, 477: 183-193. https://doi.org/10.1016/j.memsci.2014.12.008
[19] Zhu, L. (2015). Rejection of organic micropollutants by clean and fouled nanofiltration membranes. Journal of Chemistry, 2015(1): 934318. https://doi.org/10.1155/2015/934318
[20] Gecol, H., Ergican, E., Fuchs, A. (2004). Molecular level separation of arsenic (V) from water using cationic surfactant micelles and ultrafiltration membrane. Journal of Membrane Science, 241: 105-119. https://doi.org/10.1016/j.memsci.2004.04.026
[21] Hairom, N.H.H., Mohammad, A.W., Kadhum, A.A.H. (2014). Nanofiltration of hazardous Congo red dye: Performance and flux decline analysis. Journal of Water Process Engineering, 4: 99-106. https://doi.org/10.1016/j.jwpe.2014.09.008
[22] Xaba, B.M., Modise, S.J., Okoli, B.J., Monapathi, M.E., Nelana, S. (2020). Characterization of selected polymeric membranes used in the separation and recovery of palladium-based catalyst systems. Membranes, 10(8): 166. https://doi.org/10.3390/membranes10080166
[23] Mondal, S., Purkait, M.K., De, S. (2018). Advances in Dye Removal Technologies. Springer. https://doi.org/10.1007/978-981-10-6293-3
[24] Akbari, A., Remigy, J.C., Aptel, P. (2002). Treatment of textile dye effluent using a polyamide-based nanofiltration membrane. Chemical Engineering and Processing: Process Intensification, 41(7): 601-609. https://doi.org/10.1016/S0255-2701(01)00181-7
[25] Chakraborty, S., Purkait, M., DasGupta, S., De, S., Basu, J. (2003). Nanofiltration of textile plant effluent for color removal and reduction in COD. Separation and Purification Technology, 31(2): 141-151. https://doi.org/10.1016/S1383-5866(02)00177-6
[26] Shahtalebi, A., Sarrafzadeh, M., Montazer, R.M. (2011). Application of nanofiltration membrane in the separation of amoxicillin from pharmaceutical wastewater. Journal: Iranian Journal of Environmental Health Science and Engineering (IJEHSE), 8(2): 109-116.
[27] Wei, X., Wang, S., Shi, Y., Xiang, H., Chen, J. (2014). Application of positively charged composite hollow-fiber nanofiltration membranes for dye purification. Industrial & Engineering Chemistry Research, 53(36): 14036-14045. https://doi.org/10.1021/ie5017688
[28] Kim, S., Jun, B.M., Jung, B., Park, C.M., Jang, M., Nam, S.N., Yoon, Y. (2025). Removal of contaminants of emerging concern by membranes in water and wastewater: An updated review. Environmental Engineering Research, 30(1): 240100-240103. https://doi.org/10.4491/eer.2024.103
[29] Abid, M.F., Zablouk, M.A., Abid-Alameer, A.M. (2012). Experimental study of dye removal from industrial wastewater by membrane technologies of reverse osmosis and nanofiltration. Journal of Environmental Health Science and Engineering, 9: 17. https://doi.org/10.1186/1735-2746-9-17
[30] Kadhim, R.J., Al-Ani, F.H., Al-shaeli, M., Alsalhy, Q.F., Figoli, A. (2020). Removal of dyes using Graphene Oxide (GO) mixed matrix membranes. Membranes, 10(12): 366. https://doi.org/10.3390/membranes10120366
[31] Al-Amoudi, A., Lovitt, R.W. (2007). Fouling strategies and the cleaning system of NF membranes and factors affecting cleaning efficiency. Journal of Membrane Science, 303(1-2): 4-28. https://doi.org/10.1016/j.memsci.2007.06.002