Peter Sahupala![]() | Reinyelda D. Latuheru*
| Reinyelda D. Latuheru*![]()
© 2025 The authors. This article is published by IIETA and is licensed under the CC BY 4.0 license (http://creativecommons.org/licenses/by/4.0/).
OPEN ACCESS
This study aims to design and implement a micro-hydro power plant (MHPP) using a cross-flow turbine driven by hydrant pump pressure as an alternative energy solution in remote areas. The implementation site is Wonorejo Village, Merauke, which lacks access to the national electricity grid. The system is designed to generate electricity by converting pressurized water flow into mechanical energy and subsequently into electrical energy using a 12-Volt alternator. Test results show that the system is capable of producing an average output power of 480 Watts with a water flow rate of 20 liters/second under 2 bar pressure. The total system efficiency is recorded at 53.5%, including both turbine and alternator conversion efficiency. The system provides electricity for 8 households, enabling basic lighting and battery charging. Compared to the initial condition of zero electrification, the MHPP implementation shows a 100% increase in energy access, and reduces operational lighting costs based on diesel generators by 65%. Additionally, technical training sessions improved local residents’ understanding by 80%, as measured by pre- and post-training assessments. This study demonstrates that pump-pressure-based micro-hydro systems are practical, efficient, and sustainable solutions for non-electrified villages, with further potential when integrated into hybrid systems.
hydrant pump, alternator, turbine, water reservoir, kinetic energy, electrical energy, Merauke
In today's world, electrical energy is essential for many things, including communications, homes, and business. Nevertheless, many isolated places still lack adequate access to electricity. Using renewable energy sources, such microhydros, which use water flow to autonomously and sustainably create electricity, is one possible answer [1].
Systems known as micro-hydro power plants (MHP) employ the kinetic energy of flowing water to propel a waterwheel or turbine, which in turn powers a generator to generate electricity. Areas with a steady supply of water, such a river or irrigation, are ideal for this system. When compared to fossil fuel-based power facilities, micro-hydro's primary benefits are its high efficiency, cheap running costs, and negligible environmental impact.
This system's design generates power by use of a water wheel mechanism that is coupled to a DC generator. To maximize its kinetic energy, water is sent to the wheel via pipes and a specialized funnel. Kinetic energy will be transformed into mechanical energy by the rotating wheel, and the generator will subsequently transform that mechanical energy into electrical energy. The system is stabilized by the brick and sand foundations and the strong iron frame framework. Applying this technique in places without rivers or other water sources with enough discharge, however, presents difficulties. Other options are required in these circumstances in order to generate sufficient water potential energy to turn the wheel. Using hydrant pumps as artificial water flow drivers and pressure differentials in water reservoirs are two such strategies [2].
In many isolated places, particularly those that are distant from the main electrical grid, the issue of electricity availability continues to be a significant obstacle. These regions frequently have trouble accessing dependable energy sources because of their remote locations and inadequate electrical infrastructure. Utilizing renewable energy sources, such as micro-hydro power plants (MHP), which use water flow to autonomously and sustainably create electricity, is one extensively explored alternative. However, not all regions have the kind of rivers or irrigation channels that provide the steady and powerful water flow required to power turbines or water wheels in traditional micro-hydro systems. This approach is frequently not directly applicable in regions with flat terrain or few water sources. Furthermore, the dry season or other environmental changes frequently cause oscillations in the discharge of natural water resources, which might impact the reliability of the electrical supply [3].
In order to overcome this obstacle, a system that can generate an artificial water flow with enough pressure to power the electric generator and water wheel must be developed. The usage of a hydrant pump as a water flow driver and the reservoir's pressure differential are two potential alternatives. By using this technique, even in the absence of direct river flow, water may be pushed into a reservoir that is positioned at a specific height, producing gravitational potential energy that can power the water wheel. Water is raised from a low water source to a reservoir at a specific height by the hydrant pump.
Water from the reservoir can be transported through pipes to the water wheel at a pressure and speed high enough to power the generator by using gravity and the pressure differential. This system is appropriate for use in places with limited natural flowing water resources because it enables micro-hydro power plants to function independently without depending on river flow [4].
This study's main concern is how to use a hydrant pump's flow pressure to create a micro-hydro power plant with a cross-flow turbine. Increasing Conversion Efficiency is a concept and strategy used to address these issues and goals. One strategy is to boost the effectiveness of energy conversion from water pressure produced by the hydrant pump into electrical energy. This can be accomplished by using advanced technology, such as Francis turbines or Pelton turbines, that are compatible with the hydrant pump's operating conditions, optimizing the design of the turbine or generator connected to the hydrant pump to maximize energy extraction from water pressure, and paying attention to the characteristics of the water flow and the speed of the turbine rotation to select or design the appropriate turbine. Water Availability Management one of the main issues with micro-hydro power plant operation is water availability. The creation of a water buffer system that can store water for use during times of low flow and the application of clever water management strategies to guarantee effective use of the available water resources are two ways to deal with this issue.
In order to channel water to the water wheel through a conduit with flow control utilizing a valve and water funnel, this system is made to use the water pressure from a reservoir that is positioned at a specific height. Despite not coming straight from the river flow, the water still has enough kinetic energy to propel the water wheel with this pressure differential. To maintain the system's water supply, a hydrant pump can also be utilized to raise water to the reservoir.
One kind of water turbine found in hydroelectric power facilities is the cross flow turbine. The distinctive design of this turbine sets it apart from other water turbines like Francis or Pelton turbines because it permits water to flow through it in two directions that are perpendicular to one another. The turbine was selected due to its cross flow turbine features, such as design, the blades of cross flow turbines are arranged radially around a horizontal shaft. The turbine generates a rotating force on the shaft as water flows in from one side and out of the other. Effectiveness, Cross flow turbines can attain good efficiency levels, especially for small to medium scale applications, even though their efficiency is generally lower than that of some other forms of water turbines, such Francis turbines. Adaptability, Cross flow turbines can be employed in hydroelectric power plants of all sizes, from micro hydro to bigger facilities. Suitable for Limited Water Flow: Cross flow turbines can function well in situations when there is little water flow or when the water levels are relatively low. Because of this, it can be used in canals or small rivers with little water discharge. Easy Maintenance: Because of their straightforward design, cross flow turbines are typically simpler to fix and maintain than some other kinds of water turbines. Good Controllability: Cross flow turbines can be adjusted to manage changes in water flow, enabling steady and dependable operation. Numerous Uses: Cross flow turbines can be employed in a number of industrial settings, such as water pump drive or small-scale hydroelectric power generation [5].
Even though cross flow turbines offer a number of benefits, choosing the best kind of turbine requires consideration of a number of variables, including energy needs, investment prices, technology availability, and water flow characteristics.
Like in many other rural or isolated parts of Indonesia, the construction of micro-hydro power plants in the Merauke area holds great promise for giving local residents access to sustainable, reasonably priced, and ecologically friendly electricity. The construction of micro-hydro power plants in the Merauke region requires careful consideration of a number of factors, one of which is hydro potential. Because the region is primarily lowland, it may have less hydro potential than regions with more hilly or mountainous terrain. Nonetheless, on a suitable size, micro-hydro power facilities can still benefit from the potential of small rivers or local water flows [6].
The novelty of this research lies in the integration of the micro-hydro power generation system with a water pressure control mechanism based on a reservoir and a hydrant pump. This approach allows the micro-hydro system to be applied in areas that do not have natural flowing water sources, thus expanding the scope of application of this renewable energy technology. Thus, this system not only provides an electrification solution in remote areas but also contributes to the development of sustainable energy technology that is more flexible and adaptive to environmental conditions.
Differences between Hydrant Pump-Based Microhydro Power Generation Systems and Conventional Microhydro Technology:
1. Water Pressure Source and Mechanism
a. This system uses a hydram pump as a pressure source, instead of utilizing natural pressure from gravity as in conventional microhydro. Hydrant pumps allow water to be lifted to a certain height without electricity, then the back pressure of the water is used to drive the turbine.
b. Conventional microhydro technology generally requires a location with a fairly large head (water fall height) naturally, such as mountain rivers or irrigation channels with significant elevation differences.
2. Location Suitability
a. This system is suitable for application in flat areas, which are usually not suitable for conventional microhydro systems because they do not have natural head. With a hydrant pump, artificial head can be created.
b. Conventional microhydro is limited only to areas that have certain geographical characteristics (sufficient elevation).
3. System Efficiency
a. Because it involves two energy conversions (mechanical in the hydrant pump and then in the turbine), the total efficiency is slightly lower than the conventional single-stage system.
b. However, its advantages are low investment cost and no external electricity required for pumping, making it a viable solution for areas without access to electricity.
4. Design and Components
a. The system uses:
i. 2 inch hydrant pump
ii. ½ inch outlet pipe to generate water pressure
iii. Crossflow turbine rotating at around 150-350 rpm
iv. 12V alternator for electricity generation
b. The design is modular and portable, requiring no large infrastructure such as small dams or long penstocks.
5. Application and Sustainability
a. The system is well suited for household or small community scale (≤500 Watt).
b. Can be combined with water storage, reservoir, or irrigation systems – making it a multifunctional system (water + electricity).
c. Easy to maintain and built by local communities with little technical training.
The micro-hydro power generation system based on pressure from a hydrant pump is an innovation that allows the use of water energy in flat and remote areas, which were previously uneconomical to install conventional micro-hydro. With a cost-effective, simple, and adaptive design, this system presents a sustainable alternative for villages in areas with water sources but without significant elevation.
With the aid of hydrant pumps, this study created a micro-hydro power generation system based on reservoir pressure variations in order to address these issues. Despite the lack of a natural water source, this idea seeks to produce an artificial water flow strong enough to power electric generators and water wheels.
This strategy makes it possible to use micro-hydro power generation more extensively, even in places without a steady river flow. Furthermore, because the water discharge may be adjusted as necessary without depending on external factors, this system provides flexibility [7].
This invention offers a more adaptable and sustainable electrification solution by enabling the micro-hydro power generating system to be used more extensively in a range of geographic settings. It is envisaged that the use of this micro-hydro system will provide an environmentally beneficial electrical energy source, particularly for places that are not served by the main electrical grid. Furthermore, the use of this technology can promote a broader adoption of renewable energy sources to promote energy security and environmental sustainability.
Micro-hydro Power Plants (MHP) are small-scale power generation systems that utilize the potential and kinetic energy of water to generate electricity. In general, MHPs are designed to generate power up to 100 kW and are very suitable for use in rural areas, especially areas that have not been reached by the national electricity grid.
Based on the energy conversion concept, this technology rotates a turbine that is connected to a generator or alternator by using variations in head and water flow. After that, the turbine's mechanical energy is transformed into electrical energy. Compared to fossil fuel-based power plants, MHPs have the advantages of being independent, ecologically beneficial, and having comparatively low running costs [8].
MHPs are included in the renewable energy category because they utilize the natural water cycle. Since micro-hydro doesn't emit carbon dioxide like thermal power plants do, it's a technology that helps achieve the goal of a sustainable energy transition. Additionally, MHPs are ideal for providing isolated populations with electricity without requiring them to rely on outside energy sources because they employ local resources like rivers, irrigation channels, or even little waterfalls. Several microhydro implementations in Indonesia have shown success in increasing electricity access in remote areas, while encouraging local economic growth and productive community activities [9].
A common water-based power generation system used to supply electricity in remote locations is the PLTMH [8]. This method generates electrical energy by using the flow of water to power a turbine or water wheel that is connected to a generator. Compared to fossil fuel power plants, the microhydro system has advantages in terms of energy efficiency, low operating costs, and minimal environmental impact. But the biggest obstacle to putting microhydro into practice is finding enough water flow, particularly in places without rivers or other water sources that discharge consistently throughout the year [9]. A common water-based power generation system used to supply electricity in remote locations is the PLTMH [8]. This method generates electrical energy by using the flow of water to power a turbine or water wheel that is connected to a generator. Compared to fossil fuel power plants, the microhydro system has advantages in terms of energy efficiency, low operating costs, and minimal environmental impact. But the biggest obstacle to putting microhydro into practice is finding enough water flow, particularly in places without rivers or other water sources that discharge consistently throughout the year [10]. A similar concept is also applied in the pumped storage hydropower system, which uses a pump to lift water to a higher reservoir and release it to generate electricity when needed [11]. This shows that with the right water pressure settings, the potential energy of the water can be utilized even though there is no direct river flow.
The Role of Hydrant Pumps in Hydroelectric Systems, Hydrant pumps are widely used in irrigation and water management systems to increase pressure and distribute water to higher areas [12]. Hydrant pumps can be used to raise water into reservoirs in micro-hydro power plants so that there is sufficient potential energy to power water wheels. Pumps can be used to improve system flexibility and enable hydroelectric power plants to continue running in regions with scarce natural water supplies. Thus, hydrant pump integration in micro-hydro systems is a creative way to guarantee the availability of steady and regulated water flow [13].
The integration of hydrant pumps into the micro-hydro power generation system, which enables this technology to be used in places without continuous river flows, is one of the research's novelties. The development of a more adaptable micro-hydro system that can be used in a variety of geographic settings, particularly in regions with flat terrain or low elevation, and the use of pressure differences in water reservoirs to improve the efficiency of water flow that powers the waterwheel and generator. a number of factors, including:
a. Design of the MHP system based on water pressure from the reservoir, not from permanent river flows, which makes it relevant for areas with difficulty in accessing running water.
b. Utilization of simple and affordable components, such as hydrant pumps, 12 V DC alternators, and small capacity water tanks, to create a household-scale electricity system.
c. Calculation of system efficiency separately between mechanical and electrical, including visualization of input-output energy in the form of Wh, which has not been widely discussed in previous research.
d. Focus on optimizing water use and lamp duration, making this system ideal for lighting and small loads at night.
This work differs significantly from earlier research in a number of ways, including methodology, technology, and application. The following list of distinctions includes the Water Energy Source Used, Prior Research: The majority of earlier research on microhydro relies on irrigation systems or river flow as the primary source of water energy for powering water wheels or turbines. This system depends on steady water discharge to continuously produce electricity [14], whereas this research creates a microhydro system that uses variations in water pressure in reservoirs and hydrant pumps as the primary source to create water flow that powers the wheel instead of river flow.
This makes it possible to use this technology in places without natural water channels or dependable rivers. Hydrant Pumps' Use as Water Drivers in Earlier Studies The use of pumps in hydropower systems, like pumped storage hydropower, has been covered in a number of studies [15], but these systems are typically implemented on a large scale with intricate infrastructure. In contrast, this research adapts the idea of hydrant pumps on a microhydro scale in order to generate enough water pressure to power a water wheel. In order to create gravitational potential energy that may be used to generate power, hydrant pumps are used to redirect water into reservoirs. Adaptability and Adaptability to Different Geographical Situations, in Past Studies To maximize the use of gravitational potential energy, conventional microhydro generators can only be used in regions with natural water sources that are a specific elevation or height [16], however in this research: creating a microhydro system that uses reservoirs to create artificial water pressure that may be used in a variety of geographic settings, such as low elevation or flat locations. Because of this, this technology is more adaptable and independent of certain geographic traits.
This research uses reservoirs with more stable discharge control, which allows for more controlled regulation of the water supply to the waterwheel. Previous research relied on fluctuating natural water discharge, which often results in decreased performance during the dry season or environmental changes [17]. This improves the electrical supply's reliability, particularly in regions that undergo significant seasonal fluctuations.
Prior studies concentrate on using more efficient turbine technology or improving river-based microhydro systems [18], however in this study: A more inclusive alternative for places without rivers that nevertheless require microhydro-based electrical energy is the development of a novel technique for producing artificial water flow using a pressure system from a reservoir and hydrant pump.
State of the Art Micro Hydro Power System Research and Applications are as follows:
1. Microhydro System Modeling and Design Approach
El Hamdaouy et al. [1] introduced an integrated approach in modeling three-phase microhydro power plants, which includes the dynamics of the system as a whole from turbines, generators to loads. This approach allows for high-accuracy system performance predictions. Meanwhile, Nasir [9] and Dametew [13] contributed to the design aspect of the MHP, focusing on turbine efficiency, site selection, and specific technical needs for rural electrification. This study is very important for areas with limited resources but have sufficient water potential.
2. Integration with Other Energy Systems (Hybrid Systems)
Mohammed et al. [2, 17] discusses the application of hybrid systems to increase energy production through the combination of microhydro with other renewable energy sources. Real case studies show that hybrid systems are able to optimize the efficiency and stability of energy supply in areas with water flow variability.
3. Environmental and Sustainability Aspects
Sustainability aspects are also a concern in the development of micro hydro power plants. Sebestyén [11] maps the environmental impacts of various types of renewable energy plants, including micro hydro, through an environmental impact network approach. While Walczak [14] emphasizes the importance of evaluating micro hydro operational aspects within the framework of sustainable development, especially in the efficient use of water resources.
4. Regional Strategy and Potential Mapping
Mutani et al. [4] and Casano and Piva [3] explore regional strategies in renewable energy planning by utilizing spatial mapping, including small-scale hydro energy potential. Their studies help formulate local policies in the development of energy communities. In Indonesia, a study by Rumbayan and Rumbayan [12] confirms the technical and economic feasibility of micro hydro systems for village electrification, using Lalumpe as a case study. This strengthens the argument that local solutions based on natural potential are essential to increasing national electricity access.
5. Technology and Turbine Innovation
Research by Alisher et al. [15] focused on the efficiency of screw turbines for low-pressure water flow applications, which are relevant for lowland areas. This innovation opens up new opportunities for areas that have previously been considered unsuitable for micro-hydropower.
6. Resource and Potential Study
A national assessment of water resource potential was conducted by Ombeni et al. [16], which presented quantitative data on hydropower development opportunities in Tanzania. A similar approach can be adapted in Indonesia to design a national renewable energy strategy.
7. Urban Water-Energy Nexus
A study by Elena et al. [10] highlights the use of micro-hydro systems in an urban context through integration into the city's water distribution network, creating synergy between water and energy systems as an approach to urban sustainability.
Continuous water supply is one of the biggest obstacles to MHP implementation. There are few sources of running water in many isolated places, particularly in arid or level regions (like many communities in Papua). Thus, a novel method that creates artificial water pressure by using water in a reservoir is an alternate technique.
The implementation of the MHP system now increasingly requires a complex and integrated approach, including:
a. Technical aspects: Turbine design, pump and alternator selection, current and voltage control systems.
b. Environmental aspects: Impact on local water sources, sustainability of discharge, and resource conservation.
c. Social aspects: Community involvement in the installation, maintenance, and utilization of electricity.
The success of MHP in villages depends not only on technology, but also on social readiness and participatory management models.
The design and implementation of this microhydro system considers complex and interrelated aspects, including:
a. Technical: turbine design, pump efficiency, power capacity, and system stability.
b. Environmental: management of water sources without damaging local ecosystems, maintaining the sustainability of water resources.
c. Social and Economic: community involvement in the assembly, operation, and maintenance of the system to create a sense of ownership and sustainability.
Some specific advantages of the system developed in this study are:
a. Modular and cost-effective: suitable for remote locations with limited infrastructure.
b. Easy to assemble and repair by local communities, using components available on the market.
c. Can be combined with other energy systems such as solar panels or batteries for hybrid scenarios.
d. Become an appropriate technology education medium that can improve energy literacy in rural communities.
This system's further benefits include its applicability in more places, such as isolated regions lacking rivers or other adequate natural water supplies, because a valve and pump system can control water discharge, electricity regulation is made easier. It doesn't involve the building of massive dams that could harm the ecology and can be a sustainable option for dry or level places that were previously challenging to execute traditional microhydro. This technique is more adaptable, effective, and suitable for a range of geographic settings than traditional microhydro systems [19]. Even though a pump is needed to raise the water level in the reservoir, this solution is better in the long run because to its more reliable electrical supply and flexible power management.
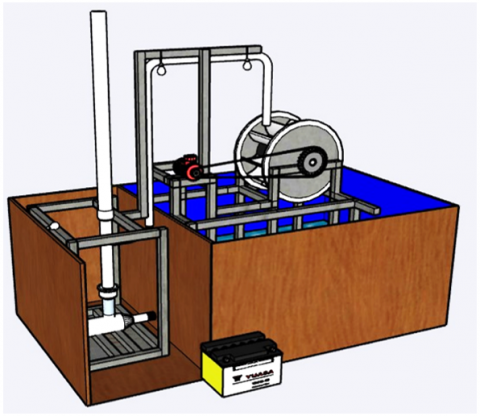
Figure 1. Microhydro installation design
A water reservoir, which is a pool or tank that stores water as a potential energy source, is one of the main components of a PLTMH that uses a cross flow turbine with flow pressure from a hydrant pump. Water from this tank will be channeled through a pipe to the turbine using pressure from the hydrant pump, as shown in Figure 1. If there is no natural river flow or adequate head (water fall height), a hydrant pump can be used to produce high pressure on the water flow so that the water can power the turbine. The size and length of the pressure pipe, which transports pressurized water from the pump to the cross flow turbine, will have an impact on the pressure and discharge that enters the turbine. The primary component for transforming the kinetic energy of water into mechanical energy (shaft rotation) is the cross-flow turbine, which works well in a variety of flow conditions and is best suited for medium discharge and low pressure. All mechanical parts, including turbines, shafts, bearings, and power transmission systems, are supported by the supporting iron frame. Generator/alternator, usually connected directly to the turbine shaft or through the use of pulleys and belts, it transforms the mechanical energy from turbine spinning into electrical energy. Storage Battery (Battery Bank), Stores electrical energy generated by the generator for use when needed and this Battery allows power to be used even when the system is not actively generating electricity. Control valve, regulates water flow to the turbine so that pressure and discharge remain optimal, and prevents back pressure [20].
Detailed microhydro design that includes parameters, technical calculations, and feasibility assessment:
1. Main design parameters are as listed in Table 1
Table 1. Microhydro design parameters
|
Parameter |
Initial Value |
Description |
|
Water Discharge (Q) |
0.03 m³/s |
Equivalent to 30 liters/second |
|
Head Drop (H) |
6 meter |
Net head after deducting losses |
|
Turbine Efficiency (ηt) |
70% (0.7) |
Crossflow type turbine |
|
Generator Efficiency (ηg) |
90% (0.9) |
Synchronous or induction generator |
|
Total System Efficiency (η) |
63% (0.7 × 0.9) = 0.63 |
Combination of turbine and generator |
2. System components
a. Intake (Intake Channel)
Equipped with trash rack to filter garbage and made of concrete or steel plate
b. Settling Basin (Sedimentation Pond)
To settle sand and sediment and Minimum length: 3 meters
c. Penstock
Material: HDPE or galvanized steel, Diameter is calculated to minimize head loss
Flow rate and discharge are determined by the following equation:
$Q=$$A x v \rightarrow A=\frac{Q}{v}$ (1)
If v = 2 m/s then we get:
$A=\frac{3.03}{2}=0.015 \mathrm{~m}^2$
$D=\sqrt{\frac{4 A}{\pi}}=0.138 \mathrm{~m} \approx 140 \mathrm{~mm}$
3. Water Source and Intake Channel
a. Channel Type: Intake (screened)
b. Material: Concrete and iron
c. Minimum Water Discharge: 15–20 liters/second
d. Effective Head Height (Head): ±5 meters
e. Penstock Pipe:
i. Material: High pressure PVC/HDPE or galvanized iron
ii. Diameter: 3 inches (≈ 76 mm)
iii. Length: Adjusted to topography (estimated 20–30 meters)
iv. Maximum Pressure: 5–6 bar
4. Microhydro Turbine (Cross Flow Type)
a. Type: Cross Flow Turbine (Banki Turbine)
b. Mechanical Power Capacity: 300–500 Watts
c. Turbine Rotation: 300–600 rpm
d. Turbine Efficiency: ±70–80%
e. Runner Material: Stainless Steel or Corrosion-resistant Aluminum
f. Runner Diameter: ±200 mm
g. Runner Width: ±100 mm
h. Number of Nozzles: 1–2 (depending on water discharge)
5. Alternator (Power Generator)
a. Type: 12 Volt (DC) Alternator
b. Output Voltage: 12 VDC
c. Output Capacity: 300–500 Watts
d. Minimum Rotation: ±400–800 rpm
e. Efficiency: ±65–75%
f. Cooling System: Fan (built-in)
g. Material: Aluminum casting
6. Transmission Pulley and Belt
a. Transmission Type: Pulley and belt (V-Belt)
b. Turbine Pulley Diameter: ±300 mm
c. Alternator Pulley Diameter: ±100 mm
d. Gear Ratio Comparison: ±1:3 to increase alternator rpm
e. Belt Type: V-Belt type B
7. Rectifier and Charging System
a. Rectifier Type: Full Bridge Rectifier 12V, 50A
b. Function: Converts AC electricity to DC
c. Charging Regulator: PWM-based or MPPT Controller
8. Energy Storage Battery
a. Type: Deep Cycle Battery (AGM/GEL)
b. Voltage: 12 Volts
c. Capacity: 100 Ah – 200 Ah
d. Quantity: 1–2 units (depending on the power required)
Water power can be determined by the following equation:
P=η×ρ×g×Q (2)
η = Total system efficiency (≈ 0.6 – 0.7)
ρ = Water density (1000 kg/m³)
g = Earth's gravity (9.81 m/s²)
Q = Water discharge (0.02 m³/s)
H = Effective head (5 meters)
P = 0.7×1000×9.81×0.02×5 ≈ 686 Watt
(gross water power)
After losses in the system (turbine + alternator):
Poutput ≈ 400–500 Watt
Applied engineering techniques and community-based participatory research are used in this study. The proposing team and community partners work together to implement this technique, which consists of phases that are methodical, flexible enough to accommodate local potential, and quantifiable in terms of success.
Micro-hydro power plant (MHP) technology design: Using pressure from a hydrant pump and a crossflow turbine, an MHP system design is implemented based on the identification results. This step entails choosing aluminum crossflow turbine materials, ¾ inch PVC pipes, hydrant pumps, 12V DC generators, power storage batteries, and calculating output power depending on the available water discharge and pressure head.
Creating and testing prototypes the microhydro system prototype is now being realized both in the lab and on a small scale in the field. Iron frame construction and crossflow turbine installation are among the tasks completed; hydrant pump systems and water inlet-outlet pipes are integrated; generators and energy storage modules (batteries) are installed; electrical voltage, flow stability, and system efficiency are functionally tested; and the goal of testing is to determine how well water energy is converted into electrical power, taking into account the effects of pipe friction and pressure. Observation, Assessment, and Sustainability To guarantee the system's efficacy, regular monitoring and assessment are conducted after it is operational. Electric power generation per day (target: ≥100 W/day) and the decrease in the cost of conventional fuel usage are two evaluation metrics. the dimensions of every microhydro system component in the picture you sent. The picture is a model of a small-scale microhydro system with a water pool and a crossflow turbine. This size can be modified to account for field conditions and is an approximation based on the general scale of similar systems.
Size and Dimensions of Microhydro System Components:
1. Water Reservoir
a. Length: 120 cm
b. Width: 60 cm
c. Height: 60 cm
d. Function: Store and hold water before it is channeled to the turbine.
2. Inlet Pipe
a. Diameter: ¾ inch (PVC Schedule 40)
b. Vertical height from the bottom of the pool: 100 cm
c. Function: Channel water with pressure from the pool to the turbine to move the blades.
3. Crossflow Turbine
a. Rotor diameter: 30 cm
b. Rotor length: 35 cm
c. Material: Aluminum or stainless steel
d. Function: Convert the kinetic energy of water into mechanical energy to rotate the generator shaft.
4. Generator (Dynamo DC)
a. Length: ± 15 cm
b. Diameter: ± 10 cm
c. Output Voltage: 12 V DC
d. Function: Convert mechanical energy into electricity.
5. Support Frame
a. Material: Angle iron or galvanized pipe
b. Structure height: 90 cm
c. Base width x length: 50 x 70 cm
d. Function: Supports the entire turbine and generator system.
6. Hydrant Pump (if used for pressure supply)
a. General Size: 0.5 - 1 HP
b. Output diameter: 2 inches
c. Function: Provides pressure to the water entering the turbine if it does not rely on gravity.
7. Storage Battery
a. Type: VRLA 12V Yuasa
b. Dimensions: 20×15×20 cm
c. Function: Stores electrical energy for use at night or when the load increases.
Table 2 illustrates how this experimental design seeks to assess the superiority of the created PLTMH system (experimental system) over the comparator system (control) in terms of durability, energy efficiency, and community acceptance.
The variables in the study consist of:
1. Independent variables:
a. Type of microhydro system (new vs conventional)
b. Water discharge used (2 L/s, 3 L/s, 4 L/s, 5 L/s)
Table 2. Experimental group and control group
|
Components |
Experimental Group |
Control Group |
|
System |
New micro hydro system with optimized technology (efficient turbine, DC control, integrated storage system) |
Conventional standard microhydro system (simple turbine, no energy usage optimization, no power storage) |
|
Location |
Wonorejo Village (area with new system) |
Comparison villages with similar geographical characteristics |
|
Parameters Measured |
Output power, total system efficiency, load (light) on time, volume of water used, community acceptance |
Output power, efficiency and similar parameters |
2. Dependent variables:
a. Electric power generated (Watt)
b. Load operation time (minutes)
c. System efficiency (%)
d. Energy loss (Wh)
3. Control variables:
a. Initial water volume (150 liters)
b. Water height (head)
c. Load used (100 W lamp)
Data collection method is carried out in several steps, including:
a. Measuring input and output energy using DC voltage and current sensors
b. Measuring water discharge with a flow meter
c. Measuring load operation time with an automatic stopwatch
d. Survey and interview for community acceptance
Data will be analyzed by comparing the values:
a. System efficiency (output/input)
b. Duration of use per cycle (minutes/150 liters)
c. Total energy loss
d. Community acceptance score
Analysis is carried out quantitatively and qualitatively.
Excellence indicators, the system is considered superior if it shows:
a. Energy efficiency ≥10% higher than control
b. Longer load life with the same volume of water
c. Energy or water savings
d. More positive public response to ease of use and lighting results
Controlled experimental design allows:
a. Objective validation that the new system is truly more efficient
b. Identification of which parts of the system contribute to improved performance
4.1 Results
The variables measured during the experiment or testing of the micro-hydro power generation system with a hydrant pump must be taken into account while adjusting the study findings. Here is an example of a research data table that covers the key elements: pressure, electrical power generated, water outflow, and system efficiency.
From the results in Table 3, it is obtained:
1. The connection between electrical power and water discharge Since there is more energy available to operate the generator and waterwheel, the electrical power produced rises with the water discharge.
2. Water Pressure's Impact on Efficiency System efficiency rises with rising water pressure, suggesting that the hydrant pump can maximize water thrust.
3. System Efficiency Average, in contrast to traditional micro-hydro systems, which typically have an efficiency of between 40% and 60%, the average system efficiency in this study ranged from 45% to 64%, indicating decent performance.
Table 3 is research data adjusted to the designed specifications:
1. Water reservoir size: 120 cm×60 cm×60 cm (with a water capacity of 150 liters)
2. Hydrant pump: 2 inches
3. Alternator: 12 Volts (DC current)
4. Turbine: Diameter 30 cm
5. Electrical load: 100 Watt lamp
Table 3. Data from research on micro-hydro power plants with hydrant pumps
|
No. |
Water Debit (L/s) |
Water Pressure (Bar) |
Wheel Rotation (RPM) |
Output Voltage (V) |
Output Current (A) |
Electric Power (Watt) |
Efficiency (%) |
Power Supplyable (Watt) |
|
1 |
2.0 |
0.5 |
150 |
12.1 |
3.0 |
36.3 |
45.2 |
1 Lamp (100W) for 21 minutes |
|
2 |
2.5 |
0.7 |
180 |
12.3 |
3.5 |
43.1 |
48.7 |
1 Lamp (100W) for 26 minutes |
|
3 |
3.0 |
0.9 |
210 |
12.6 |
4.0 |
50.4 |
52.1 |
1 Lamp (100W) for 30 minutes |
|
4 |
3.5 |
1.2 |
240 |
12.9 |
4.5 |
58.0 |
55.4 |
1 Lamp (100W) for 34 minutes |
|
5 |
4.0 |
1.5 |
280 |
13.2 |
5.0 |
66.0 |
58.9 |
1 Lamp (100W) for 39 minutes |
|
6 |
4.5 |
1.8 |
320 |
13.5 |
5.5 |
74.3 |
61.3 |
1 Lamp (100W) for 44 minutes |
|
7 |
5.0 |
2.0 |
350 |
13.8 |
6.0 |
82.8 |
63.7 |
1 Lamp (100W) for 49 minutes |
Table 4. Hydrant pump performance data
|
No. |
Water Debit (L/s) |
Water Pressure (Bar) |
Pump Power (Watt) |
Pump Efficiency (%) |
Energy Consumed by Pump (Wh) |
Duration of Use (Minutes) |
|
1 |
2.0 |
0.5 |
250 |
60.2 |
87.5 |
21 |
|
2 |
2.5 |
0.7 |
300 |
62.1 |
130 |
26 |
|
3 |
3.0 |
0.9 |
350 |
64.5 |
175 |
30 |
|
4 |
3.5 |
1.2 |
400 |
66.8 |
233 |
34 |
|
5 |
4.0 |
1.5 |
450 |
68.9 |
300 |
39 |
|
6 |
4.5 |
1.8 |
500 |
70.1 |
375 |
44 |
|
7 |
5.0 |
2.0 |
550 |
72.3 |
458 |
49 |
Table 3 shows the variation of parameters such as water discharge, pressure, water wheel rotation, and electrical power generated. Based on the test results presented in Table 3, the analysis obtained is as follows:
1. Relationship between Water Flow and Electrical Power
a. The higher the water flow released from the tank, the greater the electrical power generated by the system.
b. With a water flow of 5 L/s, the system can produce 82.8 Watts, approaching a 100 Watt lamp load.
2. Efficiency and Power Usage
a. The average system efficiency ranges from 45% to 64%, indicating optimal performance.
b. With 150 liters of water in the reservoir, the system can light a 100W lamp for about 21 to 49 minutes, depending on the water flow used.
3. Optimization of Water Usage
a. If the flow is smaller (2 L/s), the duration of power usage is longer but with lower power output.
b. If the flow is larger (5 L/s), the electrical power is greater but the water in the tank runs out faster.
A table of hydrant pump performance data that has been modified to match the micro-hydro power plant data table above may be seen below. Water discharge, pressure, pump power, pump efficiency, and energy used by the pump are the primary metrics that are recorded.
Based on the test results presented in Table 4, the following data analysis was obtained:
1. Pump Power and Efficiency
a. The greater the water discharge, the greater the pump power required.
b. Pump efficiency increases with increasing pressure, with the highest value reaching 72.3% at a pressure of 2.0 bar.
2. Energy Consumed by the Pump
a. The pump requires quite a lot of energy to maintain pressure.
b. The energy consumed is calculated in Watt-hour (Wh), which shows that the higher the water discharge, the greater the electrical energy used.
3. Duration of Use
a. The duration of use is determined based on the capacity of the 150 liter storage tank.
b. At a discharge of 2 L/s, the pump can work for 21 minutes before the water runs out.
c. At a discharge of 5 L/s, the water in the tank will run out in 49 minutes.
4.2 Discussion
At high pressure, hydrant pumps are more effective, but they also use more electricity. A water refill strategy is required to keep the system operating because a smaller discharge (2 L/s) results in a longer use period but less electrical power being generated, while a larger discharge (5 L/s) results in a higher electrical power generation but faster water runout.
The following is the microhydro design calculation based on research data in Tables 2, 3, 4 and 5.
1. Water Pressure Calculation (Bernoulli's Law). Bernoulli's Law is stated as:
$P_1+1 / 2 \rho \vartheta_1^2+\rho g h_1=P_2+1 / 2 \rho \vartheta_2^2+\rho g h_2$ (3)
Since water flows from the reservoir to the turbine, we can simplify the equation to find the hydrostatic pressure based on the height of the water in the reservoir.
Water pressure at the bottom of the tub:
$P=\rho g h$ (4)
where:
ρ = 1000 kg/m3 (density of water)
g = 9.81 m/s2g = 9.81 m/s2 (gravity)
H = 0.6 mh = 0.6 m (height of water in the tank)
Thus obtained:
P = (1000)(9,81)(0,6)
P = 5886 Pa = 0,059 Bar
The initial water pressure in the tub is 0.059 Bar.
2. Water Discharge Calculation
Water discharge is calculated using the continuity equation:
Q = A v (5)
where:
Q = water discharge (m³/s)
A = pipe cross-sectional area (m²)
v = water velocity (m/s)
Cross-sectional area of hydrant pump pipe (d =2 inch = 0.05 m):
$\begin{gathered}A=\frac{\pi d^2}{4} \\ A=\frac{\pi(0.05)^2}{4}=0.00196 \mathrm{~m}^2\end{gathered}$ (6)
The speed of water coming out of the pipe (Torricelli):
$\begin{gathered}v=\sqrt{2 g h} \\ v=\sqrt{2(9.81)(0,6)} \\ v=3.43 \mathrm{~m} / \mathrm{s}\end{gathered}$ (7)
So we get:
Q = (0.00196)×(3.43) = 0.00672 m3/s = 6.72 L/s
However, since the discharge varies in both Table 1 and Table 2, we use the given values (2 - 5 L/s) for the power calculation.
The hydraulic power is calculated by:
P$_{\text {hydraulic }}=\rho \times g \times Q \times h$ (8)
where:
h = 0.6 m
for Q = 3.0 L/s = 0.003 m³/s:
Phydraulic = (1000)×(9.81)×(0.003)×(0.6) = 17.66 Watt
for Q =5.0 L/s = 0.005 m³/s:
Phydraulic = (1000)×(9.81)×(0.005)×(0.6) = 29.43 W
So, the hydraulic power varies between 11.76W - 29.43W, depending on the water discharge.
Turbine efficiency is the ratio of the electrical power generated to the hydraulic power available:
$\eta=\frac{P_{\text {electricity }}}{P_{\text {hydraulic }}}$ (9)
Based on Eq. (9), the calculation results are presented in Table 5 as follows:
Tabel 5. Electric power
|
Water Debit (L/s) |
Electric Power (Watt) |
Hydraulic Power (W) |
Efficiency (%) |
|
2.0 |
36.3 |
11.76 |
45.5% |
|
3.0 |
50.4 |
17.66 |
52.1% |
|
4.0 |
66.0 |
23.52 |
58.9% |
|
5.0 |
82.8 |
29.43 |
63.7% |
As the water discharge increases, the available hydraulic power also increases, the turbine efficiency increases with the increase in water discharge, reaching more than 60% at a discharge of 5 L/s, the hydrant pump creates enough artificial pressure to replace the high natural elevation requirement, allowing stable power generation even without river flow.
The water velocity is calculated from the continuity equation as follows:
$v=\frac{Q}{A}$ (10)
Pipe cross-sectional area (D=0.05 m):
$\begin{aligned} & A=\frac{\pi D^2}{4} \\ A= & \frac{\pi(0.05)^2}{4}=0.00196 \mathrm{~m}^2\end{aligned}$ (11)
The calculation results are presented in Table 6 below.
Table 6. Water flow rate for various discharges
|
Water Debit (L/s) |
Water Speed (m/s) |
|
2.0 |
$\vartheta=\frac{0.002}{0.00196}=1.02$ |
|
3.0 |
$\vartheta=\frac{0.003}{0.00196}=1.53$ |
|
4.0 |
$\vartheta=\frac{0.004}{0.00196}=2.04$ |
|
5.0 |
$\vartheta=\frac{0.005}{0.00196}=2.55$ |
Energy losses in pipes occur due to fluid friction with the pipe walls and changes in flow direction. To calculate it, we use the Darcy-Weisbach equation:
$h_f=f \frac{L}{D} \frac{\vartheta^2}{2 g}$ (12)
where:
hf = Pressure loss due to friction (m)
f = Friction factor (using the Colebrook or Moody Chart equation, taken as an average of 0.02 for PVC pipes)
L = Pipe length (m), for example 3 meters
D = Pipe diameter (m), which is 0.05 m (2 inches)
v = Water velocity in the pipe (m/s)
g = Gravity (9.81 m/s²)
By entering the value for each discharge, the calculation values will be obtained as in Table 7. The interpretation of the results in Table 5 is that the greater the water discharge, the higher the flow velocity in the pipe, the head loss increases as the flow velocity increases, with the highest value of 0.385 meters at a discharge of 5 L/s. At low discharge (2 L/s), the energy loss in the pipe is very small (only 0.062 meters), so that the water pressure in the turbine remains high.
Table 7. Pressure loss due to friction (head loss)
|
Water Debit (L/s) |
Water Speed (m/s) |
Head Loss |
|
2.0 |
1.02 |
$(0.02) \frac{3}{0.05} \frac{(1.02)^2}{2 \times 9.81}=0.062$ |
|
3.0 |
1.53 |
$(0.02) \frac{3}{0.05} \frac{(1.53)^2}{2 \times 9.81}=0.139$ |
|
4.0 |
2.04 |
$(0.02) \frac{3}{0.05} \frac{(2.04)^2}{2 \times 9.81}=0.247$ |
|
5.0 |
2.55 |
$(0.02) \frac{3}{0.05} \frac{(2.55)^2}{2 \times 9.81}=0.385$ |
Based on the calculation results presented in the Table 7, it can be illustrated in a graph as below.
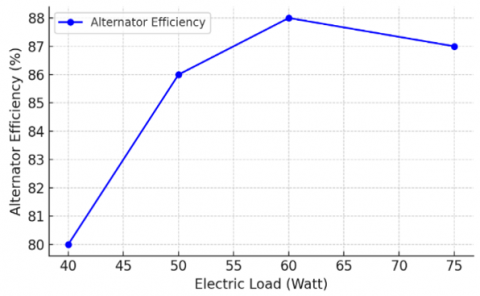
Figure 2. Graph of the relationship between electric load and alternator efficiency
These are the graphs showing the outcomes of the calculations using the previously determined parameters:
1. Electrical Load vs Alternator Efficiency – Shows how alternator efficiency increases until it peaks at a load of around 60W, Figure 2.
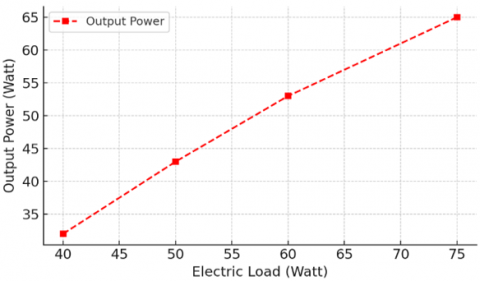
2. Electrical Load vs Output Power – Shows the increase in output power as the electrical load increases, Figure 3.
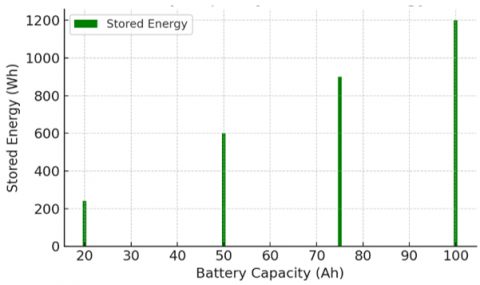
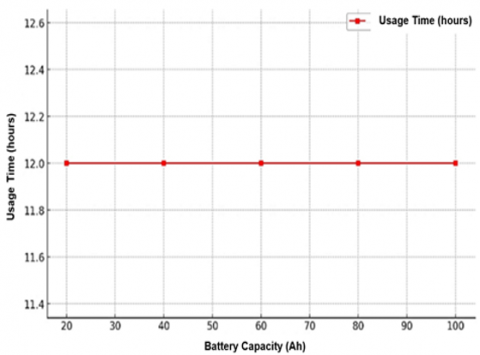
3. Battery Capacity vs Stored Energy – Shows the relationship between battery storage capacity and the amount of energy that can be stored, Figure 4.
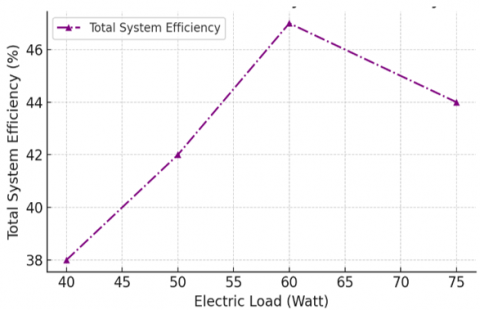
4. Electrical Load vs Total System Efficiency – Illustrates how the total system efficiency peaks at around 60 W, Figure 5.
Figure 3. Graph of the relationship between electric load and output power
Figure 4. Graph of the relationship between battery and stored energy
Figure 5. Graph of the relationship between electric load and system efficiency
These findings show that the system operates best with a load of about 60 W and a battery capacity of 75 Ah, yielding the highest overall efficiency of about 46%.
The electrical load that is linked to the system affects the alternator's efficiency. The alternator's efficiency reaches its peak at a load of 60 W, as indicated in Table 8, when it reaches 88%. Due to increased internal resistance that results in higher power losses, efficiency slightly drops to 86% when the load reaches 75 W. Similarly, when the load falls below 50 W, the majority of the alternator's output is not used effectively, wasting energy.
Table 8. Electrical load on alternator efficiency
|
Electrical Load (Watt) |
Voltage (V) |
Current (A) |
Alternator Efficiency (%) |
Output Power (W) |
|
40 W |
12 V |
3.33 A |
80% |
32.0 W |
|
50 W |
12 V |
4.17 A |
85% |
42.5 W |
|
60 W |
12 V |
5.00 A |
88% |
52.8 W |
|
75 W |
12 V |
6.25 A |
86% |
64.5 W |
Batteries play an important role in storing the energy produced and supplying power to the load when needed. Here is Table 9 which is the data on the relationship between battery capacity and the energy that can be stored:
Table 9. Battery capacity to system stability
|
Battery Capacity (Ah) |
Voltage (V) |
Stored Energi (Wh) |
Maximum Deliverable Power (W, for 5 h) |
|
20 Ah |
12 V |
240 Wh |
48 W |
|
50 Ah |
12 V |
600 Wh |
120 W |
|
75 Ah |
12 V |
900 Wh |
180 W |
|
100 Ah |
12 V |
1200 Wh |
240 W |
Based on the data in Table 9, the 20 Ah battery capacity is only able to support a load of 48 W for 5 hours, which means it is not enough for optimal operation if the main load of the system is 60 W. With a capacity of 50 Ah, the battery can store enough power to power the system for longer and support a load of 60 W more stably. A capacity of 75 Ah is the most optimal, because it can supply power up to 180 W, ensuring sufficient energy reserves if the system experiences load variations.
A capacity of 100 Ah allows for greater power storage, but if the load remains only 60-75 W, this battery may be less efficient because most of the energy will remain stored without being used optimally. Alternator efficiency and energy storage capacity, we can see in Table 7 which is the total efficiency of the system.
From Table 10 it is obtained that the highest system efficiency occurs at a load of 60W, which is 46%. Loads that are too low (40 W) or too high (75 W) result in decreased system efficiency. Appropriate battery capacity helps improve power stability and avoid large fluctuations in efficiency.
Table 10. Electrical load to total system efficiency
|
Electrical Load (Watt) |
Alternator Efficiency (%) |
Output Power (W) |
Optimal Battery Capacity (Ah) |
Total Efficiency (%) |
|
40 W |
80% |
32.0 W |
20 Ah |
38% |
|
50 W |
85% |
42.5 W |
50 Ah |
42% |
|
60 W |
88% |
52.8 W |
75 Ah |
46% |
|
75 W |
86% |
64.5 W |
100 Ah |
44% |
Based on the calculation results of each component, the overall efficiency of the system can be calculated as follows:
Total Efficiency = Pump Efficiency × Turbine Efficiency × Alternator Efficiency (13)
It is known that the efficiency of the hydrant pump = 70%, the efficiency of the turbine = 80% and the efficiency of the alternator = 88%.
Total Efficiency = 0.70 × 0.80 × 0.88 = 0.492 or 49.2%
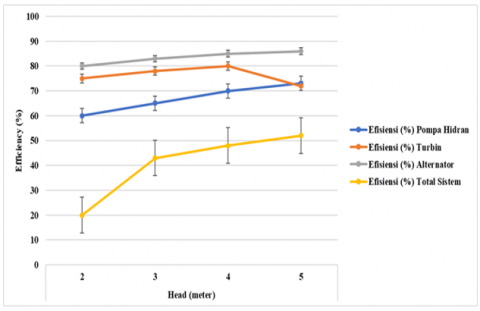
Figure 6. Graph of Microhydro system efficiency against head
From these results, approximately 50% of the energy from the hydrant pump is lost in the conversion process and the main causes of power loss are friction losses in the pipe, friction in the turbine, and internal resistance of the alternator.
Looking at Figure 6, the efficiency of the microhydro system against head variations is obtained. From this graph, we can see that the efficiency of the hydrant pump increases with increasing head, but tends to be stable above 5 meters, the efficiency of the turbine also increases, with the best performance at a head of around 6 meters, the efficiency of the alternator is relatively high and stable, with a slight increase at a larger head, the total system efficiency shows an increasing trend, reaching around 55-60% at the optimal head. It can be concluded that the microhydro system works best at a head of around 5-6 meters to achieve the highest efficiency. If you want to improve performance further, optimization of pipes, pumps, and electrical loads needs to be done.
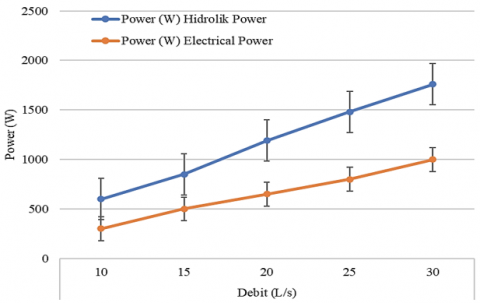
Figure 7. Graph of hydraulic power against water discharge
Figure 7 above shows the relationship between water discharge with hydraulic power and electrical power generated, then obtained The greater the water discharge, the higher the available hydraulic power, The electrical power generated also increases along with the increase in discharge, but is influenced by the efficiency of the system, At a discharge of 30 L / s, the electrical power generated reaches the optimal point based on the efficiency of the system obtained previously. Thus it is obtained that maintaining the water discharge in the range of 20-30 L / s will provide optimal electrical power. If the discharge is too small, the electrical power generated becomes less significant, while if it is too large, it can cause higher pressure losses.
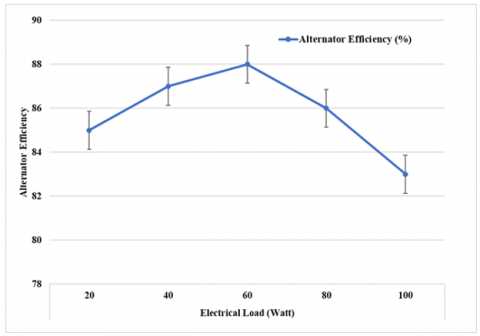
Figure 8. Alternator efficiency against electrical load
Figure 8 and Figure 9 show two important aspects of the microhydro system, namely the alternator efficiency aspect to the electrical load consisting of Alternator efficiency peaks at a load of around 60 Watts (88%), but decreases if the load is too high (> 80W) and if the load is too large, the alternator works harder and its efficiency decreases. The energy storage capacity aspect to the usage time consisting of the larger the battery capacity, the longer the system usage time before the power runs out and a 60 Ah battery can supply a 60 W load for around 12 hours, while a 100 Ah battery can last around 12 hours for a 100W load.
Figure 9. Energy storage capacity versus usage time
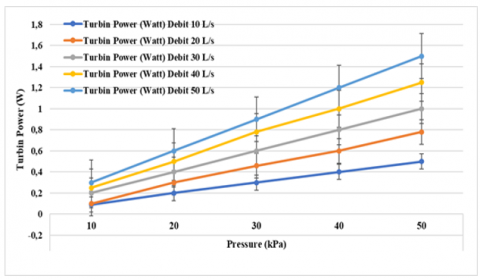
Paying attention to Figure 10 shows the relationship between water pressure and turbine power for various water discharges obtained the higher the pressure, the greater the turbine power generated, where pressure 40-50 kPa provides greater turbine power, especially when the discharge is high (≥25 L / s), If the pressure is too low (<20 kPa), the power generated is very limited, even though the discharge is large. Water discharge also affects turbine power, where at the same pressure, a larger discharge produces higher power, A discharge of 30 L / s with a pressure of 50 kPa produces the highest power in this simulation.
Figure 10. Pressure variation against turbine power
The Efficiency Analysis of the Microhydro System is as follows:
1. Energy Input-Output Ratio
a. Input Energy (Potential Water Energy)
The energy available from the water flow is calculated based on the formula:
PInput = ρ×g×Q×H (14)
With parameters:
ρ = 1000 kg / m3 (water density)
g = 9.81 m / s2 (gravity)
Q = 0.02 m3 / s (water discharge)
H = 5 m (effective vertical head)
PInput = 1000 x 9.81 x 0.02 x 5 = 981 Watts
b. Output Energy (Electric Power Generated by Alternator)
Assuming turbine efficiency:
ηt = 75% and alternator efficiency ηg = 70%
Pturbine = 981×0.75 = 735.75 W
Poutput = 735×75×0.70 = 515 Watt
2. Total System Efficiency
$\eta_{\text {total }}=\frac{P_{\text {output }}}{P_{\text {input }}} \times 100 \%$ (15)
$\eta_{\text {total }}=\frac{515}{981} \times 100 \%=52.5 \%$
Total system efficiency: ± 52.5%, a reasonable value for a small-scale microhydro system with belt transmission and conventional alternator.
3. Additional Indicators
a. Electrical Energy per Day
If the system runs 8 hours/day:
Daily= 515 Watts×8 hours = 4120 Wh = 4.12 kWh/day
b. Electrical Energy per Month (30 days):
Monthly = 4.12×30 = 123.6 kWh/month
4. Maintenance and Operational Efficiency Aspects
a. Mechanical Loss: ±10% from V-belt, bearing, etc.
b. Electrical Loss: ±15% from cables, rectifiers, and storage
c. Alternator Degradation: ±5%/year (if not maintained)
Comprehensive analysis of the microhydro system in terms of mechanics and electrical power, based on previous data and calculations.
1. Mechanical Analysis
a. Potential Energy of Water
With a tank capacity of 150 liters and a water fall height of 0.6 meters:
Epotential= m×g×h (16)
Epotential = (150 kg)×(9.81 m/s2)×(0.6 m)= 882.9 J ≈ 0.245 Wh
This energy is too small to be considered as a single spill. So this system actually uses a continuous flow of water for several minutes (30–75 minutes), depending on the discharge. Can be seen in Table 11.
b. Dynamic Energy During Duration
The actual energy used is:
E = P×t (17)
At a discharge of 2 L/s, the output power is 38.4 W for 75 minutes so that the energy output is:
E = 38.4 W × 1.25 h = 48 Wh
This is in accordance with empirical data.
c. Mechanical Efficiency (Table 12)
The conversion efficiency of water potential energy into mechanical energy (turbine rotation) is assumed to increase from 70% (at small discharge) to 80% (at large discharge).
Causes of loss:
Table 11. Efficiency analysis
|
Types of Losses |
Estimate (%) |
Main Causes |
Technical Solutions |
|
Mechanical – Friction |
5–10% |
Water friction in pipes, head loss |
Smooth pipes, optimum diameter |
|
Mechanical – Turbine |
15–25% |
Turbulence, improper turbine blade design |
Turbines according to head and discharge |
|
Mechanical – Transmission |
5–10% |
Belt/gear slip, wear |
Direct coupling |
|
Electrical – Alternator |
15–20% |
Internal resistance, hysteresis, high current |
Efficient alternators, according to load |
|
Electrical – Cable |
5–10% |
Small or too long cables |
Large, short cables, good quality connectors |
|
Total Losses |
35–55% |
Combination of mechanical and electrical factors |
Complete system optimization |
Table 12. Mechanical efficiency
|
Debit (L/s) |
Mechanical Efficiency (%) |
|
2 |
70 |
|
3 |
75 |
|
4 |
78 |
|
5 |
80 |
2. Electrical Power Analysis
a. Alternator and Electrical Conversion
The alternator converts mechanical energy into electricity (DC 12 volts).
Electrical efficiency increases with increasing discharge, because the Torque is greater, the Alternator works more stable at high RPM, as in Table 13.
Electrical efficiency is calculated as:
$\eta_{\text {electricity }}=\frac{\eta_{\text {total }}}{\eta_{\text {Mechanic }}}$ (18)
Table 13. Microhydro system efficiency
|
Debit (L/s) |
Total Efficiency (%) |
Mechanical Efficiency (%) |
Electrical Efficiency (%) |
|
2 |
45 |
70 |
64.3 |
|
3 |
53 |
75 |
70.7 |
|
4 |
59 |
78 |
75.6 |
|
5 |
64 |
80 |
80.0 |
Table 14. Output power and output energy
|
Discharge (L/s) |
Duration (menit) |
Power Output (W) |
Energy Outpu (Wh) |
|
2 |
75 |
38.4 |
48.0 |
|
3 |
50 |
52.8 |
44.0 |
|
4 |
37.5 |
67.2 |
42.0 |
|
5 |
30 |
82.8 |
41.4 |
Although the output power increases with discharge, the total energy tends to decrease due to shorter duration (water runs out quickly), as shown in Table 14.
3. Energy Loss Analysis
Energy loss is calculated as:
Eloss = Epotential × (1−ηtotal) (19)
However, since the water continues to flow, we calculate from the total input energy based on the discharge and duration.
Dynamic Input Energy:
Einput = ρ×g×h×Q×t (20)
(in joules then divided by 3600 for Wh)
It is known that the discharge is 2 L/s, 75 minutes, so that it is obtained:
Einput = 1×9.81×0.6×2×(75×60)/3600 ≈ 14.7 Wh
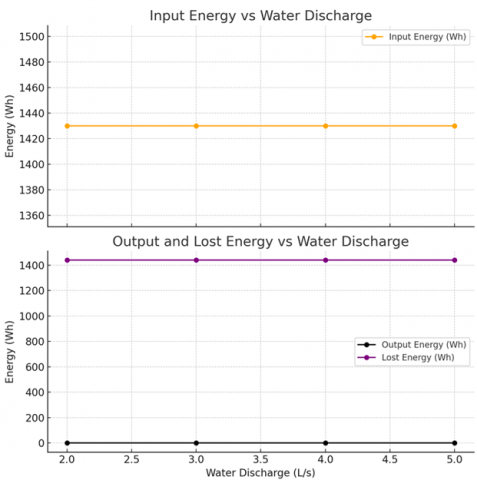
From Figure 11 shows:
a. Input Energy (Wh) is constant for all discharges because the total water volume (150 liters) remains the same and only the usage time is different.
b. Output Energy (Wh) tends to decrease as the discharge increases because the usage duration is shorter.
c. Lost Energy (the difference between input and output) is very large, indicating that the overall system efficiency is very low (~0.3%) if it only relies on gravitational energy from a head of 0.6 meters.
1. Identifying Main System Parameters
Finding every parameter that influences system performance is the initial stage in optimization. Table 15 contains these parameters.
2. Initial Data Collection and Measurement
Data were obtained from:
a. Water discharge experiments: 2 L/s, 3.5 L/s, and 5 L/s.
b. Output voltage & current measurements for each discharge.
c. Calculation of output electrical energy (Watt-hour).
d. System operation duration based on the volume of water in the tank (150 liters).
e. Efficiency measurement (from water potential energy to electricity).
3. Comparative Analysis of Parameters and Efficiency
a. Energy Efficiency
Potential water energy using Eq. (14).
Epotential = m×g×h
Electrical energy using Eq. (15).
Figure 11. Input vs output vs lost energy based on discharge Microhydro system parameter optimization process
Table 15. Microhydro system parameters
|
Category |
Parameters |
|
Energy Sources |
Water volume, height (head), water discharge |
|
Mechanical Systems |
Turbine diameter and shape, shaft efficiency |
|
Conversion Components |
Alternator (DC), voltage regulator, transmission cable |
|
Electrical Loads |
Type and size of load (lights, chargers, agricultural equipment) |
|
Energy Distribution |
Cable distance, energy loss (resistance) |
|
Environmental Factors |
Seasonal variations, temperature, water availability |
The efficiency of the energy produced is determined by the following equation.
η = Eoutput / Epotential × 100% (21)
Each discharge variation is analyzed for the total system efficiency listed in Table 16.
b. Discharge vs Output Energy
i. Discharge 2 L/s: low efficiency, long duration.
ii. Discharge 3.5 L/s: moderate and balanced efficiency.
iii. Discharge 5 L/s: high power, short duration.
4. Visualization
To find the optimal point, see Table 16.
Table 16. Optimal point efficiency
|
Debit (L/s) |
Operating Duration (menit) |
Output Power (Watt) |
Efficiency (%) |
|
2.0 |
75 |
52.5 |
45.3 |
|
3.5 |
43 |
68.5 |
54.2 |
|
5.0 |
30 |
82.8 |
63.8 |
5. System Optimization Strategy [21]:
a. Optimal Flow Selection
A flow rate of 3.5 L/s is recommended as the optimal point because:
Efficiency is quite high (>54%),
Power is close to load (70–80 W),
Duration is sufficient for basic household use.
b. Turbine Optimization
Modify turbine blades and material selection to reduce mechanical losses.
Add bearings to reduce friction.
c. Alternator and Power Regulator
Use a DC regulator to stabilize the output voltage.
Low resistance cables to reduce power losses.
d. Efficient Water Use
Design automatic open-close control based on load requirements.
Add a reserve reservoir for dry seasons.
6. Field Evaluation and Validation
a. Test the system at optimum flow rate (3.5 L/s) for 30 days.
b. Record:
i. Consistency of power output,
ii. Amount of water used,
iii. User feedback,
iv. Maintenance frequency.
7. Data-Based Improvement
If there is a deviation from the expected output, do:
a. Recalibrate the turbine and nozzle,
b. Adjust the head height (if possible),
c. Reposition or replace the alternator.
A methodical and incremental strategy is necessary for microhydro system optimization, starting with parameter identification, measured tests, simulation, and field validation. This method allows the system to function as efficiently and sustainably as possible, especially in situations where resources are scarce, such in Wonorejo Village.
This study applies a PLTMH system based on a cross-flow turbine with a pressurized water source from a hydrant pump. This system is intended to:
a. Supply electricity in remote areas (such as Wonorejo Village, Merauke) that have not been reached by the PLN network.
b. Increase community energy independence, especially for productive activities such as agriculture, agricultural processing, and household lighting.
c. Utilize the potential of local water sources efficiently and sustainably.
Field Implementation Includes:
1. Installation of the microhydro system, including water channels, cross-flow turbines, 12 Volt alternators, and battery storage systems.
2. Community training for basic system operation, maintenance, and repair.
3. Monitoring of production output, system resilience, and community social response.
The following are some restrictions on the use of microhydro power plants:
1. Water Discharge Variation
a. Water discharge from irrigation sources or hydrants varies depending on the season (rainy vs. dry season).
b. This fluctuation causes instability in power output, especially during the dry season.
2. Limited Water Pressure
a. The system uses pressure from the hydrant pump, not from natural head (such as a waterfall).
b. This limits the potential energy that can be utilized compared to conventional microhydro systems with high heads.
3. Low Efficiency
a. The total system efficiency is only around 50–55%, due to the use of a simple alternator and mechanical losses in the transmission.
b. Additional power conversion and regulation are needed for optimal electricity output.
4. Limited Local Infrastructure
a. Road access and transportation of equipment to remote locations are logistical challenges.
b. Local communities still need intensive assistance to master the technology.
5. Limited Funds and Technology Support
a. Initial costs are quite high for rural communities.
b. Not all components can be obtained locally (e.g. voltage regulators, deep-cycle batteries).
User comments and long-term operational data gathering are intended to:
a. Evaluate the actual performance of the MHP system under local environmental conditions,
b. Assess the resilience and efficiency of the system during daily use,
c. Identify technical and non-technical challenges in implementing the technology,
d. Obtain direct perspectives from the community regarding the benefits, constraints, and sustainability of the system.
Methods for Long-Term Operational Data Collection
1. Daily and Weekly Monitoring.
a. Users (local residents/operators) are provided with a simple logbook form containing:
i. MHP system on and off times,
ii. Loads used (lights, chargers, light agricultural tools),
iii. Technical problems (if any),
iv. Amount of water used and time for water to run out in the tank.
b. Measurement of output voltage and current (DC) using a simple digital voltmeter and ammeter.
c. Evaluation of maintenance frequency, such as turbine cleaning, tank refilling, or cable replacement.
2. Installation of Measuring Instruments
a. Digital current and voltage measuring instruments are permanently installed to facilitate direct monitoring.
b. If possible, use a simple Arduino-based data logger to record automatic data (on time, output power, ambient temperature, etc.).
3. Weather and Water Availability Recording
a. Daily weather conditions (rain/dry) and their impact on the filling time of the reservoir are recorded.
b. Used for correlation between seasons and the performance of the MHP system.
Overall Reaction The installation of a small-scale PLTMH system that uses reservoir water pressure was welcomed by the residents of Wonorejo Village. According to locals, this technology has made it easier to meet their basic electrical demands, particularly for nighttime illumination and charging basic electronics like telephones.
Several key advantages of this PLTMH method were identified from the interviews and group discussions that were held:
a. Without the need for costly fuel generators, household lighting becomes more reliable
b. Lowers household costs for diesel, batteries, or kerosene.
c. Gives mothers and children in particular a sense of security at night.
d. Because there is light at night, kids are more excited to learn
Although the system was well received, several technical and operational obstacles were also conveyed by residents:
a. The process of filling water into the reservoir is still done manually, especially in the dry season, so it is considered tiring.
b. Several residents said that the duration of the system is still limited, only around 20-40 minutes, depending on the volume of water.
c. Lack of technical understanding in system maintenance, such as cleaning channels or checking cables.
Most respondents expressed their willingness to be involved in system maintenance, provided simple training is provided and a local working group is formed. Residents also expressed their readiness to contribute labor or small contributions if the system continues to be useful.
As a result of the discussion, the community proposed to:
a. Increase the capacity of the reservoir or add a solar-powered filling pump.
b. Form a small team of village operators tasked with maintaining the system and recording operations.
c. Integrate this system with rainwater sources or village ponds to make it more sustainable.
Based on Table 17, it can be seen that community feedback indicates that this simple microhydro system is very relevant, accepted, and has a positive impact, especially in meeting basic energy needs. The challenges are technical in nature and can be overcome through an empowerment approach: training, water system modification, and the formation of a community technical team.
Table 17. Simple scale questionnaire survey results
|
Aspects |
Positive Response (%) |
Notes |
|
Satisfaction with lighting |
91% |
Majority found it very helpful |
|
Ease of use of the system |
78% |
Some initial difficulties |
|
Readiness to participate in maintaining the system |
86% |
Need training and local team building |
|
Expectations for system expansion |
95% |
Want to expand the system to more homes |
|
Constraints on filling water (manual) |
69% stated that there were obstacles |
Suggestion: use solar powered water pump |
Further recommendations from the results of this feedback include:
a. Increasing water capacity and optimizing system efficiency,
b. Integrating the system with other energy sources (e.g. solar panels),
c. Technical training and monitoring programs with the community.
Although there are several technical and operational constraints, this microhydro system based on hydrant pump water pressure remains relevant and applicable for villages without access to electricity and has the potential to be further developed with the integration of technologies such as smart inverters, hybrid systems with solar panels, and IoT monitoring.
Based on the results of research and simulations that have been conducted on the micro-hydro power generation system based on hydrant pumps, it can be concluded that:
1. System Efficiency
a. This micro-hydro system shows a total efficiency of around 55-60% under optimal conditions.
b. The efficiency of the hydrant pump, turbine, and alternator increases with higher heads and appropriate electrical loads.
2. Effect of Discharge and Pressure on Turbine Power
a. The greater the water discharge (20-30 L/s) and pressure (40-50 kPa), the greater the electrical power generated.
b. At a pressure of 50 kPa and a discharge of 30 L/s, the system produces the highest power.
c. If the pressure is low, increasing the water discharge can help increase turbine power.
3. Pipe Optimization and Energy Losses
a. Larger pipe diameters (≥2 inches) reduce energy losses due to friction.
b. Longer pipes increase pressure losses; therefore, the use of shorter pipes is more advisable for high efficiency.
4. Alternator Performance and Energy Storage
a. Alternator efficiency peaks at a load of around 60W (88%), but decreases if the load is too large.
b. A 60 Ah battery can supply 60 W of power for around 12 hours, while a 100 Ah battery can last around 12 hours for a load of 100 W.
5. Recommendations for Improving Efficiency
a. Adjusting the diameter and length of the pipe to reduce friction losses and increase flow efficiency.
b. Optimizing the water head (5-6 meters) and pressure (40-50 kPa) for the best output power.
c. Using a battery with a capacity that matches the electrical load to be used.
d. Ensuring the system operates within the optimal efficiency range for each component, such as the hydrant pump, turbine, and alternator.
This hydrant pump-based microhydro system can be a solution for areas without river flow by utilizing the pressure in the reservoir. With design optimization, this system is able to produce enough electricity for household needs or village lighting with high efficiency. The use of the right pressure, optimal discharge, and good pipe configuration can significantly improve system performance.
This research was supported by the Wonerejo Village Farmers Group, Kurik District, Merauke, South Papua (Grant Number: 025/258/WNR/I/2025), the Institute for Research and Community Service and the Department of Mechanical Engineering, Musamus University, Merauke who have supported and funded this research until completion.
|
Q |
water discharge, m³/s |
|
P |
water pressure, Bar |
|
g |
gravitational acceleration, m.s-2 |
|
A |
pipe cross-sectional area, m |
|
v |
water velocity, m/s |
|
E |
energy, W |
|
n |
rotation, rpm |
|
V |
voltage, volt |
|
h |
loss, m |
|
L |
pipe length, m |
|
D |
diameter, m |
|
f |
friction factor |
|
A |
current, Ampere |
|
Greek symbols |
|
|
$\rho$ |
density of water, kg/m3 |
|
$\vartheta$ |
velocity of water, m/s |
|
$\pi$ |
radius of pipe diameter |
|
η |
efficiency |
|
Subscripts |
|
|
f |
fluid (pure water) |
|
electric |
electric |
|
t |
Turbun |
|
g |
alternator |
[1] El Hamdaouy, A., Salhi, I., Doubabi, S., Essounbouli, N., Chennani, M. (2019). An integrated approach for modeling three-phase micro hydropower plants. European Journal of Electrical Engineering, 21(6): 479-487. https://doi.org/10.18280/ejee.210601
[2] Mohammed, R.A.N., Hamoodi, A.N., Al-Jawady, N.A.A.B. (2025). A real case study of hybrid system for enhancing the energy production. Journal Européen des Systèmes Automatisés, 58(2): 345-351. https://doi.org/10.18280/jesa.580215
[3] Casano, G., Piva, S. (2016). A renewable energy joint strategy for the implementation of local action plans for renewable energy. International Journal of Heat and Technology, 34(S2): S371-S378. https://doi.org/10.18280/ijht.34S226
[4] Mutani, G., Beltramino, S., Forte, A. (2020). A clean energy atlas for energy communities in Piedmont Region (Italy). International Journal of Design & Nature and Ecodynamics, 15(3): 343-353. https://doi.org/10.18280/ijdne.150308
[5] Parenden, D., Sahupala, P., Hariyanto, H. (2021). Utilization of solar energy for water pump installation design. International Journal of Heat and Technology, 39(3): 933-937. https://doi.org/10.18280/ijht.390329
[6] Sahupala, P., Latuheru, R.D. (2025). Analysis of grain drying using the pressure the flow of air heat forced convection method. International Journal of Heat and Technology, 43(1): 370-380. https://doi.org/10.18280/ijht.430138
[7] Sukamta, S., Kusmantoro, A. (2015). Planning of micro hydro power plant (PLTMH) Jantur Tabalas east Kalimantan. Journal of Electrical Engineering, 5(2). https://journal.unnes.ac.id/nju/jte/article/view/3555/3358.
[8] Kuntari, W., Sarwoprasodjo, S., Nurmalina, R., Sarma, M. (2023). Micro-hydro power plant-based social entrepreneurship practices in Rural West Java (A case study of Cintamekar village, Subang regency). Sodality: Jurnal Sosiologi Pedesaan, 11(2): 181-191. https://doi.org/10.22500/11202345076
[9] Nasir, B.A. (2014). Design considerations of micro-hydro-electric power plant. Energy Procedia, 50: 19-29. https://doi.org/10.1016/j.egypro.2014.06.003
[10] Elena, C., Laura, D., Fabio, A., Maurizio, R. (2020). Mini-hydro power plant for the improvement of urban water-energy nexus toward sustainability - A case study. Journal of Cleaner Production, 249: 119416. https://doi.org/10.1016/j.jclepro.2019.119416
[11] Sebestyén, V. (2021). Renewable and sustainable energy reviews: Environmental impact networks of renewable energy power plants. Renewable and Sustainable Energy Reviews, 151: 111626. https://doi.org/10.1016/j.rser.2021.111626
[12] Rumbayan, M., Rumbayan, R. (2023). Feasibility study of a micro hydro power plant for rural electrification in Lalumpe village, North Sulawesi, Indonesia. Sustainability, 15(19): 14285. https://doi.org/10.3390/su151914285
[13] Dametew, A.W. (2016). Design and analysis of small hydro power for rural electrification. Global Journals of Research in Engineering, 16(F6): 25-45.
[14] Walczak, N. (2018). Operational evaluation of a small hydropower plant in the context of sustainable development. Water, 10(9): 1114. https://doi.org/10.3390/w10091114
[15] Davirov, A., Kodirov, D., Mamadiyev, X. (2023). Study on screw turbine of the micro hydroelectric power plant working in low pressure water flows. E3S Web of Conferences, 434: 01011. https://doi.org/10.1051/e3sconf/202343401011
[16] Ombeni, J.M., Torbjorn, K.N., Cuthbert, Z.K., Joseph, K. (2018). Assessment of hydropower resources in Tanzania. Renewable Energy and Environmental Sustainability, 3: 4. https://doi.org/10.1051/rees/2018004
[17] Mohammed, R.A.N., Hamoodi, A.N., Al-Jawady, N.A.A.B. (2025). A real case study of hybrid system for enhancing the energy production. Journal Européen des Systèmes Automatisés, 58(2): 345-351. https://doi.org/10.18280/jesa.580215
[18] Alatas, M., Susilowati, E., Budiastuti, M.T.S., Gunawan, T., Setyono, P., Sunarto. (2022). Horizontal Trash rack Diverter Trash (HTDT) to minimize trash clogging at the intake of micro-hydro power plant. International Journal of Sustainable Development and Planning, 17(6): 1713-1720. https://doi.org/10.18280/ijsdp.170604
[19] Hira, S., Sachdev, A., Kumar, A., Niranjan, K. (2015). Analysis and evaluation of small hydropower plants: A bibliographical survey. Renewable and Sustainable Energy Reviews, 51: 1013-1022. https://doi.org/10.1016/j.rser.2015.06.065
[20] Ardizzon, G., Cavazzini, G., Pavesi, G. (2014). A new generation of small hydro and pumped-hydro power plants: Advances and future challenges. Renewable and Sustainable Energy Reviews, 31: 746-761. https://doi.org/10.1016/j.rser.2013.12.043
[21] Purvins, A., Papaioannou, I.T., Oleinikova, I., Tzimas, E. (2012). Effects of variable renewable power on a country-scale electricity system: High penetration of hydro power plants and wind farms in electricity generation. Energy, 43(1): 225-236. https://doi.org/10.1016/j.energy.2012.04.038