Hua Cao*![]() | Chunya Ma
| Chunya Ma![]() | Peng Li
| Peng Li![]() | Wei Zhan
| Wei Zhan![]() | Xiaotong Sun | Yinbo Cao
| Xiaotong Sun | Yinbo Cao![]() | Yongshen Fan
| Yongshen Fan![]()
© 2025 The authors. This article is published by IIETA and is licensed under the CC BY 4.0 license (http://creativecommons.org/licenses/by/4.0/).
OPEN ACCESS
This study focuses on the thermal-fluid-dynamic behavior and kinetic energy flux characteristics of hollow-cone atomizing micro-sprinklers in intelligent irrigation systems, systematically evaluating spray responses and thermal-kinetic energy coupling modeling methods under various operating conditions. By adjusting the nozzle working pressure (0.2-0.6 MPa) and installation height (0.4-1.0 m), six typical spraying conditions are constructed. High-frequency measurements of key parameters such as rainfall intensity, droplet size distribution, and particle count are collected using a laser disdrometer, followed by time-series dynamic analysis of the spraying process. The results show significant responses of rainfall intensity, kinetic energy flux (E), and radar reflectivity (Z) to variations in spraying conditions. A Z-E power law model (R² = 0.989) is further developed, demonstrating high fitting accuracy and low error characteristics in predicting kinetic energy flux, with an RMSE of 1.18 J/m²•h and an average relative error of less than 10%. Based on the principle of energy conservation, this study converts the dissipated kinetic energy of droplets into equivalent heat flux and incorporates it into the heat conduction control equation to establish a spray heat source term model, enabling the quantitative characterization of thermal-kinetic energy responses during spraying. The findings confirm the effectiveness of radar reflectivity as an energy prediction factor and provide theoretical support and parameter foundations for modeling spray thermal-kinetic energy conversion mechanisms and optimizing the energy efficiency of intelligent irrigation systems.
atomizing micro-sprinkler, kinetic energy flux, radar reflectivity, heat source term, thermal-kinetic energy coupling, Multiphysics modeling
Hollow-cone atomizing micro-sprayers are widely used in agricultural spraying, mist irrigation, spray cooling, as well as environmental and industrial spraying systems due to their fine droplet size distribution and excellent spray uniformity [1-3]. During the spraying process, the droplet size and velocity jointly determine the deposition efficiency, coverage area, and impact intensity. The kinetic energy flux (E) per unit area, as a key thermodynamic parameter for assessing spraying performance and crop energy efficiency, has gradually become a core indicator for system energy efficiency analysis and precision control [4-6].
In recent years, with the widespread use of high-resolution measurement devices such as laser disdrometers, researchers can obtain the droplet size-velocity joint spectra in artificial spraying environments, enabling the calculation of key energy parameters such as radar reflectivity (Z) and kinetic energy flux (E) [4, 7-9]. The Z value, as a volume-weighted indicator reflecting droplet spectrum characteristics, is widely used in meteorology for precipitation monitoring and raindrop energy estimation. By introducing this technology into spraying systems, real-time inversion and dynamic monitoring of spray intensity can be achieved, while also providing a theoretical basis for intelligent control and energy efficiency optimization of spray systems.
Existing research has systematically investigated the droplet spectrum characteristics of hollow-cone nozzles with respect to structural parameters, pressure regulation, and PWM-based flow control [2, 10]. The dominant mechanisms governing liquid film breakup during the initial phase of atomization and their influence on the droplet size distribution have been identified and analyzed [11, 12]. Furthermore, theoretical models incorporating nozzle geometry, fluid properties, and Reynolds numbers have been developed to describe the physical transition from liquid film instability to spray uniformity [11-13].
The Z–E relationship has been extensively examined in areas such as hydrology and soil erosion modeling. Based on raindrop spectrum moments, a power-law relationship between radar reflectivity, kinetic energy flux, and rainfall intensity has been proposed, forming a theoretical foundation for remote sensing-based precipitation estimation [14]. Subsequent work identified systematic errors in traditional Z–E models and validated these findings using controlled artificial rainfall systems [15]. Further improvements in model accuracy have been achieved through the application of multi-frequency radar, highlighting the sensitivity of the Z–E relationship to equipment configuration and droplet size distribution inputs [16-18]. However, it is important to note that these studies primarily focus on natural rainfall processes. In contrast, artificial spraying systems—particularly hollow-cone micro-sprayers characterized by higher spray intensities and narrower droplet size spectra—still lack systematic experimental validation and adaptable engineering models for Z–E relationships and kinetic energy characterization.
Against the backdrop of the continuous evolution of precision agriculture and intelligent spraying equipment, hollow-cone micro-sprayers, with their good modular characteristics, are seen as efficient spray units that can be integrated into future center pivot and linear move irrigation systems. If a kinetic energy flux prediction model based on real-time sensing parameters (such as Z) can be constructed and integrated with the nozzle control system for closed-loop regulation, it will be possible to achieve integrated control of thermal, fluid, and kinetic energy during the atomization process.
Based on the above research background and engineering requirements, this paper presents the following four aspects of work: (1) Utilizing a laser disdrometer system to collect droplet size-velocity spectra under different pressure and nozzle height combinations, calculating radar reflectivity Z and kinetic energy flux E, and analyzing their distribution characteristics; (2) Constructing a Z-E power-law model and exploring its fitting rules and physical interpretation; (3) Further mapping E to equivalent heat source terms and incorporating thermal-fluid-kinetic energy coupling modeling to provide theoretical support and simulation foundation for thermal impact assessment of spraying systems and thermodynamic integration of water-saving equipment. The research results contribute to advancing spray systems from hydraulically driven to integrated thermal-fluid-kinetic intelligent systems based on sensing, modeling, and control.
2.1 Atomizing micro-sprinkler experimental design
Hollow-cone atomizing micro-sprayers are widely used in precision pesticide application, greenhouse humidity control, and facility agriculture irrigation due to their stable atomization performance, concentrated droplet size distribution, and balanced kinetic energy output. During the spraying process, these nozzles create a typical annular cone spray structure, allowing droplets to achieve good diffusion and impact in space, making them suitable for thermal-fluid process modeling under multi-field coupling. Compared to fan-type nozzles and straight nozzles, hollow-cone atomizing nozzles offer advantages such as symmetrical spray structure, uniform distribution of droplet kinetic energy, and simple manufacturing process, making them particularly suitable for systematic experimental studies on energy flux and droplet transport behavior.
In this study, the KZ80(12) hollow-cone atomizing micro-sprayer is selected as the experimental object to simulate the atomization response behavior under various working conditions in an intelligent irrigation system. The droplet size-velocity joint distribution data are collected using a laser disdrometer, and key parameters such as radar reflectivity (Z) and kinetic energy flux (E) are calculated for the spray energy coupling modeling analysis. The nozzle operates under different combinations of working pressures and installation heights to simulate the changes in energy transfer and droplet deposition processes under actual field conditions, providing experimental data for nozzle structural optimization and thermal-kinetic energy coupling control strategies.
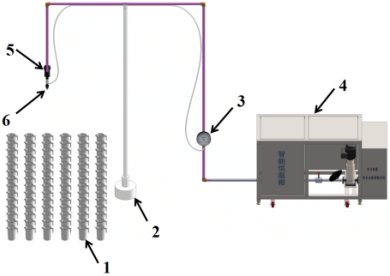
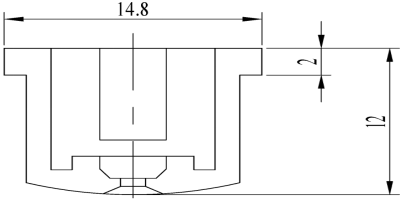
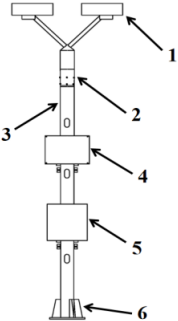
The flow performance of the nozzle under three pressure conditions (0.2 MPa, 0.4 MPa, and 0.6 MPa) was tested, and the results are shown in Table 1. The structure of the experimental system is shown in Figure 1, and the nozzle geometric configuration is shown in Figure 2. The installation method of the laser disdrometer (Parsivel2) is detailed in Figure 3.
Table 1. Flow characteristics of the KZ80(12) hollow-cone nozzle under different pressure conditions
|
Nozzle Model |
Pressure (MPa) |
Flow Rate (L/min) |
|
KZ80(12) |
0.2 |
0.82 |
|
0.4 |
1.03 |
|
|
0.6 |
1.31 |
Figure 1. Schematic diagram of the experimental setup
Figure 2. Schematic diagram of the hollow-cone nozzle structure (Units: mm)
Figure 3. Schematic diagram of the raindrop disdrometer
2.2 Experimental design and data acquisition
To systematically analyze the spraying performance and energy characteristics of the hollow-cone nozzle under different operating conditions, this study designed and implemented two complementary types of experiments: one for evaluating the uniformity of water distribution, and the other for obtaining the droplet size-velocity spectra and calculating key thermal-kinetic energy parameters, such as the spray kinetic energy flux.
2.2.1 Rain gauge layout and water distribution test
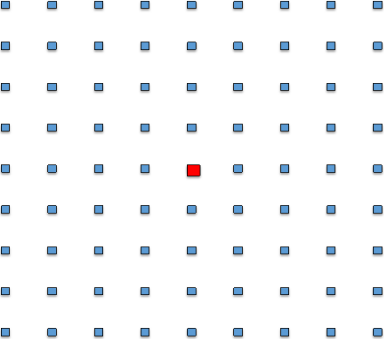
The standard Catch-Can Method is used to evaluate the spraying uniformity. The nozzle installation heights are set at 0.7 m and 1.0 m, representing common application scenarios for short to medium-stature crops (e.g., soybean, cotton) and tall crops (e.g., corn, sugarcane), respectively. A total of 81 rain gauges are arranged on the ground in the experimental area, uniformly distributed in a 0.25 m × 0.25 m grid, forming a 9 × 9 matrix, as shown in Figure 4.
Each experimental condition involves a spraying time of 1 hour, with three spraying pressures (0.2, 0.4, 0.6 MPa), resulting in a total of 6 typical combinations (2 heights × 3 pressures). After the experiment, the water depth in each rain gauge is measured, and the Christiansen Uniformity Coefficient (CU) and Distribution Uniformity (DU) are calculated. Contour and heat maps are then drawn for spatial visualization of the spraying area, revealing the sources of non-uniformity.
Figure 4. Schematic diagram of rain gauge layout (9×9 grid with 0.25 m spacing)
2.2.2 Laser disdrometer setup and droplet characteristics testing
To thoroughly reveal the dynamic response characteristics of droplet particles during spraying and their transport behavior under various conditions, a laser disdrometer (Model: Parsivel², PS32) is used for continuous monitoring and characteristic extraction of the droplets. The nozzle is vertically installed directly above the sampling window, with two spraying heights (0.4 m and 1.0 m) set to simulate the following typical application scenarios:
0.4 m Height: Represents a low-altitude spraying environment close to the crop canopy, enhancing the capture of fine droplets and the energy response recognition of low-speed particles.
1.0 m Height: Simulates a high-altitude, long-distance spraying scenario, aiding in the analysis of droplet size diffusion and kinetic energy attenuation during the fall.
Spraying lasts for 1 hour under each operating condition, and the disdrometer records time-series data at 1-minute intervals, resulting in a total of 60 sample sets. Measured parameters include droplet velocity distribution, particle count, rainfall intensity, radar reflectivity (Z), kinetic energy flux (E), and rain visibility, among other key indicators. These data provide high-resolution support for the subsequent development of the energy prediction model based on Z, analysis of droplet thermal-kinetic energy response patterns, and evaluation of energy uniformity in the spray field.
2.3 Model construction and validation method
To quantify the impact of spraying parameters on kinetic energy flux (E) and its thermal energy conversion, a power-law relationship model between radar reflectivity (Z) and E was constructed based on data obtained from the laser disdrometer. This model reveals the decisive role of droplet size spectrum structure in kinetic energy output and supports the path mechanism for the conversion of spray kinetic energy to thermal energy from a physical perspective. The model's generalization ability was tested using Leave-One-Out Cross-Validation (LOOCV), demonstrating good stability and adaptability. Additionally, a functional expression was developed for the relationship between kinetic energy flux (E) and thermal-fluid response. This model not only reveals the energy distribution characteristics of the spray system but also provides a basis for further exploration of the interaction between kinetic and thermal energy after droplet impact on the target surface.
3.1 Analysis of thermal and kinetic energy transfer characteristics during spraying
To systematically evaluate the spray output characteristics of the hollow-cone atomizing micro-sprayer under different operating conditions, this study extracted and compared the time-series statistical features of key spraying parameters, including: average rainfall intensity, peak rainfall intensity, coefficient of variation (CV) of rainfall intensity, radar reflectivity (Z), kinetic energy flux (E) per unit area, average visibility during rainfall, droplet count (drops/min), and the water uniformity index reflecting the energy distribution uniformity in the spray field (Christiansen Uniformity Coefficient, CU; Distribution Uniformity, DU). The statistical results of these parameters are detailed in Table 2.
Table 2. Statistical summary of spray performance indicators for hollow-cone atomizing micro-sprayers under different pressure and installation height conditions
|
Operating Conditions |
Average Rainfall Intensity (mm/h) |
Peak Rainfall Intensity (mm/h) |
Coefficient of Variation (CV) |
Average Radar Reflectivity (dBZ) |
|
|
0.2MPa-0.4m |
23.61a |
24.88a |
0.026a |
32.63a |
|
|
0.2MPa-1.0m |
9.71b |
13.13a |
0.16a |
28.46a |
|
|
0.4MPa-0.4m |
16.36b |
17.48a |
0.044a |
30.8a |
|
|
0.4MPa-1.0m |
10.12b |
21.79a |
0.2a |
28.81a |
|
|
0.6MPa-0.4m |
15.05b |
15.82a |
0.03a |
30.61a |
|
|
0.6MPa-1.0m |
12.11b |
15.2a |
0.084a |
29.91a |
|
|
Operating Conditions |
Kinetic Energy Flux (J/m2•h) |
Average Rainfall Intensity (m) |
Average Particle Count (drops/min) |
CU (%) |
DU (%) |
|
0.2MPa-0.4m |
49.48a |
65.36f |
16640a |
2.36b |
9.84a |
|
0.2MPa-1.0m |
15.3c |
140.58a |
8562f |
7.17b |
5.39a |
|
0.4MPa-0.4m |
28.01b |
86.19e |
12938b |
4.11b |
2.44a |
|
0.4MPa-1.0m |
17.61c |
132.1b |
8583e |
13.42b |
4.7a |
|
0.6MPa-0.4m |
26.77b |
102.04c |
11900c |
8.76b |
5.06a |
|
0.6MPa-1.0m |
22.97b |
95.55d |
9840d |
22.54a |
7.9a |
To test the significance of differences in spraying performance indicators under different conditions, Duncan's Multiple Range Test (DMRT) was applied, with a significance level set at P < 0.05. This statistical method quantified the effects of operating pressure and nozzle height combinations on spray energy structure and temporal stability, providing data support and criteria for parameter selection for subsequent thermal-kinetic energy transfer modeling.
To better understand the physical meaning and evaluation value of the spray performance indicators in Table 2 within the thermal-fluid system, the key variables are explained as follows:
Average and Peak Rainfall Intensity (mm/h): These represent the average liquid output level of the nozzle during stable operation and the instantaneous maximum spraying capacity, respectively. They are important indicators for assessing the overall water supply efficiency and impact intensity.
Coefficient of Variation (CV) of Rainfall Intensity: The ratio of the standard deviation to the mean of the rainfall intensity, used to characterize the temporal variability of the spraying process. A lower CV indicates more stable nozzle operation and higher consistency in spray output.
Radar Reflectivity (Z, dBZ): An energy indicator reflecting the combined characteristics of droplet size and density. A larger Z value indicates larger droplets, more droplets, and higher overall energy reflection intensity, indirectly reflecting the energy-carrying capacity of droplets per unit volume.
Kinetic Energy Flux (E, J/m2•h): The total amount of kinetic energy carried by droplets per unit time and area, reflecting the impact force and kinetic energy release capacity of the spraying system. It is a core physical variable for measuring atomization spraying efficiency.
Average Particle Count (drops/min): The total number of droplets detected per unit time through the measurement section, reflecting the atomization efficiency. A higher value indicates more small droplets produced by the system, enhancing atomization uniformity and coverage.
To better understand the physical meaning and evaluation value of the spray performance indicators in Table 2 within the thermal-fluid system, the key variables are explained as follows:
Average and Peak Rainfall Intensity (mm/h): These represent the average liquid output level of the nozzle during stable operation and the instantaneous maximum spraying capacity, respectively. They are important indicators for assessing the overall water supply efficiency and impact intensity.
Coefficient of Variation (CV) of Rainfall Intensity: The ratio of the standard deviation to the mean of the rainfall intensity, used to characterize the temporal variability of the spraying process. A lower CV indicates more stable nozzle operation and higher consistency in spray output.
Radar Reflectivity (Z, dBZ): An energy indicator reflecting the combined characteristics of droplet size and density. A larger Z value indicates larger droplets, more droplets, and higher overall energy reflection intensity, indirectly reflecting the energy-carrying capacity of droplets per unit volume.
Kinetic Energy Flux (E, J/m²•h): The total amount of kinetic energy carried by droplets per unit time and area, reflecting the impact force and kinetic energy release capacity of the spraying system. It is a core physical variable for measuring atomization spraying efficiency.
Average Particle Count (drops/min): The total number of droplets detected per unit time through the measurement section, reflecting the atomization efficiency. A higher value indicates more small droplets produced by the system, enhancing atomization uniformity and coverage.
Christiansen Uniformity Coefficient (CU, %): A typical indicator of spatial uniformity of water distribution, used to evaluate the consistency of liquid output from sprinklers across different areas. It serves as a fundamental parameter for assessing the precision of their regulation.
Distribution Uniformity (DU, %): Focuses on evaluating the difference between the minimum supplied water area and the overall average water supply level. It reflects the system's ability to guarantee performance in low-energy areas, serving as a common lower-limit uniformity indicator in agricultural irrigation systems.
3.1.1 Analysis of rainfall intensity and kinetic energy flux performance
Under the close-range spraying condition (0.4 m), the 0.2 MPa - 0.4 m condition exhibits the strongest droplet release capacity: its average rainfall intensity is 23.61 mm/h, peak intensity reaches 24.88 mm/h, and the kinetic energy flux per unit area is 49.48 J•m⁻²•h⁻¹, all of which are the highest among all conditions. According to Duncan's significance grouping, it belongs to the "a" category, significantly outperforming other condition groups (P < 0.05). This condition shows typical spray dynamics characteristics with larger droplet sizes, concentrated energy per unit, and strong impact penetration ability. However, the CU and DU values in this condition are only 2.36% and 9.84%, respectively, indicating a significant non-uniformity in the water distribution across the spray area, showing a typical trade-off of "strong kinetic energy - poor uniformity." This phenomenon can be attributed to the concentrated deposition effect of large droplets under the dominance of gravity and the minimal diffusion effect on the edge areas.
As the spraying pressure increases from 0.2 MPa to 0.4 MPa and 0.6 MPa, the spray system demonstrates a typical dynamic evolution trend of "enhanced atomization - reduced kinetic energy": both average rainfall intensity and kinetic energy flux decrease overall, while the droplet count per unit time increases significantly. This indicates that under higher pressure, the atomization effect of the nozzle improves, droplet size decreases, spatial particle density increases, but the energy density per unit area declines, and the droplet impact and penetration ability weaken. This "high atomization - low kinetic energy" state is beneficial for even mist layer coverage but may affect the directional deposition efficiency of pesticide or irrigation water.
3.1.2 Effect of installation height on spatial uniformity
Under the long-distance layout condition (1.0 m), the average rainfall intensity of all treatments belongs to the "b" category in Duncan's significance grouping, significantly lower than the short-distance layout group, and the kinetic energy flux also decreases significantly. For example, in the 0.2 MPa - 1.0 m condition, the kinetic energy flux is 15.3 J/m²•h, significantly categorized as "c," indicating that increasing the spraying distance reduces the energy transfer efficiency of droplets. Although the spraying intensity weakens, both CU and DU values show an overall increasing trend, with the spray distribution becoming more uniform. Especially in the 0.6 MPa - 1.0 m condition, the CU reaches 22.54%, the highest among all treatments (a category); the DU value increases to 7.90%, indicating that high-pressure long-distance spraying is beneficial to the spatial consistency and uniform coverage of droplet deposition to a certain extent.
3.1.3 Effect of installation height on kinetic energy attenuation and spatial uniformity
Under the long-distance layout condition (1.0 m), the average rainfall intensity of all treatment groups is significantly lower than that under the short-distance (0.4 m) condition, and the corresponding Duncan significance grouping belongs to the "b" category (P < 0.05), indicating that increasing the spraying distance significantly weakens the overall droplet output intensity. Similarly, the kinetic energy flux per unit area of the spray system also shows a decreasing trend. For example, in the 0.2 MPa - 1.0 m condition, the kinetic energy flux decreases to 15.30 J•m⁻²•h⁻¹, significantly categorized as "c," indicating that the kinetic energy of droplets is significantly lost during flight, and the spray energy transfer efficiency decreases as the distance increases.
Despite the weakening of liquid kinetic energy output in long-distance spraying, its spatial distribution uniformity indicators (CU and DU) show an overall increasing trend. This characteristic suggests that, during long-distance flight, the air resistance and velocity decay reduce local droplet accumulation, thereby expanding the spray coverage area and enhancing the spray consistency of the system.
Especially in the 0.6 MPa - 1.0 m condition, the CU value reaches 22.54%, significantly higher than that of other groups (Duncan grouping "a" category), which is the highest among all test conditions. At the same time, the DU value increases to 7.90%, indicating that high-pressure long-distance spraying can, to some extent, promote uniform droplet deposition and coverage, thereby improving the distribution consistency of droplets in the agricultural region.
The above results demonstrate a typical "kinetic energy attenuation - uniformity improvement" spatial response trade-off: while increasing spraying height reduces the direct impact force of droplets on the target surface, under high-pressure atomization, the droplet size decreases, particle diffusion increases, which benefits a wider coverage area and a more uniform deposition structure. This has engineering significance for improving the thermal-kinetic energy spatial consistency of multi-nozzle collaborative output in intelligent irrigation systems.
3.1.4 Relationship between radar reflectivity and droplet size structure
Under the 0.2 MPa - 0.4 m condition, the radar reflectivity (Z) reaches 32.63 dBZ, categorized as "a" in Duncan's significance grouping, significantly higher than the other treatments. This indicates that under this condition, the droplet size is larger, and the concentration is higher, resulting in stronger radar echo signals, which is consistent with the high rainfall intensity and kinetic energy flux. In the high-pressure, long-distance condition (e.g., 0.6 MPa - 1.0 m), the Z value decreases to approximately 29-30 dBZ, and the average particle count also significantly decreases, classified as "e-f" in Duncan's grouping. This indicates a transition of the spray structure from "large and sparse" to "small and dense."
Due to the reduction in droplet size and enhanced diffusion, the droplets' ability to block light beams decreases, leading to a significant increase in average visibility during rainfall. For example, under the 0.2 MPa - 1.0 m condition, the visibility reaches 140.58 m, indicating that the interference of droplets with spatial optical scattering is reduced, and the visibility of the spray is significantly enhanced.
3.1.5 Coupled response characteristics of radar reflectivity and droplet size structure
Under the 0.2 MPa - 0.4 m condition, the radar reflectivity (Z) reaches 32.63 dBZ, significantly higher than the other treatment groups (classified as "a" in Duncan's significance grouping), indicating that the spray droplets in this state have larger sizes and higher density, with a stronger radar wave reflection capability. This performance is highly consistent with the observed high rainfall intensity and kinetic energy flux output, reflecting the typical "large droplet size - high energy - strong echo" spraying pattern.
In contrast, under the high-pressure long-distance condition (e.g., 0.6 MPa - 1.0 m), the Z value decreases significantly to the range of 29-30 dBZ, and the average particle count decreases correspondingly (classified as "e-f" in Duncan's grouping), indicating that the spray structure evolves towards "small droplet size - low reflectivity." Under higher pressure and long-distance spraying conditions, droplets experience more intense breakage and diffusion after ejection, leading to significantly smaller droplet sizes, increased spacing between droplets, and a resulting decrease in the overall radar echo signal.
Due to the combined effects of smaller droplet sizes and sparser droplet distribution, the droplets' ability to block visible light beams is reduced, resulting in a significant increase in average visibility during rainfall. For example, under the 0.2 MPa - 1.0 m condition, the average visibility reaches 140.58 m, the highest value among all treatments, indicating that the spray system in this condition has the least interference with spatial optical scattering and optimal visibility.
In summary, there is a significant coupled response relationship between Z value and droplet size structure. The radar reflectivity under different spraying conditions can serve as an indicator of the droplet volume distribution and energy transfer state. Furthermore, combining radar signals for real-time inversion of droplet size spectrum characteristics will provide a feasible physical foundation for spray control strategies based on reflectivity feedback in intelligent irrigation systems.
3.1.6 Droplet count and spray stability
The experimental results show that the droplet count does not increase monotonically with increasing pressure. For example, under the 0.6 MPa - 1.0 m condition, the average particle count is 9840 drops/min, significantly lower than the 16640 drops/min under the 0.2 MPa - 0.4 m condition. Duncan's significance grouping classifies them as "f" and "a," respectively, and the difference is statistically significant. This phenomenon may be caused by two factors: first, high-pressure atomization produces a large number of ultrafine droplets, some of which have sizes smaller than the detection limit of the laser disdrometer, leading to missed detection; second, as the spray diffusion radius increases, some droplets deviate from the sampling window of the disdrometer, resulting in reduced capture efficiency.
Moreover, the coefficient of variation (CV) of rainfall intensity for most treatments is below 0.05, indicating that the spraying process is relatively stable. However, in some high-pressure, long-distance conditions (e.g., 0.4 MPa - 1.0 m), the CV reaches 0.20, suggesting that the device may experience some oscillations or local flow field instability under high-pressure operation, which should be addressed during system optimization design.
From the above results, it is clear that there is a noticeable trade-off between spray intensity and spatial uniformity in hollow-cone atomizing micro-sprayers. Under low-pressure, short-distance conditions, the nozzle achieves maximum kinetic energy output and rainfall intensity, but droplets tend to concentrate in the edge areas, leading to poorer spatial distribution uniformity. In contrast, high-pressure long-distance spraying sacrifices some kinetic energy flux and water output but significantly improves spatial consistency and the balanced deposition of droplets. Therefore, the optimization design of future nozzle systems should consider the nozzle geometry, water pressure control strategies, and installation height to achieve a synergistic optimization and dynamic balance between spray intensity and uniformity for specific application scenarios.
3.2 Time-series analysis of spray particle response behavior
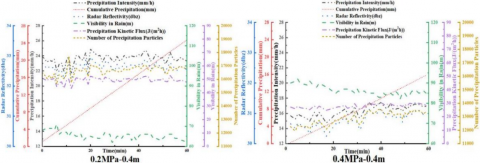
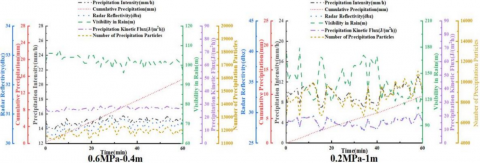
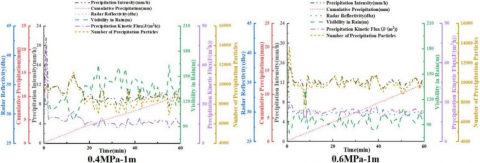
To study the dynamic response behavior of spray particles under different pressure and installation height conditions, a laser disdrometer was used to continuously monitor key spraying parameters in time-series. Figure 5 illustrates the trend of parameter variations under two installation heights (0.4 m and 1.0 m) and three pressure levels (0.2, 0.4, and 0.6 MPa).
Figure 5. Time-series variation of spray particle characteristics under different operating conditions (laser disdrometer at 0.4 m and 1.0 m from the nozzle, with pressures of 0.2, 0.4, and 0.6 MPa)
Under the short-distance layout (0.4 m) condition, the nozzle exhibits the strongest spraying performance at 0.6 MPa, with peak rainfall intensity reaching 35 mm/h, kinetic energy flux exceeding 70 J/m²•h, radar reflectivity reaching 45 dBZ, and droplet count approaching 1000 drops/min. At the same time, the average visibility in the spray field is reduced to the lowest, indicating that the large droplet size and high density result in significant light beam attenuation, and the spray structure tends to be denser.
Under the high-distance layout (1.0 m) condition, the particle deposition process is more stable, with a significant increase in rainfall visibility. Cumulative rainfall increases almost linearly over time, reflecting the stable operation of the spraying system, with droplets fully diffusing and uniformly depositing along the extended flight path, contributing to the formation of a balanced coverage pattern.
Overall, the time-series data show that increasing pressure enhances droplet kinetic energy and deposition intensity but also introduces the risk of light beam shielding due to increased droplet density. Meanwhile, installation height primarily improves spatial distribution uniformity by extending droplet trajectories and changing their deposition patterns. The combined effect of pressure and height creates a behavioral spectrum with the "near-far" and "weak-strong" response dimensions (as detailed in Table 3), providing a theoretical basis for nozzle performance evaluation and the optimization design of thermal-fluid spraying systems.
Table 3. Time-series response spectrum of spray performance
|
Response Dimension |
Control Variable Changes |
Particle Behavior Characteristics |
Typical Indicator Representation |
|
Near → Far |
Increase in installation height from 0.4 m to 1.0 m |
Near: Droplet concentration, larger size; Far: Droplet collision, smaller size |
Decrease in intensity, higher visibility, stable kinetic energy |
|
Weak → Strong |
Increase in spraying pressure from 0.2 MPa to 0.6 MPa |
Weak: Smaller droplets, lower energy, concentrated spray; Strong: Larger droplets, higher energy, more dispersed spray |
Increased radar reflectivity, increased kinetic energy, lower visibility |
3.3 Spatial distribution structure of sprayed water and thermo-fluid behavior characteristics
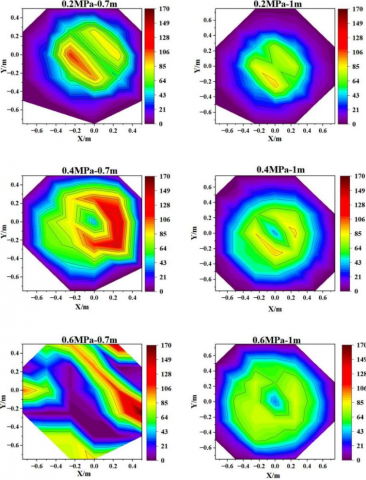
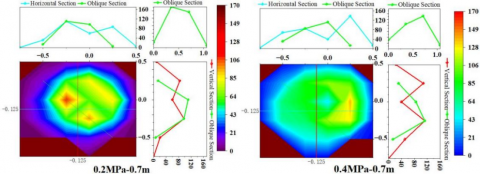
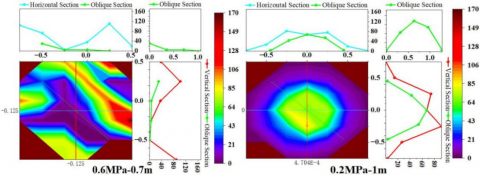
To systematically reveal the spatial spraying behavior of hollow-cone atomizing micro-sprayers under various combinations of pressure and installation height, six representative working conditions were selected (0.2/0.4/0.6 MPa × 0.7/1.0 m). Contour maps of surface water distribution were generated (see Figure 6), reflecting the spatial coverage and intensity distribution of droplet deposition on the operational surface. Water quantity is expressed as precipitation per unit area (mm), representing the local liquid flux induced by spraying. The spatial distribution of this flux has significant implications for kinetic and thermal energy transfer, localized cooling/humidification effects, and energy dissipation characteristics.
Figure 6. Contour maps of water distribution for hollow-cone atomizing micro-sprayer under different operating conditions
(1) Typical Thermo-Fluid Spray Structure Characteristics
Under the low-pressure (0.2 MPa) and medium-height (0.7 m) condition, the initial velocity of the droplets is relatively low, and the flight time is limited, resulting in a typical “hollow cone” deposition pattern—momentum concentrates at the periphery while the central region receives less water. This indicates insufficient synergy between droplet kinetic energy and flight trajectory, leading to a low spatial transfer efficiency of thermal-kinetic flux. When the installation height increases to 1.0 m, the droplet flight path is significantly extended, allowing more diffusion and kinetic energy dissipation in the air. As a result, the central sparse zone becomes less pronounced and the water distribution becomes more symmetrical, suggesting improved thermo-mass diffusion coupling capability. However, due to limited system energy input, the improvement in deposition uniformity remains constrained.
Under the medium-pressure (0.4 MPa) and short-distance (0.7 m) condition, the water distribution contours exhibit local skewness and asymmetry. This may be attributed to instabilities in the nozzle's swirling field or minor deviations in nozzle assembly, which induce jet angle shifts and local flow disturbances, leading to unstable directions of thermal-momentum transfer. When the installation height is raised to 1.0 m, the extended trajectory and enhanced gas-liquid interaction promote more uniform coverage, with the contour lines forming an elliptical closed shape. The resulting distribution reflects a well-balanced thermo-fluid response structure and significantly improved heat transfer uniformity.
Under the high-pressure (0.6 MPa) and long-distance (1.0 m) condition, the nozzle generates strong swirling flow and high-speed atomization. Droplets possess sufficient kinetic energy and extended flight time, resulting in a typical concentric ring-like water distribution. In this case, thermal-kinetic flux transfer is highly efficient, with droplets undergoing extensive momentum diffusion and energy dissipation in the air. The resulting deposition layer exhibits favorable thermo-fluid coupling characteristics, providing a stable structural foundation for achieving highly uniform thermal-mass coverage.
(2) Identification of Typical Conditions Exhibiting Abnormal Thermo-Fluid Spray Structures
Under the 0.6 MPa - 0.7 m condition, a typical "fragmented-deflected" spray structure was observed: the water distribution contour lines showed broken color bands and distortion, with localized regions of high-intensity deposition and the overall pattern deviating from the expected diffusive thermo-fluid deposition structure. The possible mechanisms include:
Diffusion imbalance caused by high kinetic energy and short-range deposition: The initial droplet velocity is excessively high, and the flight distance is too short, resulting in incomplete thermal-momentum transfer before the droplets concentrate and deposit in near-center or offset regions. This leads to severe spatial mismatch in thermal flux, insufficient droplet cooling, and localized saturation and over-deposition, ultimately forming patch-like deposition patterns.
Asymmetric swirling flow and enhanced disturbances: Under high-pressure conditions, even slight asymmetries in the nozzle orifice or eccentricity in the swirl chamber can trigger intense vortex disturbances. These cause jet path deflection and disrupt the directional stability of thermal-fluid transport, damaging the system's thermal-mass coupling stability and inducing "local overheating-local cold spot" effects.
In summary, hollow-cone nozzles operating under high pressure and short spraying distances are prone to multi-field instabilities involving thermal, flow, and momentum interactions, resulting in abnormal spatial deposition. Such working conditions should be considered critical boundary constraints in system optimization and control algorithm design. Thermo-kinetic energy analysis of these abnormal spray patterns can help identify the stability limits of the system and provide a thermodynamic basis and corrective direction for intelligent spray layout and precision nozzle manufacturing.
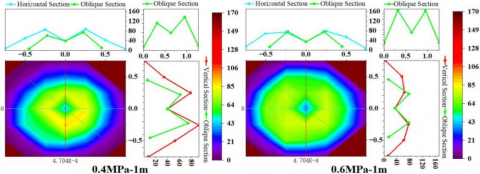
3.4 Analysis of cross-sectional evolution and kinetic energy dissipation characteristics of sprayed droplets
To further elucidate the spatial deposition behavior and kinetic energy transfer characteristics of droplets sprayed by hollow-cone atomizing micro-sprayers under different operating conditions, this study generated water depth contour maps and three-directional cross-sectional profiles (horizontal, vertical, and oblique) based on the measured water distribution data. A systematic comparison of the cross-sectional structures under six representative conditions was conducted to extract the response mechanisms of spray distribution patterns and uniformity. Additionally, from a thermal engineering perspective, the analysis focused on kinetic energy dissipation and potential energy deposition pathways to better understand the spray field dynamics and energy transformation processes.
3.4.1 Evolution of cross-sectional structures and kinetic energy response
As shown in Figure 7, different combinations of pressure and nozzle installation height significantly influence the morphology of the spray cross-section, reflecting the spatial evolution patterns of droplet kinetic energy transfer pathways:
Under the low-pressure and low-height condition (0.2 MPa - 0.7 m), the cross-sectional profile exhibits a distinct dual-peak structure, with water depth near zero in the central region, forming a typical “central void” phenomenon. This indicates insufficient initial kinetic energy of the droplets, preventing them from penetrating the core of the atomization cone and achieving uniform deposition. The dissipation of kinetic energy tends to concentrate along the edges.
Figure 7. Cross-sectional analysis of water distribution for hollow-cone atomizing micro-sprayer
Under the medium-pressure condition (0.4 MPa - 0.7 m), the cross-section becomes more continuous, although the edge peaks show slight lateral shifts, suggesting directional deviation in the atomized spray. This asymmetry in kinetic energy release may be attributed to disturbances in the nozzle or asymmetric local turbulence induced by flow irregularities.
In the high-pressure, low-height condition (0.6 MPa - 0.7 m), the profile reveals multiple local discontinuities and sharp gradients in water depth. These indicate that droplets may undergo rebound or enhanced near-ground turbulence due to excessive kinetic energy, resulting in localized regions of high-energy concentration and reduced spray stability.
As the installation height is increased to 1.0 m, the droplet flight path becomes longer, allowing for more complete dissipation of kinetic energy. Consequently, the cross-sectional profiles become smoother and more symmetrical, with natural transitions in water depth and significantly improved spray uniformity. Among them, the 0.6 MPa - 1.0 m condition exhibits the most regular profile, demonstrating a well-matched kinetic energy-deposition mechanism and strong potential for constructing a stable thermal-kinetic energy coupling model.
3.4.2 Attribution of cross-sectional features and structural optimization direction
Analysis of the six cases in Figure 7 shows that the spatial uniformity of the cross-sectional structure is highly consistent with the corresponding CU and DU indices. Particularly under the 0.6 MPa–1.0 m condition, the profile exhibits strong symmetry, a continuous edge-to-center transition, and no local abrupt faults, indicating that this parameter set establishes a coordinated coupling among kinetic energy output, particle dispersion, and terminal deposition.
The observed "edge-concentrated-center-sparse" distribution in the profiles essentially reflects the physical limitations of droplet kinetic energy dissipation and restricted flight paths under low-pressure or low-height conditions. In contrast, high-pressure and high-installation setups improve the uniformity of particle energy distribution and help avoid localized deposition anomalies caused by abrupt energy transitions. From the perspective of thermo-fluid-kinetic coupling theory, these cross-sectional differences are directly related to the uniformity of heat transfer pathways per unit area and the system's evaporation efficiency.
In summary, although the cross-sectional water distribution maps are derived from measurements of droplet deposition, their spatial structure is highly correlated with droplet kinetic energy dissipation trajectories. They hold significant physical meaning within thermo-fluid-kinetic systems and provide a theoretical basis for constructing particle-based energy conservation models and optimizing the thermal performance of spraying systems.
3.5 Thermo-kinetic energy relationship modeling of droplet characteristics and spray response mechanism
3.5.1 Empirical fitting of radar reflectivity and kinetic energy flux (univariate power function model)
Kinetic energy flux (E) is a key physical parameter used to characterize the spraying intensity of nozzles. It represents the total kinetic energy carried by a population of droplets per unit time and unit area, reflecting the energy density of droplet impact on the target surface. In this study, E is calculated based on the droplet size distribution and corresponding fall velocity measured by the laser disdrometer, and is expressed as follows:
$E=\int_0^{\infty} \frac{1}{2} \cdot \rho \cdot \frac{\pi}{6} \cdot D^3 \cdot v(D)^2 \cdot N(D) \cdot v(D) d(D)$ (1)
where ρ is the liquid density (taken as 1000 kg/m³), D is the droplet diameter, v(D) is the terminal velocity of droplets with diameter D, and N(D) is the droplet size distribution function.
Radar reflectivity (Z, in units of dBZ) is a commonly used parameter to describe the reflectivity of liquid particles per unit volume to electromagnetic waves. In artificial spraying environments, it similarly reflects the droplet size structure and spatial concentration. The calculation is expressed as follows:
$Z=\int_0^{\infty} N(D) \cdot D^6 d D$ (2)
where N(D) is the number density of droplets with diameter D per unit volume (unit: mm⁻³•mm⁻¹), and D is the droplet diameter in millimeters.
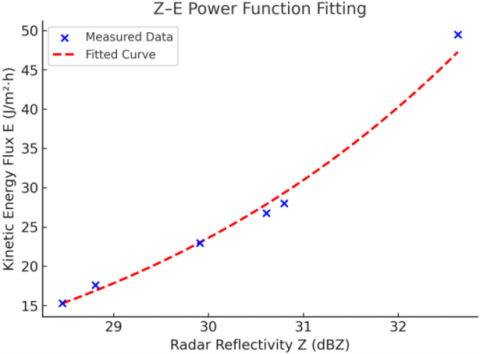
It can be seen that E corresponds to the fifth-order moment of the droplet spectrum, while Z corresponds to the sixth-order moment. Since both are derived from the same droplet size distribution, a theoretical power-law relationship is expected between them. To validate this hypothesis, an empirical model was fitted based on six representative spraying conditions, as follows:
$E=1.45 \times 10^{-11} \cdot Z^{8.27}\left(R^2=0.989\right)$ (3)
where E is the kinetic energy flux per unit area, in units of J/m²•h, and Z is the average radar reflectivity, in units of dBZ.
The results show that the coefficient of determination R² is 0.989, and the root mean square error (RMSE) is 1.18 J/m²•h, indicating a high fitting accuracy, with the model explaining approximately 98.9% of the variation in E. Figure 8 shows the power-law fitting relationship between radar reflectivity and kinetic energy flux. The blue crosses represent the measured data points, and the red dashed line is the power-law fit curve, demonstrating a significant positive correlation between the two (R² = 0.989), supporting the idea that Z can serve as an effective predictor of spray kinetic energy.
Figure 8. Power-law fitting relationship between radar reflectivity and kinetic energy flux
Furthermore, the power-law model not only has good physical interpretability but also exhibits statistical stability. On one hand, an increase in radar reflectivity indicates a rise in droplet size or concentration, which in turn drives a corresponding increase in kinetic energy flux. On the other hand, the model's logarithmic linearization facilitates parameter estimation and residual testing. Therefore, this empirical model reveals the quantitative relationship between radar reflectivity and kinetic energy flux, providing a theoretical basis and practical value for subsequent spray kinetic energy prediction, nozzle performance evaluation, and thermal-kinetic energy optimization of spray systems.
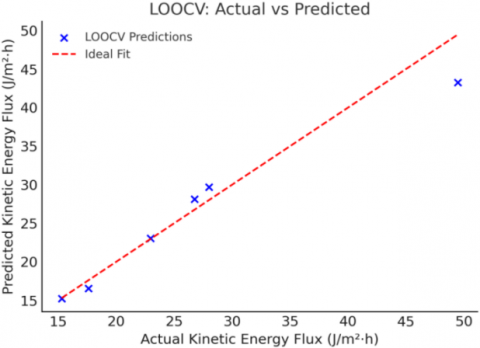
To further evaluate the predictive capability and generalization performance of the constructed power-law model between radar reflectivity and kinetic energy flux under unseen conditions, this study employed the Leave-One-Out Cross-Validation (LOOCV) method for systematic verification. Specifically, in each iteration, one set of spraying condition data was randomly excluded as the validation set, while the remaining five sets were used for model fitting. This process was repeated for six rounds, yielding predicted and observed values for all operating conditions.
Figure 9. Comparison of predicted and measured values under leave-one-out cross-validation (LOOCV)
Figure 9 presents the comparison between predicted and measured kinetic energy flux values during the cross-validation process. The red dashed line represents the ideal fit line (prediction = observation), and the blue scatter points denote the model’s predictions under each condition. Most of the points are closely distributed around the ideal line, with residuals showing random dispersion and no systematic bias, indicating good model stability and generalization ability.
Further calculations show that the model yields a root mean square error (RMSE) of 2.73 J/m²•h and a mean absolute error (MAE) of 1.74 J/m²•h under LOOCV validation, suggesting overall robust predictive performance. Table 2 lists the observed values, predicted values, and relative errors for each spraying condition. The results show that the prediction errors are generally within ±2 J/m²•h, with the maximum relative error not exceeding ±10%, and most conditions maintaining relative errors within ±5%.
These findings demonstrate that the proposed power-law model not only exhibits statistical significance in fitting but also possesses strong engineering applicability and predictive reliability under small-sample scenarios. It offers a feasible theoretical pathway for estimating spray kinetic energy flux based on radar reflectivity.
To further analyze the model’s error performance under each spraying condition, Table 4 presents the measured values, predicted values, absolute deviations, and relative errors for each test case. The results show that all prediction deviations are within ±2 J/m²•h, with the maximum relative error not exceeding ±10%. For several conditions, the relative error remains within ±5%, demonstrating the model’s strong stability and engineering adaptability.
Table 4. Prediction results and error evaluation of the power-law model
|
Condition |
Measured Kinetic Energy Flux (J/m²•h) |
Predicted Kinetic Energy Flux (J/m²•h) |
Error (J/m²•h) |
Relative Error (%) |
|
0.2 MPa - 0.4 m |
49.48 |
47.75 |
-1.73 |
-3.50 |
|
0.2 MPa - 1.0 m |
15.30 |
15.41 |
0.11 |
0.72 |
|
0.4 MPa - 0.4 m |
28.01 |
29.63 |
1.62 |
5.78 |
|
0.4 MPa - 1.0 m |
17.61 |
17.05 |
-0.56 |
-3.18 |
|
0.6 MPa - 0.4 m |
26.77 |
28.15 |
1.38 |
5.16 |
|
0.6 MPa - 1.0 m |
22.97 |
22.65 |
-0.32 |
-1.39 |
3.5.2 Estimation of droplet kinetic-to-thermal energy conversion and heat source term modeling
During the atomization and spraying process, a portion of the droplet's kinetic energy is converted into thermal energy through microscale mechanisms such as liquid film vibration, shear dissipation, and turbulent attenuation—either upon droplet impact with the target surface or during airborne evaporation and diffusion. This conversion not only leads to localized temperature rises within the spraying area but also affects the surface temperature distribution of plant leaves and the evaporation behavior of droplets.
To quantify this energy transformation, a heat source model is developed based on the principle of energy conservation. The objective is to establish a mathematical formulation that captures the conversion of droplet kinetic energy into heat, thus providing a heat source term for subsequent Multiphysics simulations of thermo-fluidic spray behavior.
Within a unit time and per unit area, a portion of the spray kinetic energy flux (E) can be considered as an effective thermal flux (Qs), calculated as follows:
$Q_s=\eta \cdot E$
The coefficient η represents the effective efficiency of kinetic-to-thermal energy conversion and is influenced by factors such as droplet size, impact velocity, surface roughness, and interfacial physical properties. Here, E denotes the measured kinetic energy flux (in J/m²•h).
The equivalent thermal flux Qₛ (in W/m²) represents the heat energy input that can be regarded as a surface heat source in the spray impact area. The conversion coefficient η (dimensionless, typically ranging from 0.1 to 0.3) represents the proportion of kinetic energy converted into thermal energy. E is the kinetic energy flux measured by the laser disdrometer, expressed in J/m²•h.
To quantitatively evaluate the thermal response characteristics under different spraying conditions, six typical experimental scenarios were selected. Assuming a constant conversion efficiency of η = 0.2, the calculated results are summarized in Table 5.
As shown in Table 5, under the low-pressure and low-height condition (0.2 MPa-0.4 m), the kinetic energy flux reaches 150.56 J/m²•h, with the corresponding equivalent heat flux being 0.042 W/m². Although this operating condition yields one of the highest kinetic energy flux values among all tested cases, the corresponding heat flux is not the highest, indicating a relatively efficient conversion of droplet kinetic energy into thermal energy. This suggests a pronounced microscale heat source effect under such a spraying condition.
Table 5. Estimated results of kinetic energy flux and equivalent heat flux under typical spraying conditions
|
Spraying Condition |
Kinetic Energy Flux E (J/m²•h) |
Equivalent Heat Flux Qs (W/m²) |
|
0.2 MPa - 0.4 m |
150.56 |
0.042 |
|
0.2 MPa - 1.0 m |
132.99 |
0.037 |
|
0.4 MPa - 0.4 m |
93.12 |
0.026 |
|
0.4 MPa - 1.0 m |
116.61 |
0.032 |
|
0.6 MPa - 0.4 m |
71.23 |
0.020 |
|
0.6 MPa - 1.0 m |
92.94 |
0.026 |
Furthermore, when constructing thermo-fluidic coupling models based on the Finite Volume Method (FVM) or Finite Element Method (FEM), this heat source term can be embedded into the energy equation as a source term:
$\rho \cdot c_p \frac{\partial T}{\partial t}+\nabla \cdot(-k \nabla T)=Q_s$
where, ρ denotes the surface density of the crop (kg/m³), cp is the specific heat capacity (J/kg•K), T represents the temperature field variable (K), k is the thermal conductivity (W/m•K), and Qs is the equivalent heat input term (W/m²) resulting from the conversion of droplet kinetic energy.
In summary, the proposed heat source estimation model not only theoretically reveals the mapping relationship between droplet kinetic energy dissipation and heat flux but also provides a quantitative basis for subsequent simulations of local temperature distribution and control of spray-induced thermal effects. This approach enables a rapid approximation of the energy field without the need to fully resolve the temperature field, offering practical engineering value for improving the thermal-kinetic energy utilization efficiency of spray systems and managing crop leaf surface temperatures.
Based on six representative spraying conditions of hollow-cone atomizing micro-sprinklers, this study systematically analyzed the influence of operating pressure and installation height on droplet distribution characteristics and kinetic energy flux. A power-law model relating radar reflectivity (Z) to kinetic energy flux (E) was established, along with an extended multivariable regression model. Furthermore, a thermo-kinetic coupling mechanism and a heat source term model were introduced to construct an integrated thermo-fluidic analytical framework for spray energy transformation. On this basis, the following three key issues are discussed in depth.
4.1 Coupling mechanism between atomization structure and spraying performance
The hollow-cone nozzle is essentially an edge-enhanced atomizing device, where the liquid film breakup mechanism leads to a characteristic annular droplet distribution with sparse central deposition [19, 20]. Experimental results show that under low-pressure and low-height conditions, a distinct "central void" appears in the deposition profile, and both the Christiansen uniformity coefficient (CU) and distribution uniformity (DU) decrease significantly. This is consistent with previous studies that reported insufficient droplet deposition and intensified near-field overlap for cone-type nozzles under low kinetic energy conditions [21]. In contrast, under high-pressure and elevated configurations, droplets gain greater initial momentum and travel distance, resulting in smoother and more symmetric profiles and significantly improved spatial uniformity. The spatial pattern of droplet kinetic energy distribution closely aligns with the contour of water depth in the deposition profiles, further confirming that spray uniformity is governed not only by liquid supply stability but also by a combination of atomization mode, droplet size-velocity spectra, and droplet trajectory.
From an energy transformation perspective, a portion of the droplet's kinetic energy is converted into localized thermal energy during impact or turbulent dissipation, generating microscale thermal perturbations. In high kinetic flux conditions—for instance, 0.2 MPa-0.4 m—the measured kinetic energy flux (E) reached 150.56 J/m²•h, corresponding to an estimated equivalent heat flux of 0.042 W/m². This indicates considerable potential for thermal energy release, providing a quantitative basis for analyzing spray-thermal field interactions.
4.2 Physical rationality and scalability of the model
The power-law model established in this study between radar reflectivity (Z) and kinetic energy flux (E) is grounded in strong theoretical foundations. Specifically, Z represents the sixth-order spectral moment, while E corresponds to the fifth-order dynamic moment; both are derived from the same droplet size-velocity spectra, and are thus theoretically expected to exhibit a power-law relationship [22]. Experimental results confirmed this physical assumption, with the model yielding a high coefficient of determination (R²=0.989) and a low root-mean-square error (RMSE=1.18 J/m²•h). These results indicate that the model is not only physically interpretable but also statistically robust and predictive.
Building upon this foundation and to enhance the engineering relevance in thermal applications, E was further transformed into an equivalent heat source term (Qs), which was incorporated into the energy conservation equation. This enabled the construction of a thermo-fluidic coupling simulation framework. Simulation results suggest that high kinetic energy regions can induce enhanced droplet evaporation and liquid film cooling effects, subsequently altering the temperature field distribution on target surfaces. This modeling approach demonstrates significant potential in agricultural microclimate regulation and thermal efficiency evaluation of spray systems.
4.3 Multiphysics simulation and the extended value for water-saving equipment applications
Previous studies have demonstrated the feasibility and practicality of integrating micro-sprinkling systems into large-scale irrigation platforms. For instance, one study deployed controllable atomizing nozzles on a center-pivot irrigation system, enabling simultaneous water-pesticide application with distribution uniformity ranging from 87% to 95% [23]. Similarly, the Accu-Pulse low-volume spray system has been successfully embedded in mobile irrigation equipment, exhibiting stable droplet fineness and coverage profiles under field conditions [24]. In addition, fluid modeling of small-orifice nozzles suggests that optimized spray height and travel speed can yield distribution uniformity exceeding 98% [25].
The models developed in this study provide quantitative support for such systems. The Z-E model, when combined with radar or laser-based droplet monitoring systems, can facilitate the development of feedback-controlled spraying algorithms to enable real-time kinetic energy adjustment. Future work should focus on coupling effects between multiple nozzles, droplet energy attenuation across crop canopies, and the model’s transferability across crop types and topographic conditions. Such efforts will promote the integration of spray-perception-control closed-loop systems in intelligent water-saving irrigation equipment.
Within the proposed thermo-fluidic Multiphysics framework, this study also outlines a modeling approach based on the COMSOL Multiphysics platform. By simulating the kinetic energy flux and equivalent heat source terms, future research can investigate transient thermal responses and spatial temperature distributions resulting from droplet impact on surfaces. Specifically, the study plans to explore localized heating mechanisms and heat diffusion patterns under various spraying configurations. Simulation results are expected to reveal that under high kinetic energy conditions, the heat source density significantly increases, with heat concentrated in the central spray zone, forming pronounced temperature gradients and exhibiting boundary heat migration characteristics typical of spray cooling systems.
Building upon the spatial characteristics of the heat source term, this study proposes a design logic for nozzle layout optimization and energy efficiency control: by adjusting nozzle height, operating pressure, and spatial spacing, the spray kinetic energy distribution can be aligned with crop leaf temperature regulation demands. This would enable precise control of evaporation intensity, leaf temperature, and heat flux consistency, enhancing the thermal efficiency of irrigation and spraying systems.
This study systematically analyzed the spray behavior of hollow-cone atomizing micro-sprinklers under six representative operating conditions (combinations of pressure and mounting height). A thermo-kinetic coupling model was developed to estimate kinetic energy flux and equivalent heat source terms, with the aim of exploring their thermo-fluidic applications in precision spraying and water-saving irrigation systems. The key conclusions are summarized as follows:
(1) Trade-off Between Spray Intensity and Uniformity: A clear trade-off was observed between spray intensity and distribution uniformity. Under low-pressure and close-range conditions (0.2 MPa-0.4 m), the sprinklers delivered the highest kinetic energy flux, with an E value reaching 150.56 J/m²•h and a corresponding heat flux of 0.042 W/m², indicating strong impact performance. However, water distribution was concentrated in peripheral regions, resulting in lower CU and DU values and poor spatial uniformity. In contrast, high-pressure and long-range settings (0.6 MPa-1.0 m) yielded lower overall intensity but more uniform droplet motion and smoother symmetrical water profiles, significantly improving CU and DU.
(2) Influence of Droplet Size Structure on Reflectivity and Visibility: Radar reflectivity (Z) was closely related to droplet size and concentration. A “large-and-sparse” droplet distribution resulted in higher Z values and reduced rainfall visibility, whereas a “fine-and-dense” droplet structure was associated with lower reflectivity and improved optical clarity. The average particle count and the spray process stability coefficient (CV) collectively revealed the dynamic evolution of atomization structures under different spraying conditions.
(3) Development and Validation of the Z-E Power-Law Model: A power-law model was developed to describe the relationship between radar reflectivity (Z) and kinetic energy flux (E). The model achieved a coefficient of determination (R²) of 0.989 and a root mean square error (RMSE) of 1.18 J/m²•h, demonstrating high consistency in both physical interpretation and statistical performance. The model is suitable for rapid estimation of spray kinetic energy and enables real-time feedback control in intelligent systems.
(4) Thermo-Kinetic Coupling Enhances Thermodynamic Interpretation: During spray-surface interactions, part of the droplet’s kinetic energy is transformed into localized heat, forming micro-scale heat sources. Heat flux estimation and simulation analyses indicated that different spray parameters could induce local temperature field disturbances and boundary heat migration. This provides a theoretical basis for integrated modeling of spray, evaporation, and cooling processes.
(5) Integration and Application Potential in Smart Irrigation Systems: When combined with radar or laser-based droplet monitoring systems, the Z-E model can be embedded into kinetic-energy-feedback-based spray control strategies, allowing for energy density regulation and spatial distribution optimization under varying conditions. This method provides a data foundation and control pathway for precision, efficient water-fertilizer-pesticide integration, and is particularly suitable for modular integration and smart upgrading of center-pivot and linear-move irrigation systems.
In summary, the proposed thermo-kinetic coupling model enhances the physical understanding and predictive capability of spray performance while offering theoretical support for energy optimization and environmental response management in agricultural thermal systems. Future work may extend this approach to analyze overlapping spray effects among multiple nozzles, energy dissipation patterns beneath crop canopies, and Multiphysics coupling simulations over complex terrain.
This research was supported by the Central-level Basic Scientific Research Business Fee Special Project for Research Institutes (IFI2024-07, IFI2023-07, FIRI2022-20), the Henan Provincial Natural Science Foundation (Grant No. 252300420510), the Science and Technology Key Project of Henan Province (Grant No. 242102110339), and the Science and Technology Innovation Program of the Chinese Academy of Agricultural Sciences (CAAS).
[1] Cao, H., Fan, Y., Ma, C., Li, P., Zhan, W., Cao, Y., Duan, F. (2024). The simulation and analysis of the spraying status of large sprinkler machines loaded with atomizing micro-sprinklers. Alexandria Engineering Journal, 106: 467-473. https://doi.org/10.1016/j.aej.2024.08.066
[2] Cao, H., Fan, Y., Ma, C., Li, P., Zhan, W., Cao, Y., Duan, F. (2025). Simulation and analysis of spray distribution and droplet size of large sprinkler machines loaded with atomizing micro-sprinklers. Facta Universitatis, Series: Mechanical Engineering. https://doi.org/10.22190/FUME241203017C
[3] Salcedo, R., Zhu, H., Jeon, H., Ozkan, E., et al. (2022). Droplet size distributions from hollow-cone nozzles coupled with PWM valves. Journal of the ASABE, 65(4): 695-706. https://doi.org/10.13031/ja.15064
[4] Rodriguez-Rodriguez, N., Miramontes, O. (2022). Shannon Entropy: An econophysical approach to cryptocurrency portfolios. Entropy, 24(11): 1583. https://doi.org/10.3390/e24111583
[5] Vankeswaram, S.K., Kulkarni, V., Deivandren, S. (2025). Spatial evolution of droplet size and velocity characteristics in a swirl spray. International Journal of Multiphase Flow, 184: 105076. https://doi.org/10.1016/j.ijmultiphaseflow.2024.105076
[6] Wang, J., Zhou, Z., Li, Z., Du, S. (2022). A novel fault detection scheme based on mutual k-nearest neighbor method: Application on the industrial processes with outliers. Processes, 10(3): 497. https://doi.org/10.3390/pr10030497
[7] Steiner, M., Smith, J.A. (2000). Reflectivity, rain rate, and kinetic energy flux relationships based on raindrop spectra. Journal of Applied Meteorology, 39(11): 1923-1940. https://doi.org/10.1175/1520-0450(2000)039<1923:RRRAKE>2.0.CO;2
[8] Yang, E., Kang, D.H., Yun, T.S. (2021). Ternary segmentation and estimation of permeability for porous rocks based on 3D X-ray computed tomographic images by hidden Markov random field and Brinkman-force lattice Boltzmann model. Journal of Hydrology, 599: 126377. https://doi.org/10.1016/j.jhydrol.2021.126377
[9] Meshesha, D.T., Tsunekawa, A., Haregeweyen, N. (2018). Application of an optical disdrometer to characterize simulated rainfall and measure drop-size distribution. Hydrological Sciences Journal, 63(10): 1574-1587. https://doi.org/10.1080/02626667.2018.1521522
[10] Campos, J., Zhu, H., Salcedo, R., Jeon, H., Ozkan, E., Gil, E. (2025). Droplet size distributions from PWM‑controlled hollow-cone nozzles operated at high modulation frequencies and pressures. Journal of the ASABE, 68(1): 51-60. https://doi.org/10.13031/ja.16094
[11] Vankeswaram, S.K., Deivandren, S. (2021). Size and velocity characteristics of spray droplets in near‑region of liquid film breakup in a hollow cone swirl atomizer. Experimental Thermal and Fluid Science, 130: 056103. https://doi.org/10.1016/j.expthermflusci.2021.110505
[12] Swami, V.V., Buist, K.A., Baltussen, M.W., de Graaf, L.A.H.J., Kuipers, J.A.M. (2024). Droplet size, spray structure and droplet velocity mapping in hollow cone sprays using SLIPI-based techniques. Chemical Engineering Science, 300: 120635. https://doi.org/10.1016/j.ces.2024.120635
[13] Jackiw, I.M., Ashgriz, N. (2023). Aerodynamic droplet atomization model (ADAM). Journal of Fluid Mechanics, 958: A2. https://doi.org/10.1017/jfm.2022.1046
[14] Assouline, S. (2020). On the relationships between radar reflectivity and rainfall rate and kinetic energy resulting from a Weibull drop size distribution. Water Resources Research, 56(10): e2020WR028156. https://doi.org/10.1029/2020WR028156
[15] Dai, Q., Zhu, J., Lv, G., Kalin, L., Yao, Y., Zhang, J., Han, D. (2023). Radar remote sensing reveals potential underestimation of rainfall erosivity at the global scale. Science Advances, 9(32): eadg5551. https://doi.org/10.1126/sciadv.adg5551
[16] Van, L.N., Le, X.H., Nguyen, G.V., Yeon, M., Do, M.T.T., Lee, G. (2022). Evaluation of numerous kinetic energy-rainfall intensity equations using disdrometer data. Remote Sensing, 15(1): 156. https://doi.org/10.3390/rs15010156
[17] Zeng, Y., Yang, L., Tong, Z., Jiang, Y., Abulikemu, A., Lu, X., Li, X. (2024). Seasonal variations in the rainfall kinetic energy estimation and the dual-polarization radar quantitative precipitation estimation under different rainfall types in the Tianshan Mountains, China. Remote Sensing, 16(20): 3859. https://doi.org/10.3390/rs16203859
[18] Pörtge, V., Kölling, T., Weber, A., Volkmer, L., Emde, C., Zinner, T., Forster, L., Mayer, B. (2023). High-spatial-resolution retrieval of cloud droplet size distribution from polarized observations of the cloudbow. Atmospheric Measurement Techniques, 16(3): 645-667. https://doi.org/10.5194/amt-16-645-2023
[19] Chen, S., Ashgriz, N. (2022). Droplet size distribution in swirl nozzles. International Journal of Multiphase Flow, 156: 104219. https://doi.org/10.1016/j.ijmultiphaseflow.2022.104219
[20] Höhne, S., Taboada, M.L., Schröder, J., Gomez, C., Karbstein, H.P., Gaukel, V. (2024). Experimental study on atomization characteristics of swirl nozzle for spray drying of emulsions. Fluids, 9(3): 70. https://doi.org/10.3390/fluids9030070
[21] Mohammed, S.K., Hasan, A. H., Dimitrakis, G., Azzopardi, B.J. (2022). Small bubbles formation and contribution to the overall gas holdup in large diameter columns of very high viscosity oil. International Journal of Multiphase Flow, 152: 104104. https://doi.org/10.1016/j.ijmultiphaseflow.2022.104104
[22] Teschl, R., Randeu, W., Teschl, F. (2007). Improving weather radar estimates of rainfall using feed‑forward neural networks. Neural Networks, 20(4): 519-527. https://doi.org/10.1016/j.neunet.2007.04.005
[23] Chen, C., Hussain, Z., Liu, J., Zaman, M., Akhlaq, M. (2024). Innovative technologies in sprinkler irrigation: An overview. Agrociencia. https://doi.org/10.47163/agrociencia.v58i7.3191
[24] Farahani, H.J., Shaner, D.L., Buchleiter, G.W., Bartlett, G.A. (2006). Evaluation of a low volume agro-chemical application system for center pivot irrigation. Applied Engineering in Agriculture, 22(4): 517-528. https://doi.org/10.13031/2013.21220
[25] Omary, M., Sumner, H. (2001). Modeling water distribution for irrigation machine with small spray nozzles. Journal of Irrigation and Drainage Engineering, 127(3): 156-160. https://doi.org/10.1061/(ASCE)0733-9437(2001)127:3(156)