Khoirul Basyar![]() | Zainal Arifin*
| Zainal Arifin*![]() | Dominicus Danardono Dwi Prija Tjahjana
| Dominicus Danardono Dwi Prija Tjahjana![]() | Singgih Dwi Prasetyo
| Singgih Dwi Prasetyo![]()
© 2024 The authors. This article is published by IIETA and is licensed under the CC BY 4.0 license (http://creativecommons.org/licenses/by/4.0/).
OPEN ACCESS
The large-scale adoption of renewable energy from solar sources has gained significant traction. Solar energy conversion using photovoltaic devices is an alternative to meet the electricity demand. However, the excessive heat generated by solar radiation presents a challenge in maximizing the power output of photovoltaic panels. To tackle this issue, a passive cooling system employing aluminum fins was installed on the rear side of the photovoltaic panels. This study focused on two key configurations: the geometry and arrangement of the fins. The study was conducted experimentally indoors using a halogen lamp solar simulator with a uniform intensity for each variation of 1000 W/m2. A total of forty-one fins were installed beneath the panel in various configurations. This study used a 50 Wp photovoltaic panel with a polycrystalline cell structure. The results indicated that rectangular fins lowered the temperature by 36.85℃ in the perforated β 45° configuration. Furthermore, this setup achieved a 13.06% increase in electrical output efficiency. The efficiency value increased by 3.80% compared to the uncooled photovoltaic. Statistical analysis conducted through two-way ANOVA without replication revealed a significant difference between the two configurations. Notably, the fins' geometric shape significantly influenced temperature reduction and electrical efficiency more than the arrangement model.
photovoltaic, cooling, fins configuration, efficiency
Renewable energy has been introduced and applied for a long time. Still, its development has recently become highly significant as an alternative to fossil fuels and other high-risk energy sources. The potential of renewable energy is enormous, as it theoretically can generate more energy than the global demand for power [1]. Renewable energy sources, such as wind, geothermal, biomass, and solar, are standard daily. These sources can be utilized on a large scale (for power generation) or at the household level. In residential applications, photovoltaic systems can harness renewable energy. With solar energy available year-round, there is a clear advantage to installing photovoltaic systems in office buildings or homes [2]. The increasing electricity consumption in residential areas can be mitigated by installing photovoltaic systems, reducing dependency on conventional energy sources like fossil fuels. The rising use of fossil fuels contributes to severe environmental degradation [3].
Today's commonly installed photovoltaic systems are based on older silicon-based technology, which tends to be more economically affordable. However, silicon-based photovoltaics are highly susceptible to high temperatures, leading to reduced performance, particularly in terms of electrical efficiency [4]. The efficiency of silicon-based devices is lower compared to the most recent photovoltaic technologies, such as third-generation photovoltaics, including Quantum Dot Solar Cells (QDSCs), which have a theoretical efficiency of up to 44% [5]. Typically, photovoltaic (PV) efficiency is around 12% due to suboptimal energy conversion caused by decreased panel performance from excessive heat. The silicon material used as the semiconductor in photovoltaic cells is susceptible to high temperatures, which can damage the material's structure and hinder electron movement within the semiconductor [6]. Based on photovoltaic theory and general specifications, the ideal temperature for optimal operation is 25℃, with high light intensity required to achieve maximum power output [7]. When the temperature exceeds this ideal limit, PV power output and efficiency may decrease, and over time, this can lead to degradation in lifespan and a decline in the overall performance of the photovoltaic system [8, 9]. To improve efficiency performance, it is necessary to lower the operating temperature of the photovoltaic system using appropriate cooling devices and systems [10].
In recent decades, innovations in photovoltaic cooling techniques have been continuously developed. Cooling is achieved by utilizing fluids directed toward the photovoltaic system, either directly, such as water spray [11] and floating methods [12], or indirectly through conductive plates [13] or thermal collectors [14]. Additionally, photovoltaic cooling can be categorized into natural convection, where air flows around the photovoltaic surface, and forced cooling, which involves installing specific devices in the photovoltaic area. This can be applied to the backside or the front surface of the photovoltaic panels. Cooling without the addition of complex devices can be achieved by installing conductive fins to enhance heat transfer [15]. The advantages of using fins in the cooling process include their cost-effectiveness and ease of installation [16-18].
Passive cooling has been proven to deliver performance comparable to active cooling methods [19, 20]. Some examples of passive cooling include the use of Phase Change Materials (PCM) [21], evaporative cooling [22], and fin heat sinks [23]. Research using fins has demonstrated a temperature reduction of 2%, according to the study by Grubišić-Čabo et al. [24]. The selection of conductive materials for the heat sink is also important. Arifin et al. [25] compare the performance of heat sinks with variations in the number of fins and the type of conductive material used for the base plate and fins. The study found that the highest number of fins, 15, combined with copper as the material for both the base plate and fins, resulted in the best temperature reduction and efficiency increase, with values of 10.2℃ and 2.74%, respectively. Recent research using a Multi-Level Fins Heat Sink (MLFHS) by Ahmad et al. [26] showed a temperature decrease of 8.45℃ compared to systems without MLFHS, along with a 10.75% increase in efficiency and a 14.8% improvement in temperature uniformity. Uniform temperature distribution helps reduce the risk of mechanical damage to panels due to hotspots. Using ANSYS Fluent software, Abdallah et al. [27] examined several fin parameters, including baseplate thickness, fin spacing, height, and thickness. The results indicated optimal modifications at 3mm, 110mm, 60mm, and 4mm, respectively, with corresponding temperature reductions of 1.6%, 1.3%, 5.9%, and 6.2%. The cooling was performed using air, demonstrating the significant implications of this system for developing more efficient and effective cooling methods. Research on fin shapes to enhance energy performance, comparing curled fins and rectangular fins by Chan-Dzib et al. [28], showed that curled fins maintained better thermal stability, reduced photovoltaic panel temperature by 8℃, and increased energy output by 3-4% compared to panels without fins. Rectangular fins, on the other hand, improved energy output by 2-2.9%. Khelifa et al. [29] demonstrated an innovative cooling design for photovoltaic systems, who developed skeleton-shaped fins installed on the underside of panels intended to achieve total airflow from all sides of the panel. The performance improvements from this system included temperature reduction, increases in electrical and thermal energy output, and overall energy efficiency improvements, with respective values of 4℃, 5.42%, 16.43%, and 9.23%. Based on the literature, further research on photovoltaic cooling using fins with various parameter optimizations is needed.
Given the current demands, research on using fins as a cooling system for photovoltaic systems is essential. Further investigation and exploration are needed to maximize the energy efficiency generated by photovoltaic panels. Generally, fin-related research focuses on the type of fin material, fin dimensions, and their arrangement. A novel and structured fin geometry and arrangement model are proposed in this study. Therefore, this study aims to identify the geometry and arrangement model of fins in reducing the operating temperature of photovoltaic systems and improving their performance efficiency. Optimization of fin geometry and arrangement is expected to improve heat transfer while supporting optimal heat distribution, thereby improving photovoltaic performance. This study experimentally uses a halogen lamp-based solar simulator to simulate solar energy, which allows consistent and measurable conditions. To ensure the significance of the relationship between the studied variables, statistical tests are used as justification, ensuring the data's validity and reliability. This study is expected to significantly contribute to optimizing the performance of photovoltaic systems by improving their efficiency.
This paper is organized into several sections. The first section introduces the study and outlines its objectives. The second section details the research methodology, including the equipment and analysis methods. Section three presents the experimental results for each variation and a discussion based on ANOVA analysis. Finally, the paper concludes with a summary of the findings and recommendations for future research.
2.1 Experimental set-up
This study investigates different fin geometries and arrangement models to achieve optimal cooling performance for photovoltaic systems. The geometric shapes examined include triangular, trapezoidal, and rectangular fins. Each fin shape has a height of 60 mm, which was selected based on the optimal performance range of 50-100 mm, as indicated by the research conducted by Nieztic et al. [30]. The fins are made of aluminum due to their lightweight properties, high thermal conductivity (237 W/mK), and cost-effectiveness. Figure 1 shows the fins used in this study for each geometric shape. For each configuration, 41 fins were arranged on the underside of the photovoltaic panel. The arrangement models are categorized into three tilt angles: β 0°, β 45°, and perforated β 45°. The details of the geometric shapes and arrangement models for fins in this research are presented in Table 1.
Figure 1. The fin geometries for each shape are as follows: a) Triangular with α=30°, b) Rectangular with α=60°, and c) Trapezoidal with α=90°
Table 1. Fin geometry size and arrangement model
|
Type |
α (°) |
β (°) |
h (mm) |
a (mm) |
Type |
|
Triangular |
30 |
0/45 |
60 |
80 |
perforated/nonperforated |
|
Trapezoidal |
60 |
0/45 |
60 |
80 |
perforated / non perforated |
|
Rectangular |
90 |
0/45 |
60 |
80 |
perforated/nonperforated |
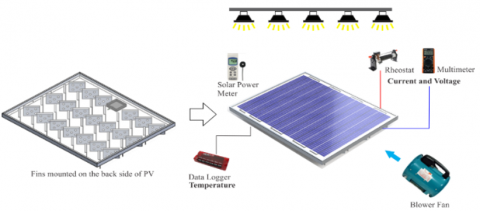
The research was conducted indoors at the Solar Laboratory, Faculty of Engineering, Universitas Sebelas Maret, Indonesia. In this indoor testing environment, the solar energy source was replaced by halogen lamps, which are affordable and accessible to obtain. A solar simulator consisting of 20 halogen lamps with a total power output of 500 W was installed to provide optimal solar energy for the photovoltaic system, which has a capacity of 50Wp and an effective area efficiency of 16% [31]. The Yingli Solar 50 Wp photovoltaic panel was used in this study. The photovoltaic panel, with a module efficiency specification of 14%, was parallel to the 20 halogen lamps positioned 75 cm above it. To simulate airflow over the photovoltaic panel, nine Yamamax blowers were arranged in a 3×3 configuration to ensure uniform airflow for each test at a velocity of 4.5 m/s. Data on the panel's operating temperature and performance data, including the voltage and current generated by the photovoltaic panel, were collected to determine its efficiency.
Temperature measurements were conducted using K-type thermocouple sensors, and the data were recorded using a Labjack U6 data logger. Nine temperature sensors were installed beneath the panel to monitor the temperature distribution when airflow was engineered by adding fins to enhance heat transfer as a cooling method. Airflow was measured using a Krisbow Kw06-562 Flexible Thermo Anemometer, and the radiation intensity from the solar simulator was measured using a Lutron SPM-1116SD solar meter. The output power, in terms of voltage and current from the photovoltaic panel, was measured using a Heles UX838-TR multimeter, with current measurements taken by applying a load through a rheostat. The detailed depiction of the experimental setup, including the placement of tools and materials, is shown in Figure 2. The specifications and accuracy of the measurement instruments used are presented in Table 2, and the specifications of the Yingli 50 Wp polycrystalline photovoltaic panel used in this study are shown in Table 3.
Table 2. Specification data and accuracy of measuring instruments
|
Instruments |
Model |
Specifications |
|
Multimeter |
Heles UX838-TR multimeter |
Accuracy: ±3% for DC current and ±0.5% for DC voltage |
|
Thermocouples |
K-Type |
Accuracy: ± 2.2℃ Range: –270 to 1260℃ |
|
Solar meter |
Lutron SPM-1116SD Solar power meter |
Accuracy: ±5% Range: 0-2000W/m2 |
|
Anemometer |
Krisbow Kw06-562 Flexible |
Accuracy: ±3% ±0.2m/s Range: 0.6-30.0m/s |
The testing was conducted consistently for each cooling variation. The procedure began by activating the solar simulator at an intensity of 1000 W/m² and waiting for 15 minutes to achieve steady-state conditions. Subsequently, the blower was turned on to produce a wind speed of 4.5 m/s, followed by a waiting period of approximately 5 minutes to ensure uniform wind speed. Data collection included temperature, voltage, and current measurements, which were then used to determine the maximum power output and photovoltaic efficiency.
In this study, 41 fins were installed in various configurations on the underside of the photovoltaic panel. The layout of the fin arrangements is presented in Figure 3.
Table 3. Properties of Photovoltaic used in this research
|
Specification |
Information |
|
Module Name |
YL050P-17b 1/3 |
|
Power Output (Pmax) |
50W |
|
Power Output Tolerances (ΔPmax) |
±5W |
|
Module Efficiency (ηm) |
14% |
|
Voltage at Pmax (Vpm) |
18.5V |
|
Current at Pmax (Ipm) |
2.71A |
|
Open Circuit Voltage (Voc) |
22.9V |
|
Short Circuit Current (Isc) |
2.87A |
|
Weight |
4.23kg |
|
Dimension (mm) |
660×540×30 |
Figure 2. Experimental setup
(a)
(b)
Figure 3. a) The position of the photovoltaic panel in the study for the rectangular perforated fins variable; b) The dimensions and layout of the fins in the study
2.2 Work analysis parameters
This study compares the operating temperature and performance of the photovoltaic panel for each variation in fin installation configurations. Temperature data for each test were collected at nine points to observe the distribution; however, the average was calculated to justify the temperature for each variation. The performance in terms of power output from the photovoltaic cell is typically presented as a relationship between voltage and current in the form of an I-V graph. A rheostat was used to create variations in resistance to obtain this graph. The performance parameters collected for the photovoltaic system include open circuit voltage (Voc), short-circuit current (Isc), fill factor (FF), maximum power point (Pmpp), and efficiency (η). Open circuit voltage (Voc) represents the maximum voltage obtained when no current flows through the circuit. Short circuit current (Isc) is the maximum current obtained when there is no resistance in the circuit. The fill factor (FF) is the ratio of the maximum power point (Pmpp)-the peak of the I-V graph-to the product of Voc and Isc. The relationship among all these parameters is presented in Eq. (1) below.
$F F=\frac{P_{M P P}}{I_{S C} \times V_{O C}}=\frac{I_{M P P} \times V_{M P P}}{I_{S C} \times V_{O C}}$ (1)
Fins are commonly used in passive cooling methods to dissipate heat through the process of heat transfer facilitated by the flowing fluid. The engineering of the fin geometry or arrangement influences its efficiency by estimating the ratio between the actual heat transfer rate and the ideal heat transfer rate. For fins with a rectangular shape, the calculations for efficiency and surface area are defined as follows:
$m=\sqrt{2 h / k t}$ (2)
$L_c=L+t / 2$ (3)
$A_{f i n}=2 w L_c$ (4)
$\eta_{f i n}=\frac{\tanh \, m L_C}{m L_C}$ (5)
The efficiency of the photovoltaic system is calculated by comparing the maximum power point (Pmpp) value with the solar radiation power received by the photovoltaic panel (Plight). The maximum power point (Pmpp) can be determined by multiplying the open circuit voltage (Voc), short-circuit current (Isc), and fill factor (FF), then dividing by the product of the measured solar radiation intensity (Irad) and the area of the photovoltaic panel (A). The efficiency of the panel can be calculated using Eq. (6):
$\eta=\frac{P_{M P P}}{I_{\text {light }}}=\frac{P_{M P P}}{I_{\text {rad }} \times A}=\frac{I_{S C} \times V_{O C} \times F F}{I_{\text {rad }} \times A}$ (6)
2.3 Research stages
In this study, as shown in Figure 4 statistical analysis is used to determine whether the study results are significant and whether there is an influence between the 2 dependent variables on the independent variable. The statistical analysis used in this study is two-way ANOVA without replication. The selection of ANOVA is based on the fact that the data presented is a single data of the average value in 2 groups of dependent variable data, namely the geometric shape of the fins and the fin arrangement model. ANOVA can provide information about the significance level of the differences between the data groups being tested. In the initial preparation, it is necessary to determine the initial hypothesis and the significance value to be determined. In this study, a value of 0.05 is used to determine the significance of data differences.
This study's independent variables are temperature reduction and electrical efficiency improvement. Therefore, the hypothesis determination can be described as the effects of fin geometry and the arrangement model on temperature reduction and electrical efficiency improvement. The null and alternative hypotheses (H₀ and H₁) for each variable in this study can be defined as follows:
2.3.1 Independent variable: Temperature reduction
H₀: There is no significant difference in the fin geometry's effect on photovoltaic temperature reduction.
H₁: There is a significant difference in the fin geometry's effect on photovoltaic temperature reduction.
H₀: There is no significant difference in the fin arrangement model's effect on photovoltaic temperature reduction.
H₁: There is a significant difference in the fin arrangement model's effect on photovoltaic temperature reduction.
2.3.2 Independent variable: Electrical efficiency improvement
H₀: There is no significant difference in the fin geometry's effect on photovoltaic electrical efficiency enhancement.
H₁: There is a significant difference in the fin geometry's effect on photovoltaic electrical efficiency enhancement.
H₀: There is no significant difference in the fin arrangement model's effect on photovoltaic electrical efficiency enhancement.
H₁: There is a significant difference in the fin arrangement model's effect on photovoltaic electrical efficiency enhancement.
Figure 4. Research flowchart
3.1 The effect of adding fins as a cooling system on photovoltaic performance
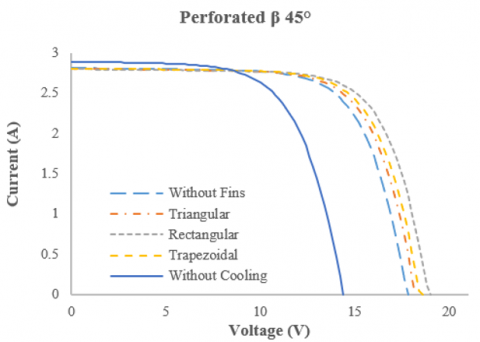
This study seeks to identify the optimal configuration for cooling photovoltaic systems using fin heat sinks. The fin heat sink modifications involve comparing fin shapes, including triangular, trapezoidal, and rectangular designs. Each fin shape is tested with different arrangements, specifically angles of β 0°, β 45°, and perforated β 45°. The experimental research is conducted indoors using halogen lamps as a solar simulator, providing a radiation intensity of 1000 W/m² and a win0d speed of 4.5 m/s passing over the photovoltaic panels for each test variation. The results of the study, including the I-V graphs for each geometric shape under various arrangement models, are shown in Figure 5.
(a)
(b)
(c)
Figure 5. The I-V graphs for each geometric shape under the different arrangement models are as follows: a) β 0°, b) β 45°, and c) Perforated β 45°
Initial experiments were conducted to assess the performance of photovoltaic systems without any cooling. An intensity of 1000 W/m² presents a high-temperature potential for photovoltaic modules. The performance results of the photovoltaic panels as shown in Table 4 indicate that the irradiation from 20 halogen lamps, each rated at 500 W and uniformly adjusted to achieve an intensity of 1000 W/m², leads to a temperature of 65.30℃ in the photovoltaic module. At high temperatures, efficiency declines due to a reduction in voltage (V) associated with each increase in temperature. However, the decrease in voltage is not accompanied by a corresponding increase in current, which is considered insignificant. Thus, decreasing voltage has a more significant impact on the efficiency of photovoltaic performance [32]. The efficiency of the photovoltaic panel without any cooling reaches only 9.26%, which is 3.2% lower than the efficiency of the photovoltaic panel that receives cooling via airflow without fins attached to its rear. The efficiency obtained is also dependent on the output power generated. The photovoltaic panel exposed to solar radiation through the solar simulator without cooling produces an output power of only 26.70 watts, while the panel subjected to cooling via airflow yields an output power of 34.79 watts.
Table 4. The performance results of the photovoltaic panels for each testing variable
|
Variation |
Temp (℃) |
Voc (Volt) |
Isc (A) |
Pmpp (Watt) |
Efficiency (%) |
|
Without cooling (no wind) |
65.30 |
14.4 |
2.87 |
26.70 |
9.26 |
|
Without fins (wind only) |
43.96 |
17.8 |
2.80 |
34.79 |
12.06 |
|
Triangular β 0° |
41.85 |
18.2 |
2.80 |
35.60 |
12.34 |
|
Triangular β 45° |
41.80 |
18.2 |
2.80 |
35.62 |
12.35 |
|
Triangular perforated β 45° |
41.17 |
18.2 |
2.80 |
35.86 |
12.43 |
|
Trapezoidal β 0° |
40.71 |
18.4 |
2.80 |
36.16 |
12.54 |
|
Trapezoidal β 45° |
40.05 |
18.4 |
2.80 |
36.42 |
12.63 |
|
Trapezoidal perforated β 45° |
39.67 |
18.6 |
2.80 |
36.56 |
12.68 |
|
Rectangular β 0° |
37.92 |
18.8 |
2.78 |
37.10 |
12.87 |
|
Rectangular β 45° |
37.71 |
18.8 |
2.78 |
37.19 |
12.89 |
|
Rectangular perforated β 45° |
36.85 |
19 |
2.79 |
37.64 |
13.06 |
3.2 The effect of installing fins on the temperature reduction of photovoltaic panels
The test results indicate a variation in temperature values for each experiment. The lowest temperature was recorded for the rectangular geometric shape. The order of temperature values from lowest to highest is rectangular, trapezoidal, and triangular. The rectangular fins have a frontal angle with the airflow of α=90°, more significant than the triangular and trapezoidal shapes. This angle of attack affects the airflow resistance of the heat transfer occurring on the fins. In the case of rectangular and trapezoidal fins, the rectangular fins exhibit a more significant temperature reduction, resulting in higher heat transfer values than trapezoidal fins. According to a study by Zhou and Ye [33] A larger inclination angle provides a greater projected frontal area with airflow, resulting in lower airflow resistance. In this context, the triangular fins have a frontal angle of α=30°, trapezoidal fins have α=60°, and rectangular fins have α=90°.
Figure 6 illustrates the average temperature distribution of the photovoltaic panels for each test. The experiments examined the relationship between geometric shape variables and arrangement models for each level. Testing under radiation of 1000 W/m² shows that fins with a rectangular geometric shape achieve the lowest temperature reduction at each level of the fin arrangement. For the triangular geometric configuration, with each arrangement model including angles of β=0°, β=45°, and perforated β=45°, the respective temperature values are 41.85℃, 41.80℃, and 41.17℃. Meanwhile, for the trapezoidal geometric shape under the same conditions, the temperature values for each arrangement model with angles of β=0°, β=45°, and perforated β=45° are 40.72℃, 40.05℃, and 39.68℃, respectively. The best temperature reduction for the variations in geometric shapes is observed in the rectangular shape, with temperatures for each arrangement model at angles of β=0°, β=45°, and perforated β=45° recorded as 37.92℃, 37.71℃, and 36.85℃, respectively.
The difference in temperature values is significantly evident when comparing photovoltaic panels without any cooling treatment to those with cooling treatment and fins arranged on the back of the panel. The operating temperature of the photovoltaic panel without any cooling measures reaches 65.30℃. When air is directed at the panel at a speed of 4.5 m/s without installing fins, the temperature can be reduced to 43.96℃. By implementing cooling measures by installing rectangular fins arranged at a perforated angle of β 45°, the temperature can be further lowered to 36.85℃. With the addition of fins configured in specific geometric shapes and arrangements, the operating temperature of the photovoltaic panel can be decreased by 7.11℃.
Figure 6. Temperature of photovoltaic panels for each variation in geometric shape and arrangement model
3.3 The effect of installing fins on the increasing the efficiency of photovoltaic panels
There are notable differences in electrical efficiency for each test conducted under varying configurations of fin geometries and their arrangements. The lowest electrical efficiency was observed with triangular fins, while the highest efficiency was recorded with rectangular fins. Figure 7 illustrates the average electrical efficiency performance of the photovoltaic panels for each test. The experiments investigated the relationship between the geometric shape of the fins and their respective arrangement models. Under radiation levels of 1000 W/m², the rectangular fins demonstrated the highest electrical efficiency at every arrangement level. The triangular fin configuration, with arrangements at angles β 0°, β 45°, and perforated β 45°, yielded efficiencies of 12.34%, 12.35%, and 12.43%, respectively. In comparison, the trapezoidal fins under similar treatment achieved electrical efficiencies of 12.54%, 12.63%, and 12.68% for each arrangement angle of β 0°, β 45°, and perforated β 45°. The best improvement in electrical efficiency for the geometric variations was observed with the rectangular fins, which achieved efficiencies of 12.87%, 12.89%, and 13.06% for the arrangement models of β 0°, β 45°, and perforated β 45°, respectively.
Significant differences in electrical efficiency are observed when comparing photovoltaic panels that receive no cooling treatment to those equipped with cooling fins on the rear side of the panels. Under conditions without cooling, the photovoltaic panels achieve a very low electrical efficiency of only 9.26%. However, when air is circulated at a speed of 4.5 m/s without installing fins, the electrical efficiency improves to 12.06%. Implementing cooling fins in a rectangular geometry, arranged at a perforated angle of β 45°, further enhances the electrical efficiency to 13.06%. This addition of fins, utilizing various geometric configurations and arrangement models, leads to an overall increase in photovoltaic electrical efficiency of 1%.
Figure 7. Electrical efficiency of photovoltaic panels for each geometric shape and arrangement model variation
3.4 Statistical ANOVA analysis for each variation on the operating temperature of photovoltaic panels
Based on the operational temperature data for each photovoltaic test using a cooling system with fin configurations of geometric shapes and arrangement models, the results are summarized in Table 5. The grouped data are utilized to assess the impact of each variation and the relationships between factors such as geometric shape and arrangement models on the improvement of photovoltaic performance through the reduction of operational temperature. Statistical analysis was conducted using a two-way ANOVA without replication, with a significance level of 0.05. Table 6 presents the results of the ANOVA calculations, revealing a p-value of 2.825E-05 for the geometric shape variation, which is significantly lower than the baseline significance level. It can be concluded that for the dependent variable of geometric shape, H₀ is rejected, and H₁ is accepted. Similarly, the arrangement model of the fins also yielded a p-value of 0.008727, below the significance threshold. It can be concluded that for the dependent variable of the arrangement model of fins, H₀ is rejected, and H₁ is accepted. This indicates that both variations significantly impact the reduction of the operational temperature of the photovoltaic system. Furthermore, the p-values suggest that geometric shape substantially affects photovoltaic performance more than the fins' arrangement model.
Table 5. The operating temperature of the photovoltaic panels for each geometry and configuration of the fins
|
SUMMARY |
Count |
Sum |
Average |
Variance |
|
Triangular Fins |
3 |
124.8251 |
41.60838 |
0.144084 |
|
Rectangular Fins |
3 |
112.4841 |
37.49469 |
0.323986 |
|
Trapezoidal Fins |
3 |
120.445 |
40.14832 |
0.278269 |
|
β 0° |
3 |
120.4935 |
40.16451 |
4.094373 |
|
β 45° |
3 |
119.5645 |
39.85483 |
4.20393 |
|
Perforated β 45° |
3 |
117.6962 |
39.23206 |
4.819376 |
Table 6. The ANOVA results for the photovoltaic panels regarding the operating temperature parameters for each geometry and configuration of the fins
|
Source of Variation |
SS |
df |
MS |
F |
P-Value |
F Crit |
|
Geometry |
26.095 |
2 |
13.047 |
374.27 |
2.8E-05 |
6.944 |
|
Arrangement |
1.3532 |
2 |
0.6766 |
19.408 |
0.00872 |
6.944 |
|
Error |
0.1394 |
4 |
0.0348 |
|
|
|
|
Total |
27.588 |
8 |
|
|
|
|
3.5 Statistical ANOVA analysis for each variation on the electrical efficiency of photovoltaic panels
The discussion on the interaction between the variations in fin geometric shapes and their arrangement models is elucidated using the two-way ANOVA without replication statistical method. The grouping of data for each variation is presented in Table 7. The statistical data analysis results, shown in Table 8 with a significance level of 0.05, indicate that the geometric shape variation has a p-value of 0.000107, which is lower than 0.05. It showed that for the dependent variable of geometric shape for enhancement of photovoltaic electrical efficiency, H₀ is rejected, and H₁ is accepted. Furthermore, the fin arrangement model variation has a p-value of 0.0203. So, it can be concluded if H₀ is rejected and H₁ is accepted for the dependent variable of arrangement models for enhancement of photovoltaic electrical efficiency, these results suggest a significant difference in the relationship between the variations in geometric shapes and the arrangement models of fins concerning the electrical efficiency of the photovoltaic system
However, since the data in this study represent averages of single observations, the statistical analysis cannot reveal interactions between the dependent variables or demonstrate more significant differences in the data. Future research would benefit from including replicated data, allowing for repeated measurements of each factor combination. This would enhance the variability estimation and strengthen the analysis of interactions between the independent variables.
Table 7. The electrical efficiency of the photovoltaic panels for each geometry and configuration of the fins
|
SUMMARY |
Count |
Sum |
Average |
Variance |
|
Triangular Fins |
3 |
0.371446 |
0.123815 |
2.43E-07 |
|
Rectangular Fins |
3 |
0.388308 |
0.129436 |
1.02E-06 |
|
Trapezoidal Fins |
3 |
0.378574 |
0.126191 |
4.8E-07 |
|
β 0° |
3 |
0.377657 |
0.125886 |
6.96E-06 |
|
β 45° |
3 |
0.378887 |
0.126296 |
7.38E-06 |
|
Perforated β 45° |
3 |
0.381784 |
0.127261 |
9.79E-06 |
Table 8. The ANOVA results for the photovoltaic panels regarding the electrical efficiency parameters for each geometry and configuration of the fins
|
Source of Variation |
SS |
df |
MS |
F |
P-Value |
F Crit |
|
Geometry |
4.78E-05 |
2 |
2.39E-05 |
191.74 |
0.000107 |
6.944272 |
|
Arrangement |
2.99E-06 |
2 |
1.5E-06 |
12.01149 |
0.020375 |
6.944272 |
|
Error |
4.98E-07 |
4 |
1.25E-07 |
|
|
|
|
Total |
5.13E-05 |
8 |
|
|
|
|
Table 9. Comprehensive comparison of the passive cooling technique relative to the current study
|
Author |
PV Capacity |
Type of Study |
Type of Fins |
Temperature Reduction |
Electrical Performance |
|
Chandrasekar and Senthilkumar [34] |
Si-Poly 25 Wp |
Experimental |
Aluminum heat spreader with cotton fabric |
5.9℃ |
Increased by 14% |
|
Grubišić-Čabo et al. [24] |
Si-Poly 50 Wp |
Experimental |
Perforated aluminum fins with random arrangement |
3℃ |
Increased by 2% |
|
Bayrak et al. [35] |
Si-Poly 75 Wp |
Experimental |
Aluminum fins with layout configuration |
3.39℃ |
Increased by 10.91% |
|
Arifin et al. [25] |
Si-Poly 50 Wp |
Experimental and numerical |
Fins with material variations |
10.2℃ |
Increased by 2.74% |
|
Ahmad et al. [36] |
Si-Poly 120 Wp |
Numerical |
Multi-level fin heat sink |
6.13% |
Increased by 2.87% |
|
Hudișteanu et al. [37] |
Si-Mono 320 Wp |
Numerical |
Copper perforated heat sink |
N/A |
Rise in power production by 6.49% |
|
Present study |
Si-Poly 50 Wp |
Experimental with a solar simulator |
Variation in geometry and model arrangements of fins |
43.5% |
Increased by 3.8% |
3.6 Comprehensive comparison with previous research
This study builds upon previous research that examines the effectiveness of fin heat sinks in enhancing photovoltaic performance by reducing operating temperatures and improving electrical efficiency. A comprehensive comparison of passive cooling methods for photovoltaics is presented in Table 9.
The study conducted by Grubišić-Čabo et al. [24] evaluated using fins as a passive cooling system with random configurations to enhance photovoltaic performance, achieving a 2% increase in electrical efficiency. Meanwhile, the research by Bayrak et al. [35] employed aluminum fins with various configurations, resulting in a temperature reduction of up to 3.39℃.
This study demonstrates superior results, with an efficiency improvement of up to 3.8%. Using the same cooling system variations, this achievement could be more promising if implemented outdoors under direct solar energy exposure. Future studies are encouraged to adopt this approach for more accurate and realistic outcomes.
This study discusses a simple passive cooling method to optimize energy conversion efficiency in photovoltaic devices. The passive cooling technique using fins offers a cost-effective solution with easy installation. In this research, engineering the geometric configuration and arrangement of the fins can reduce operating temperatures and enhance electrical efficiency. The operating temperature of the photovoltaic panel was reduced to 36.85℃, while electrical efficiency increased to 13.06%.
The angle of inclination (α) of the fins facing the airflow directly influences airflow resistance, with rectangular fins at (α=90°) having a more significant impact on photovoltaic performance than triangular (α=30°) and trapezoidal (α=60°) fins. Different arrangements of the fins also yield varying cooling effects. The arrangement with perforated fins at a 45° slope achieved better efficiency gains and temperature reductions than at 0° and 45° without perforations.
The research findings have been evaluated using ANOVA statistical methods, demonstrating a significant influence of the fin geometry and arrangement differences on photovoltaic performance. The geometric shape has a more substantial impact on reducing operating temperature and improving electrical efficiency, as indicated by the p-value of the established significance level. The p-values for geometric shape variations in lowering temperature and increasing electrical efficiency are 0.000028 and 0.0000107, respectively. Meanwhile, the p-values for configuration model variations in reducing temperature and increasing electrical efficiency are 0.00872 and 0.020375, respectively.
A study has found that using rectangular fins in a perforated β 45° configuration can significantly reduce temperature and increase electrical output efficiency in photovoltaic panels. The geometric shape of the fins also plays a significant role in improving efficiency. Passive cooling techniques like aluminum fins can be a cost-effective alternative to more complex and expensive active cooling systems. Future research should explore alternative fin geometries, dynamic conditions analysis, long-term performance studies, integration with smart technologies, economic analysis, and comparative studies. This combination of findings could significantly advance photovoltaic technology and enhance solar energy systems' overall efficiency.
This research was funded by a PNBP grant from Universitas Sebelas Maret, Indonesia, under contract number 194.2/UN27.22/PT.01.03/2024 of the Penelitian Hibah Grup Riset (penelitian Hgr-uns) A plan.
|
$\mathrm{I}_{\mathrm{SC}}$ |
Short circuit current (A) |
|
V |
Photovoltaic panel output voltage (V) |
|
$\mathrm{V}_{\mathrm{OC}}$ |
Open circuit voltage (V) |
|
$\mathrm{I}_{\mathrm{MPP}}$ |
Maximum current (A) |
|
FF |
Fill Factor |
|
Ilight |
Power of solar radiation (W/m2) |
|
Irad |
The intensity of sunlight (W/m2) |
|
A |
The active area of the solar cell (m2) |
|
PMPP |
Maximum power (Watt) |
|
H |
Convection coefficient (W/m2.K) |
|
K |
Thermal conductivity (W/m.K) |
|
T |
Thick of fin (m) |
|
Lc |
Corrected fin length (m) |
|
L |
Fin length (m) |
|
Afin |
Total surface area of fin (m2) |
|
w |
Width of fin (m) |
|
Greek symbols |
|
|
$\eta$ |
Efficiency (%) |
[1] Xia, X., Xia, J. (2010). Evaluation of potential for developing renewable sources of energy to facilitate development in developing countries. In 2010 Asia-Pacific Power and Energy Engineering Conference, Chengdu, China, pp. 1-3. https://doi.org/10.1109/APPEEC.2010.5449477
[2] Devabhaktuni, V., Alam, M., Depuru, S.S.S.R., Green II, R.C., Nims, D., Near, C. (2013). Solar energy: Trends and enabling technologies. Renewable and Sustainable Energy Reviews, 19: 555-564. https://doi.org/10.1016/J.RSER.2012.11.024
[3] Solarin, S.A. (2020). An environmental impact assessment of fossil fuel subsidies in emerging and developing economies. Environmental Impact Assessment Review, 85: 106443. https://doi.org/10.1016/j.eiar.2020.106443
[4] Dubey, S., Jadhav, N.Y., Zakirova, B. (2013). Socio-economic and environmental impacts of silicon based photovoltaic (PV) technologies. Energy Procedia, 33: 322-334. https://doi.org/10.1016/j.egypro.2013.05.073
[5] Dambhare, M.V., Butey, B., Moharil, S.V. (2021). Solar photovoltaic technology: A review of different types of solar cells and its future trends. Journal of Physics: Conference Series, 1913(1): 012053. https://doi.org/10.1088/1742-6596/1913/1/012053
[6] Zhang, C., Zhang, J., Ma, X., Feng, Q. (2021) Semiconductor Photovoltaic Cells. Springer Singapore. https://doi.org/10.1007/978-981-15-9480-9
[7] Mavromatakis, F., Kavoussanaki, E., Vignola, F., Franghiadakis, Y. (2014). Measuring and estimating the temperature of photovoltaic modules. Solar Energy, 110: 656-666. https://doi.org/10.1016/J.SOLENER.2014.10.009
[8] Aghaei, M., Fairbrother, A., Gok, A., Ahmad, S., Kazim, S., Lobato, K., Oreski, G., Reinders, A., Schmitz, J., Theelen, M., Yilmaz, P., Kettle, J. (2022). Review of degradation and failure phenomena in photovoltaic modules. Renewable and Sustainable Energy Reviews, 159: 112160. https://doi.org/10.1016/J.RSER.2022.112160
[9] Kumar, M., Kumar, A. (2017). Performance assessment and degradation analysis of solar photovoltaic technologies: A review. Renewable and Sustainable Energy Reviews, 78: 554-587. https://doi.org/10.1016/J.RSER.2017.04.083
[10] Ghadikolaei, S.S.C. (2021). Solar photovoltaic cells performance improvement by cooling technology: An overall review. International Journal of Hydrogen Energy, 46(18): 10939-10972. https://doi.org/10.1016/j.ijhydene.2020.12.164
[11] Santiko Wibowo, Z.A., Rachmanto, R.A., Himawanto, D.A., Prasetyo, S.D. (2024). Optimization of photovoltaic performance using a water spray cooling system with different nozzle types. International Journal of Computational Methods and Experimental Measurements, 12(1): 9-19. https://doi.org/10.18280/ijcmem.120102
[12] Apribowo, C.H.B., Habibie, A., Arifin, Z., Adriyanto, F. (2020). Experimental method for improving efficiency on photovoltaic cell with using floating installation method. AIP Conference Proceedings, 2217(1). https://doi.org/10.1063/5.0000827
[13] Arifin, Z., Tjahjana, D.D.D.P., Hadi, S., Rachmanto, R.A., Setyohandoko, G., Sutanto, B. (2020). Numerical and experimental investigation of air cooling for photovoltaic panels using aluminum heat sinks. International Journal of Photoenergy, 2020(1): 1574274. https://doi.org/10.1155/2020/1574274
[14] Arifin, Z., Prasetyo, S.D., Rachmanto, R.A., Juwana, W.E., Yohana, E., Widhiyanuriyawan, D. (2023). Optimizing photovoltaic thermal collector temperature with varying number of collectors: A CFD simulation study. International Journal of Heat and Technology, 41(5): 1255-1263. https://doi.org/10.18280/ijht.410515
[15] Bahaidarah, H.M., Baloch, A.A., Gandhidasan, P. (2016). Uniform cooling of photovoltaic panels: A review. Renewable and Sustainable Energy Reviews, 57: 1520-1544. https://doi.org/10.1016/J.RSER.2015.12.064
[16] Zubeer, S.A., Mohammed, H.A., Ilkan, M. (2017). A review of photovoltaic cells cooling techniques. E3S Web of Conferences. EDP Sciences, 22: 00205. https://doi.org/10.1051/e3sconf/20172200205
[17] Prasetyo, S.D., Arifin, Z., Prabowo, A.R., Budiana, E.P. (2024). Investigation of the addition of fins in the collector of water/Al2O3-based PV/T system: Validation of 3D CFD with experimental study. Case Studies in Thermal Engineering, 60: 104682. https://doi.org/10.1016/j.csite.2024.104682
[18] Prasetyo, S.D., Arifin, Z., Prabowo, A.R., Budiana, E.P. (2024). Examining various finned collector geometries in the Water/Al2O3 based PV/T system: An analysis using computational fluid dynamics simulation. International Journal of Heat and Technology, 42(3): 851-864. https://doi.org/10.18280/ijht.420314
[19] Nižetić, S., Giama, E., Papadopoulos, A.M. (2018). Comprehensive analysis and general economic-environmental evaluation of cooling techniques for photovoltaic panels, Part II: Active cooling techniques. Energy Conversion and Management, 155: 301-323. https://doi.org/10.1016/j.enconman.2017.10.071
[20] Prasetyo, S.D., Arifin, Z., Prabowo, A.R., Budiana, E.P., Rosli, M.A.M., Alfaiz, N.F., Bangun, W.B. (2023). Optimization of photovoltaic thermal collectors using fins: A review of strategies for enhanced solar energy harvesting. Mathematical Modelling of Engineering Problems, 10(4): 1235-1248. https://doi.org/10.18280/mmep.100416
[21] Arifin, Z., Prasetyo, S.D., Tribhuwana, B.A., Tjahjana, D.D.D.P., Rachmanto, R.A., Kristiawan, B. (2022). Photovoltaic performance improvement with phase change material cooling treatment. International Journal of Heat and Technology, 40(4): 953-960. https://doi.org/10.18280/ijht.400412
[22] Žižak, T., Domjan, S., Medved, S., Arkar, C. (2022). Efficiency and sustainability assessment of evaporative cooling of photovoltaics. Energy, 254: 124260. https://doi.org/10.1016/j.energy.2022.124260
[23] Ibrahim, M., Saeed, T. (2021). Designing a new heat sink containing nanofluid flow to cool a photovoltaic solar cell equipped with reflector. Journal of the Taiwan Institute of Chemical Engineers, 124: 9-16. https://doi.org/10.1016/j.jtice.2021.05.015
[24] Grubišić-Čabo, F., Nižetić, S., Čoko, D., Kragić, I.M., Papadopoulos, A. (2018). Experimental investigation of the passive cooled free-standing photovoltaic panel with fixed aluminum fins on the backside surface. Journal of Cleaner Production, 176: 119-129. https://doi.org/10.1016/j.jclepro.2017.12.149
[25] Arifin, Z., Suyitno, S., Tjahjana, D.D.D.P., Juwana, W.E., Putra, M.R.A., Prabowo, A.R. (2020). The effect of heat sink properties on solar cell cooling systems. Applied Sciences, 10(21): 7919. https://doi.org/10.3390/app10217919
[26] Ahmad, E.Z., Sopian, K., Fazlizan, A., Jarimi, H., Ibrahim, A. (2022). Outdoor performance evaluation of a novel photovoltaic heat sinks to enhance power conversion efficiency and temperature uniformity. Case Studies in Thermal Engineering, 31: 101811. https://doi.org/10.1016/j.csite.2022.101811
[27] Abdallah, R., Haddad, T., Zayed, M., Juaidi, A., Salameh, T. (2024). An evaluation of the use of air cooling to enhance photovoltaic performance. Thermal Science and Engineering Progress, 47: 102341. https://doi.org/10.1016/j.tsep.2023.102341
[28] Chan-Dzib, E., Bassam, A., Carrillo, J.G. (2024). Novel curled cooler to enhance the efficiency of a photovoltaic panel system. Applied Thermal Engineering, 249: 123317. https://doi.org/10.1016/j.applthermaleng.2024.123317
[29] Khelifa, A., Attia, M.E.H., Harby, K., Abdel-Aziz, M.M., Abdelgaied, M. (2024). Experimental and economic evaluation on the performance improvement of a solar photovoltaic thermal system with skeleton-shaped fins. Applied Thermal Engineering, 248: 123180. https://doi.org/10.1016/j.applthermaleng.2024.123180
[30] Nižetić, S., Grubišić-Čabo, F., Marinić-Kragić, I., Papadopoulos, A.M. (2016). Experimental and numerical investigation of a backside convective cooling mechanism on photovoltaic panels. Energy, 111: 211-225. https://doi.org/10.1016/j.energy.2016.05.103
[31] Arifin, Z., Kuncoro, I.W., Hijriawan, M. (2021). Solar simulator development for 50WP solar photovoltaic experimental design using halogen lamp. International Journal of Heat and Technology, 39(6): 1741-1747. https://doi.org/10.18280/ijht.390606
[32] Chedid, R., Tajeddine, R., Chaaban, F., Ghajar, R. (2014). Modeling and simulation of PV arrays under varying conditions. In MELECON 2014-2014 17th IEEE Mediterranean Electrotechnical Conference, Beirut, Lebanon, pp. 536-542. https://doi.org/10.1109/MELCON.2014.6820592
[33] Zhou, G., Ye, Q. (2012). Experimental investigations of thermal and flow characteristics of curved trapezoidal winglet type vortex generators. Applied Thermal Engineering, 37: 241-248. https://doi.org/10.1016/j.applthermaleng.2011.11.024
[34] Chandrasekar, M., Senthilkumar, T. (2015). Experimental demonstration of enhanced solar energy utilization in flat PV (photovoltaic) modules cooled by heat spreaders in conjunction with cotton wick structures. Energy, 90: 1401-1410. https://doi.org/10.1016/j.energy.2015.06.074
[35] Bayrak, F., Oztop, H.F., Selimefendigil, F. (2019). Effects of different fin parameters on temperature and efficiency for cooling of photovoltaic panels under natural convection. Solar Energy, 188: 484-494. https://doi.org/10.1016/j.solener.2019.06.036
[36] Ahmad, E.Z., Fazlizan, A., Jarimi, H., Sopian, K., Ibrahim, A. (2021). Enhanced heat dissipation of truncated multi-level fin heat sink (MLFHS) in case of natural convection for photovoltaic cooling. Case Studies in Thermal Engineering, 28: 101578. https://doi.org/10.1016/j.csite.2021.101578
[37] Hudișteanu, S.V., Țurcanu, F.E., Cherecheș, N.C., Popovici, C.G., Verdeș, M., Huditeanu, I. (2021). Enhancement of PV panel power production by passive cooling using heat sinks with perforated fins. Applied Sciences, 11(23): 11323. https://doi.org/10.3390/app112311323