Dhafar Fadhil Ali*![]() | Sajida Lafta Ghashim
| Sajida Lafta Ghashim![]()
© 2024 The authors. This article is published by IIETA and is licensed under the CC BY 4.0 license (http://creativecommons.org/licenses/by/4.0/).
OPEN ACCESS
This investigation studies a rectangular slot jet impingement on a copper foam flat plate numerically. The current paper studied the effect of copper foam's thickness and pore density on heat transfer characteristics using the ANSYS Fluent package. Simulation is conducted for Reynolds number (Re), which varies between 5200 and 14000, and slot-to-plate distance (z/b), which varies between 2 and 8. The copper foams have a porosity of 90%, thicknesses of 4, 8, and 12 mm, and pore densities of 10, 20, 30, and 40 PPI. The local Nusselt number (Nu) and average Nusselt number $(\overline{N u})$ of the copper foam flat surface are better than the smooth flat surface, regardless of the thickness and pore density of the copper foam. The Nu and $\overline{N u}$ of a copper foam flat surface for a thickness of 4 mm provide higher augmentation than those for 8 mm and 12 mm thicknesses. The Nu and $\overline{N u}$ of the copper foam flat surface of 10 PPI provide a higher augmentation than the copper foam flat surfaces of 20 PPI, 30 PPI, and 40 PPI. The influence of slot-to-plate distance on the Nu of the target surface is studied. For the case of the smooth flat surface, the Nu slightly increased with the increment of the slot-to-plate distance. In the case of the copper foam flat surface, the effect of slot-to-plate distance on Nu and $\overline{N u}$ is dependent on the thickness of the copper foam. The influence of the thickness of copper foam on jet velocity and the total pressure distribution were discussed in detail using the numerical model.
copper foam, copper foam thickness, jet impingement, local Nusselt number, numerical study, unconfined slot jet
Applications of jet impinging to improve localized heat transfer are common. It involves film desiccation, paper, textiles, electronic equipment cooling, and gas turbines. The earlier research concentrated on a jet impinging on a smooth, flat plate. The study examined the influence of both the Reynolds number and the slot-to-plate distance on thermal performance. This was reported by Nirmalkumar et al. [1], Joshi and Sahu [2], Dhruw and Kothadia [3], Attalla and Salem [4], and Caliskan et al. [5]. One popular cooling technique that improves heat transfer is a porous medium. Open-cell mineral foam has been getting attention due to its many thermal mechanical attributes, for example, high permeability, high matrix thermal conductivity, high strength and hardness with lightweight properties, and high surface area intensity. Most previous studies studied the thermal properties of a metal foam flat surface under air jet impingement. Hwang and Yang [6] numerically studied the thermal performance between a restricted slot jet and a metallic foamed block. They observed that the use of the metallic porous block may significantly enhance the cooling performance of jet impingement. Singh et al. [7] looked into how various nozzle shapes—elliptical, round, square, and triangle—affected the thermal characteristics of the copper foam target surface. They conducted the tests for (Re = 10,000–30,000) and jet to surface distances (z/d = 1–10). Copper foam has 20 PPI and 90% porosity. The heat transfer of the target surface with copper foam under jet impinging is better than the smooth target surface. The improvement in local heat transfer is shown at z/d ≤4, while a uniform augmentation in thermal performance is noted across the entire heated surface at a higher value (z/d > 6).
Wang et al. [8] tested the enhancement of heat transfer in a heat sink with copper foam fins under jet impingement. Experiments were conducted on (2053 ≤ Re ≤ 12737), different heat sink heights (15, 30, 45, and 60 mm), and different PPIs (10, 20, and 30 PPI). They discovered that finned copper foams have superior thermal properties than conventional heat sinks with an equal number of fins. Yogi et al. [9] tested the thermal properties of an unrestricted rectangular air jet impinging on the aluminum foam target surface. Aluminum foams have a 92% porosity and 10, 20, and 40 PPI. Regardless of the PPI, the aluminum foam target surface improves the Nu and $\overline{N u}$ more than the smooth target surface. The Nu of the target surface covered aluminum foam having 10 and 20 PPI is higher than the aluminum foam target surface at 40 PPI. The Nu and $\overline{N u}$ of the aluminum foam flat plate have less influence on the jet-to-plate distance. Singh et al. [10] tested a thin aluminum foam with significant porosity and various combinations of jet array impingement. Different configurations of air jets of 10, and 20 PPI pore density and metal foam thickness were examined to assess the characteristics of heat transfer. The findings indicate that the best design was found for the 20 PPI with a center foam of 12.70 mm thick when exposed to the highest proportion of open area. Sambamurthy et al. [11] analyzed experimentally thin metallic foam with high porosity (93%) under array jet impingement at the maximum and intermediate crossflow conditions. Testing was done for 5, 20, and 40 PPI pore densities. The Nu increases with an increment in PPI at a constant jet-to-surface distance and decreases with an increment in the jet-to-surface distance at a fixed PPI. Fu and Huang [12] analyzed the influence of jet impingement on a porous medium with a varied shape placed on a heated plate. Three porous media samples (rectangular, convex, and concave) are examined. They discovered that the three metal foam samples with low porosity enhanced thermal performance. Concave metal foam with large porosity enhances heat transfer. Shih et al. [13] examined the height of aluminum foams subjected to jet impingement. Tests were conducted for various densities of the pores at 10, 20, and 40 PPI and porosity (0.87, 0.92, 0.94, and 0.96). Convective heat transfer is improved, and the Nu rises as the pore density and porosity decrease. Amori and Khalaf [14] numerically and experimentally studied a restricted jet impinging over a porous surface. They performed that test on (Re = 14000 – 70000). The finite volume approach has been employed to analyze two-dimensional governing equations with the (k-ε) model. They reported that the heat transfer rates from heated surfaces increase with increasing Re. Sivasamy et al. [15] examined thermal properties under mixed convection conditions. It looked into a numerical simulation of the two-dimensional jet impinging on an isothermal surface submerged in an unrestricted porous medium. The jet-to-heated section distance (0.1 ≤ H ≤ 1.0). It is discovered that the jet-to-heated section decreases with the increment of the $\overline{N u}$. Yogi et al. [16] conducted an experimental analysis between a rectangular slot jet impinging and an aluminum foam flat plate. They studied aluminum foams (4, 8, and 12) mm thick with a density of pore of 20 PPI with 5200 ≤ Re ≤ 12000 and jet to target-plate distance having a range of 2 ≤ z/b ≤ 10. The results demonstrated that, based on the aluminum foam thickness, the impinging jet on the aluminum foam's target surface encounters increasing hydraulic resistance.
The study goal is to numerically examine the Nu and $\overline{N u}$ under jet-impinging conditions on a copper foam flat plate. The study examines the thickness of copper foam, pore density, slot-to-plate distance, and Reynolds number. The primary goal is to determine copper foam's thickness and pore density to achieve the highest heat transfer rates.
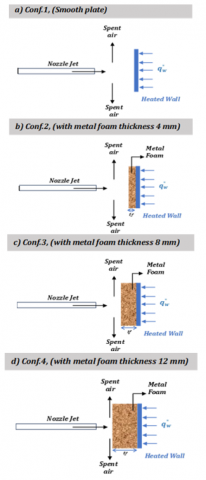
The influence of copper foam on convection thermal performance was studied numerically. Figure 1 illustrates the physical model adopted in the current research system of a rectangular slot jet impinged on a copper foam target surface subjected to a constant heat flux. A rectangular slot jet's length (Ls) and width (b) are 150 mm × 6.4 mm, respectively. The target plate dimensions are L = 200 mm, W = 100 mm, and t = 3 mm, respectively, and they are examined without copper foam (smooth) or completely covered with copper foam. The fluid used in this experiment is air at ambient pressure and temperature. The air is in a steady state, turbulent, and incompressible. The atmospheric pressure represents the outlet boundary condition. All the thermophysical properties of the fluid and solid phases are constant. The copper foams are assumed to be isotropic and homogeneous. Furthermore, it was assumed that the fluid and solid phase temperatures are constant throughout the porous zone, and the local thermal equilibrium (LTE) model was applied to the current investigation. The numerical computations were conducted by ANSYS FLUENT, which was used in many studies by Ezzat et al. [17] and Amori and Adeeb [18]. This program is a quicker and more inexpensive testing technique than traditional design techniques, which call for the creation of numerous models by Jasim et al. [19]. Figure 2 shows the different configurations of jet impingement in the present study.
Figure 1. Schematic of the physical model
Figure 2. Different configurations of jet impingement with smooth target surface and copper foam target surface
2.1 Governing equations
The governing equations, Eqs. (1)-(3), are the three-dimensional Navier-Stokes equations, which include continuity, momentum, and energy, as discussed by Isaac et al. [20].
$\frac{\partial\left(\rho u_i\right)}{\partial x_i}=0$ (1)
$\rho u_j \frac{\partial u_i}{\partial x_j}=-\frac{\partial p}{\partial x_i}+\frac{\partial}{\partial x_j}\left[\mu\left(\frac{\partial u_i}{\partial x_j}+\frac{\partial u_j}{\partial x_j}\right)-\rho \overline{u_i^{\prime} u_j^{\prime}}\right]$ (2)
$\rho u_j \frac{\partial T}{\partial x_j}=\frac{\partial}{\partial x_j}\left[\frac{\mu}{\operatorname{Pr}} \frac{\partial T}{\partial x_j}-\rho \overline{T^{\prime} u_j^{\prime}}\right]$ (3)
where, P is the static pressure ui is the average velocity, $u_i^{\prime}, u_i^{\prime}$ are turbulent components of the velocity in Eq. (1), the terms $-\rho \overline{u_i^{\prime} u_j^{\prime}}$ and $\rho \overline{T^{\prime} u_j^{\prime}}$ in the Eq. (2) and Eq. (3) represent the Reynolds stress term and specific turbulent heat flux respectively.
The $K-\epsilon$ with increased wall treatment is used to model the Reynolds stress and turbulent heat convection transfer. The K-ϵ turbulence model reported more accurate findings for impinging jet heat transfer with much less computing work than previous RANS models. It included two transport equations: one for the turbulent kinetic energy (k) and another for the turbulent dissipation rate (ϵ) [21].
$\begin{aligned} & \frac{\partial}{\partial x_i}\left(\rho u_i k\right)=\frac{\partial}{\partial x_i}\left(\frac{\mu_t}{\sigma_k} \frac{\partial k}{\partial x_i}\right)+\mu_t\left(\frac{\partial u_i}{\partial x_j}+\frac{\partial u_j}{\partial x_i}\right) \frac{\partial u_i}{\partial x_j}-\rho \epsilon\end{aligned}$ (4)
$\begin{gathered}\frac{\partial}{\partial x_i}\left(\rho u_i \epsilon\right)=\frac{\partial}{\partial x_i}\left(\frac{\mu_t}{\sigma_\epsilon} \frac{\partial \epsilon}{\partial x_i}\right)+\mathrm{C}_{1 \epsilon} \frac{\epsilon}{k} \mu_t\left(\frac{\partial u_i}{\partial x_j}+\frac{\partial u_j}{\partial x_i}\right) \frac{\partial u_i}{\partial x_j}-\mathrm{C}_{2 \epsilon} \rho \frac{\epsilon^2}{k}\end{gathered}$ (5)
The turbulent eddy viscosity is then related to k and $\epsilon$ by the expression $\mu_t=\mathrm{C}_\mu \rho \frac{k^2}{\epsilon}$. The coefficients $\mathrm{C}_\mu, \mathrm{C}_{1 \epsilon}, \mathrm{C}_{2 \epsilon}, \sigma_k, \sigma_\epsilon$ are constants that have the following empirically derived values; $C_\mu=0.09, C_{1 \epsilon}=1.44, C_{2 \epsilon}=1.92, \sigma_k=1.0, \sigma_\epsilon=1.3$.
The governing equations of metal foam include Lin et al. [22]:
Continuity equation:
$\frac{\partial\left(\rho u_i\right)}{\partial x_i \cdot \beta}=0$ (6)
Momentum equation:
$\begin{gathered}\frac{\partial\left(\rho u_i u_j\right)}{\partial x_i}=-\beta \frac{\partial p}{\partial x_i}+\frac{\partial}{\partial x_j}\left(\left(\mu+\mu_t\right)\left(\frac{\partial u_i}{\partial x_j}+\frac{\partial u_j}{\partial x_i}\right)\right) -\beta\left(\frac{\mu}{\alpha} u_i+\frac{\rho C_F}{\sqrt{\alpha}}|u| u_i\right)\end{gathered}$ (7)
Adding a pore model in simulation is an additional source to the momentum conservation equation:
$\vec{S}=\left(\frac{\mu}{\alpha} u_i+\frac{\rho C_F}{\sqrt{\alpha}}|u| u_i\right)$ (8)
In Eq. (8), the first term represents the Darcy term, while the second term represents the Forchheimer (or inertia) term. These terms describe the impedance of metal foam to the flow of air, with the permeability and inertial drag factor of the metal foam being represented by these terms, respectively.
The energy equation for the model of local thermal equilibrium is presented by Lin et al. [22].
$\beta \frac{\partial\left(\rho C_p u_j T\right)}{\partial x_j}=k_{e f f} \frac{\partial}{\partial x_j}\left(\frac{\partial T}{\partial x_j}\right)$ (9)
The current work evaluates the characteristics of metal foam, including pore diameter, permeability, and inertial coefficient, using the equations provided by Wang et al. [23].
$d_p=\frac{0.0254}{P P I}$ (10)
$\alpha=\frac{\left(d_p\right)^2}{150} \cdot \frac{\beta^3}{(1-\beta)^2}$ (11)
$c_1=\frac{1}{\alpha}$ (12)
$c_2=\frac{3.5(1-\beta)}{d_p \beta^3}$ (13)
$k_{\text {eff }}=\beta k_{\text {air }}+(1-\beta) k_{\text {solid }}$ (14)
where, β denotes the porosity, α represents foam permeability, and dp represents the pore diameter in m.
The viscous resistance and inertia resistance were denoted by symbols c1 and c2. Also, keff represents the metal foam's effective thermal conductivity in W/m K.
For a rectangular slot jet, the Reynolds number is calculated according to Yogi et al. [9].
$R e=\frac{\rho v b}{\mu}$ (15)
where, μ represents the air's dynamic viscosity in Pa·s, b represents the width of the slot nozzle in meters, v denotes the average exit velocity of the jet in m/s, and ρ signifies the air density in kg/m³. All of the air attributes are assessed at the temperature of jet exit Tj.
The heat transfer coefficient can be determined using the method described by Yogi et al. [9].
$h=\frac{q_{\text {conv }}^{\prime \prime}}{\left(T_w-T_j\right)}$ (16)
where, $T_{i j}$ represents the temperature of the air jet in ${ }^{\circ} \mathrm{C}, T_w$ represents the temperature of the wall, and $h, \bar{h}$ represents local and average convection heat transfer coefficient in (W. $\mathrm{m}^{-2} \mathrm{~K}^{-1}$ ). The local and average Nusselt number is results using Yogi et al. [9].
$N u=\frac{h b}{k_{\text {air }}}$ (17)
$\overline{N u}=\frac{\bar{h} b}{k_{\text {air }}}$ (18)
where, b represents the slot nozzle width in m.
2.2 Boundary conditions
Figure 3. Schematic of the boundary condition
Figure 3 illustrates the symmetry around the Y-axis for the flow and heat transfer characteristics. Because of this symmetry, only one-half is taken into account for computing, and the following boundary conditions apply:
At X=0
$\begin{aligned}& \frac{\partial T(0, y, z)}{\partial x}=u(0, y, z)=\frac{\partial v(0, y, z)}{\partial x}=\frac{\partial w(0, y, z)}{\partial x}=0\end{aligned}$ (19)
At X= W/2 + d (streamwise direction)
$\begin{aligned}\frac{\partial T\left(\frac{W}{2}, y, z\right)}{\partial x}=\frac{\partial u\left(\frac{W}{2}, y, z\right)}{\partial x}=\frac{\partial v\left(\frac{W}{2}, y, z\right)}{\partial x}=\frac{\partial w(W / 2, y, z)}{\partial x}=0\end{aligned}$ (20)
At Y=0 (symmetry)
$\begin{gathered}\frac{\partial T(x, 0, z)}{\partial y}=\frac{\partial u(x, 0, z)}{\partial y}=v(x, 0, z)=\frac{\partial w(x, 0, z)}{\partial y}=0\end{gathered}$ (21)
At Y= L/2 + D (spanwise direction)
$\begin{gathered}\frac{\partial T\left(x, \frac{L}{2}, z\right)}{\partial y}=\frac{\partial u\left(x, \frac{L}{2}, z\right)}{\partial y}=\frac{\partial v\left(x, \frac{L}{2}, z\right)}{\partial y}=\frac{\partial w(x, L / 2, z)}{\partial y}=0\end{gathered}$ (22)
At Z = 0 (Target plate)
$u(x, y, 0)=v(x, y, 0)=w(x, y, 0)=0$ (23)
$T(x, y, 0)=T_h \text { for } 0<x<b / 2,0<y<L_s / 2$ and otherwise (24)
At Z = S (slot-to-plate distance)
$u(x, y, s)=v(x, y, s)=T(x, y, s)=0$ (25)
Fluid‐metal foam interface:
$K_{\text {air }} \frac{\partial T_{\text {air }}}{\partial x}=K_f \frac{\partial T_f}{\partial x}$ (26)
$T_{\text {air }}=T_f$ (27)
Tair and Tf represent the temperature of air and metal foam in K. kair and kf represent the thermal conductivity of air and metal foam in (W. m-1. K-1).
2.3 Computational domain and numerical solution procedure
Figure 4 shows that the computational domain in this study was selected to be bigger than the physical domain in order to satisfy the continuity criterion at the exit and to remove the effect of entrance and exit. The governing equations and the boundary conditions are solved by using the control-volume integration approach of Patankar [24]. For pressure-velocity coupling, the Coupled (Simi-Implicit Method for Pressure-Linked Equations) algorithm was selected. While the turbulent kinetic energy and turbulent dissipation rate were discretized using a 1st upwind approach, the momentum and energy equations were discretized using a 2nd upwind approach.
Figure 4. Computational domain with boundary conditions
2.4 Grid independence study
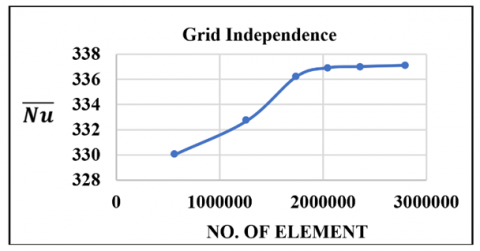
Mesh distribution has an important effect on the simulation cost and the precision of the numerical results. Coarser or finer meshes produce different output results; hence, varying the mesh is necessary to get the desired tolerance level, according to Midhat and Aljubury [25]. The velocity and temperature changes are so great in the jet zone that a finer mesh distribution was made. Figure 5 noted a typical mesh distribution for the computational domain. Five distinct grids for the pore density of copper foam for 10 PPI were examined to verify the independence of the solutions from the grids, assuming that Re = 14000 and z/b = 2. Figure 6 displays the $\overline{N u}$ results on the target surface with various grid sizes.
Figure 5. Section view of mesh distribution
Figure 6. Mesh-independency check for the copper foam target surface of 10 PPI at Re=14000 and z/b=8
A numerical investigation of the thermal characteristics of a single rectangular jet impinging on a smooth flat surface and a copper foam flat surface is carried out. The copper foam flat surface for thicknesses of (4, 8, and 12) mm, varying the pore densities of (10, 20, 30, and 40) PPI and porosity of 90%, is studied. The ranging Reynolds number (Re = 5200 to 14000) and the slot-to-plate distance (z/b = 2, 4, 6, and 8) are the parameters studied. Equation solving was done using ANSYS FLUENT 2021R1 and was built on the finite volume approach. Because it provides a stable and acceptable level of accuracy for the chosen solution domain, the standard k-ϵ model, which depends on RANS, is a turbulent model employed to solve turbulent equations.
3.1 Validation of results
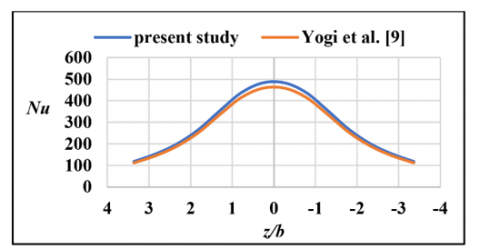
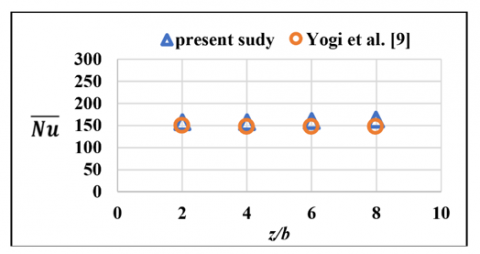
The present numerical validation was conducted on a copper foam target surface with 10 PPI subjected to impinging by a slot air jet. Figure 7 shows the comparison of the Nu and $\overline{N u}$ for the present numerical study with the findings published by Yogi et al. [9]. The Nu and $\overline{N u}$ of current numerical results show a maximum difference of 11% and 12%, respectively, with Yogi et al. [9]. As a result, the comparisons of the numerical solution approach are in agreement with the results of Yogi et al. [9].
(a) The Nu of copper foam target surface with 10 PPI at Re=5200 and z/b=2
(b) The $\overline{N u}$ of copper foam target surface of 10 PPI at Re=5200
Figure 7. Comparison of the current findings with published results by Yogi et al. [9]
3.2 Effect of the thickness of metal foam on the local Nusselt number distribution
Figures 8-11 present the numerical results for the distribution of Nu of a smooth target surface and a copper foam target surface with different thicknesses and pore densities of copper foam at Re of 5200, 9600, and 14000 and Z/b of 2.
Figure 8 displays the distribution of the Nu of a smooth target surface and a copper foam target surface at 10 PPI. It is observed that the thermal performance of a copper foam target surface is better than that of a smooth target surface, regardless of the copper foam thickness. The Nu of a copper foam target surface was higher at the stagnation point than that of a smooth target surface. When an air jet impinges the top of the copper foam target surface (due to direct impingement on the copper foam ligaments at the top surface of the foam), a tiny portion of the air jet that cannot travel through the copper foam is bypassed from the top surface of the copper foam. The residual jet fluid hits the target surface after going through the metal foam. The entering jet stream splits into multiple microjets due to the porous structure of the copper foam [9]. This array of micro-jets at the stagnation zone may cause the stagnation Nu number of a copper foam target surface to increment more than a smooth target surface. The stagnation region is where the Nu is largest, and it falls streamwise. The results showed that the Nu of the copper foam target surface increases when the copper foam thickness is reduced. Because thinner foams allow for greater jet penetration and higher foam volume utilization, leading to faster heat transfer rates, the smallest increase in the Nu of a copper foam target surface occurred at 12 mm thick compared to the Nu of a copper foam target surface at 4 and 8 mm thick. Because the additional hydraulic resistance of a copper foam target surface increases with augmentation thickness, It is found that for both the copper foam target surface and the smooth target surface, the Nu increases at streamwise sites as the Re increases. It might be the result of the jet's increasing momentum as the Re rises.
Figure 8. The distribution of Nu for the smooth target surface and the copper foam flat surface with 10 PPI and different thicknesses at different Re and z/b=2
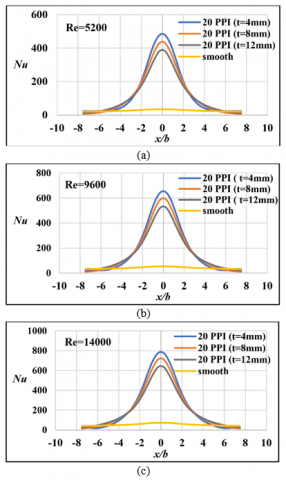
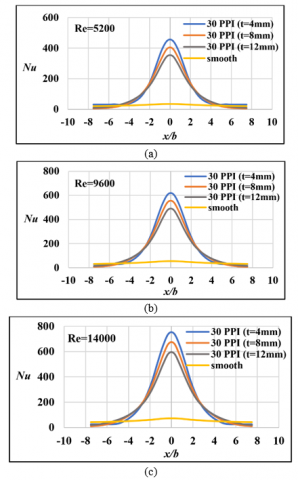
Figures 9-11 show the distribution of the Nu in the case of a copper foam target surface of 20, 30, and 40 PPI with different thicknesses and in the case of a smooth target surface. The distribution of the Nu of a copper foam target surface of 20, 30, and 40 PPI had similar behavior to the distribution of the Nu of a copper foam target surface of 10 PPI. Regardless of the thickness of the copper foam, the Nu of a copper foam target surface of (20, 30, and 40) PPI has a lower augmentation compared to a copper foam target surface of 10 PPI. The Nu of a copper foam target surface with 40 PPI has a lower augmentation compared to a copper foam target surface with 20 and 30 PPI, respectively. With the Re increase, the Nu of copper foam of (20, 30, and 40) PPI increases. This observation includes all slot-to-plate distances in the current study.
Figure 9. The distribution of Nu for the smooth target surface and the copper foam target surface with 20 PPI and different thicknesses at different Re and z/b = 2
Figure 10. The distribution of Nu for the smooth target surface and the copper foam target surface with 30 PPI and different thicknesses at different Re and z/b = 2
Figure 11. The distribution of Nu for the smooth target surface and the copper foam target surface with 40 PPI and different thicknesses at different Re and z/b = 2
Figure 12 displays the Nu contour plots of a smooth target surface and a copper foam target surface with 10 PPI and various thicknesses at Re = 14000 and z/b = 2. In the case of a smooth target surface, the contour plots of the Nu are symmetrical in both the streamwise and spanwise directions. The Nu reaches a maximum at the stagnation point and lessens streamwise (x). In the spanwise direction (y), the form of the rectangular, as defined through the rectangular slot, is noticed. Beyond it, the shape of a dumbbell is seen. The exit velocity of the jet in the spanwise direction (y) may cause this shape to be seen after impingement. The Nu contour plot for a copper foam target surface is symmetrical along the streamwise direction. The dumbbell-like form is not seen in the spanwise direction of the copper foam target surface because copper foam helps the jet straighten the spanwise flow.
Figure 12. The distribution of Nu contour of a smooth target surface and copper foam target surface of 10 PPI and different thicknesses at Re=14000 and z/b=2
3.3 Effect of pore densities on Nu
Figures 13(a)-(c) show the distribution of the Nu of the smooth target surface and the copper foam target surface with different PPI at various Re and z/b = 2. Regardless of the PPI, the copper foam target surface enhances the Nu compared to the smooth target surface. It demonstrates that as the PPI decreases, the Nu increases. Copper foam with a lower PPI allows for greater jet penetration and higher foam volume utilization, leading to faster heat transfer rates. The enhanced Nu of a copper foam target surface at 10 PPI is higher than that of a copper foam target surface at 20, 30, and 40 PPI. Because the additional hydraulic resistance of a copper foam target surface increases with an increase in pore density, it is observed that the highest Nu will be at 10 PPI, and the lowest Nu will be at 40 PPI. For both the copper foam target surface and the smooth target surface, the Nu rises as the Re increases due to the jet momentum. These observations include all Re and slot-to-plate distances.
Figure 13. The Nu of a smooth target surface and a copper foam target surface of 4 mm thick and having different PPI with z/b=2 at a) Re=5200, b) Re=9600, c) Re=14000
3.4 Effect of slot-to-plate distance on Nu
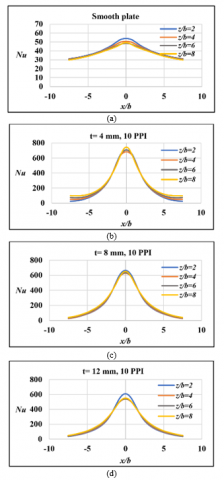
The influence of an increment in slot-to-plate distance from 2 to 8 on the Nu of a smooth target surface and a copper foam target surface with 10 PPI and various copper foam thicknesses is shown in Figures 14(a)-(d). The Nu of the smooth target surface has a little increase with the increment of the slot-to-plate distance, as seen in Figure 14(a). The curve lines of the Nu of the copper foam target surface with a thickness of 4 mm and slot-to-plate distances of 2, 4, and 6 overlap, but the peak higher of the Nu was achieved at a slot-to-plate distance of 8, as seen in Figure 14(b). The curve lines of the Nu of the copper foam target surface 8 mm thick are overlapped for all slot-to-plate distances, as seen in Figure 14(c). The curve lines of the Nu of the copper foam target surface with a thickness of 12 mm and slot-to-plate distances of 4, 6, and 8 overlap, but the peak higher of the Nu was achieved at a slot-to-plate distance of 2, as seen in Figure 14(d). A slot-to-plate distance was observed to not influence the Nu of a copper foam target surface 8 mm thick. It has been discovered that flow deflection is particularly important for foams with poor permeability and low slot-to-plate distance. Increased slot-to-plate distance enables a greater amount of flow to pass through the heat sink evenly, Yakkatelli et al. [26]. These observations include all Reynolds numbers and different pore densities.
Figure 14. Influence of a slot-to-plate distance on Nu of a smooth target surface and a copper foam target surface with 10 PPI and different copper foam thicknesses at Re = 9600
3.5 The average Nusselt number $(\overline{N u})$
Figures 15(a)-(d) illustrate the variance of the $\overline{N u}$ for a smooth target surface and a copper foam target surface of various thicknesses and pore densities at slot-to-plate distances (2, 4, 6, and 8). The $\overline{N u}$ of a copper foam target surface is higher than a smooth target surface. The $\overline{N u}$ for a copper foam flat surface 12 mm thick shows less augmentation than a copper foam flat surface 4 and 8 mm thick. It might occur because the copper foam gives the jet fluid increased hydraulic resistance while flowing in a streamwise direction.
Figure 15. The $\overline{N u}$ of copper foam flat surface and smooth flat surface for various slot-to-plate distances (z/b), pore density (PPI), and copper foam thickness at Re=14000
The $\overline{N u}$ for a copper foam flat surface of 10 PPI and thicknesses of (4, 8, and 12) mm is 81%, 80%, and 79% higher than a smooth flat surface at z/b = 2 and Re = 14000, respectively. The 4 mm thick copper foam has an increase of 4% and 9% in $\overline{N u}$ compared to 8mm and 12 mm thick of the copper foam, respectively with Re 14000 and z/b of 2. The $\overline{N u}$ of a copper foam flat surface with 40 PPI shows lower augmentation than a copper foam flat surface with 20, 30, and 40 PPI. The $\overline{N u}$ of a copper foam flat surface with thicknesses of 4 mm and pore densities of 10, 20, 30, and 40 PPI is higher by 81%, 76%, 74%, and 72% higher than a smooth flat surface at z/b = 2 and Re = 14000, respectively. The 10 PPI copper foam has an increase of 22%, 29%, and 33% in $\overline{N u}$ compared to 20, 30, and 40 PPI of the copper foam, respectively with Re 14000 and z/b of 2. For all thicknesses, the $\overline{N u}$ of a copper foam flat surface increases monotonically with the slot-to-plate distance.
3.6 Effect of the thickness of copper foam on the jet velocity distribution
Figure 16. Variation of jet velocity distribution along the streamwise direction of a smooth target surface and copper foam target surface for various thicknesses of copper foam at (Re = 14000 and z/b=8)
Figure 17. Variation of jet velocity distribution along the streamwise direction of the copper foam flat surface for various PPI of copper foam at (Re = 9600 and z/b=8)
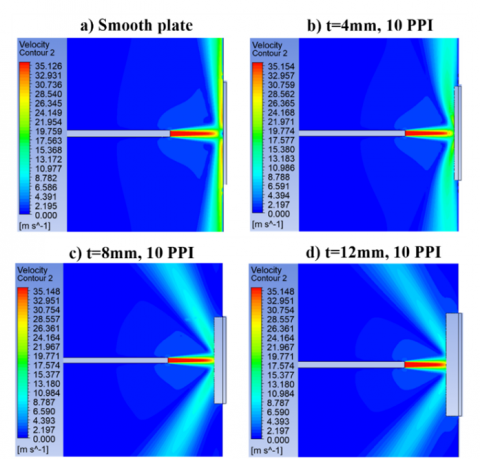
For z/b = 8 and Re = 14000, Figures 16(a)-(d) show the jet velocity distribution in a streamwise direction. It discovered clear variations in the streamline of the jet on both a smooth target surface and a copper foam target surface with various thicknesses. For a smooth target surface, the distribution of jet velocity is streamlined and intense near the heated wall. The copper foam flat surface at 12 mm thick can achieve the lowest jet velocity distribution compared to the copper foam flat surfaces at 4 mm and 8 mm thick. The results indicate that with the increasing thickness of the copper foam, the airflow is deflected away from the real impingement zone. because of the increase in air resistance, which makes it difficult for the air jet to penetrate the porous medium. These observations include all the Re, pore densities, and slot-to-plate distances.
Figures 17(a)-(d) display the variation of jet velocity distribution in a streamwise direction of the copper foam target surface for various PPI of metal foam of a fixed thickness of 4 mm at (Re = 9600 and z/b = 8). It was observed that the velocity distribution is fixed with variation PPI.
3.7 Effect of the thickness of copper foam on the total pressure distribution
Figures 18(a)-(d) show the total pressure distribution of the smooth target surface and the copper foam target surface having various thicknesses. The flow pressure drop is caused by kinetic energy lost after exiting the nozzle, and the pressure drop close to the wall may be attributed to viscous losses. The total pressure distribution of a smooth target surface is higher than that of a copper foam target surface, regardless of the thickness of the copper foam. The total pressure of a copper foam target surface 4 mm thick is higher than that of a copper foam target surface 8 mm and 12 mm thick. When the copper foam thickness increases, the winding paths inside the foam increase, which leads to a pressure drop in the fluid flowing within the porous medium. These observations include all the densities of pores, slot-to-plate distance, and Reynolds number.
Figure 18. Total pressure distribution on the central transverse plane of smooth target surface and copper foam target surface for various thicknesses of copper foam at (Re = 14000 and z/b = 8)
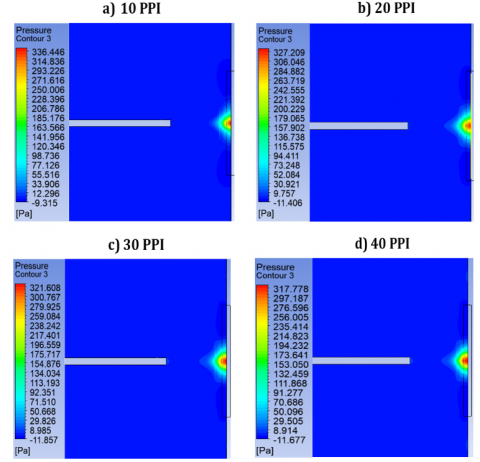
Figure 19 displays the distribution of total pressure on the central transverse plane of the copper foam flat surface with different PPI of copper foam at (Re = 9600 and z/b = 8). It was observed that the value of total pressure increases with the decreasing PPI of copper foam, while the pressure drops and increases with increasing PPI.
Figure 19. Total pressure distribution on the central transverse plane of the copper foam flat surface with various PPI of copper foam at (Re = 9600 and z/b = 8)
This work numerically studied the thermal characteristics of jet impingement on a copper foam flat surface. The test numerical illustrates the effect of the thickness of copper foam (t), the pore density for copper foam (PPI), the slot-to-plate distance, and the Reynolds number. In this work, t (mm) included 4, 8, 12; z/b varied from 2 to 8; PPI included 10, 20, 30, and 40; and Re varied from 5200 to 14000. The investigation reveals the following results:
•The thermal performance of a copper foam target surface, regardless of thickness and pore density, was almost 80% higher than that of a smooth target (no foam) in the case of jet impingement.
•Thin foam is the optimal configuration for higher heat dissipation than thick foam when testing three copper foam thickness configurations. The positive outcomes of this study are related to the applicability of thin foams in enhanced heat transfer research.
•A detailed analysis of the numerically obtained heat transfer indicates that the 10 PPI pore density copper foam subjected to slot jet impingement has the highest thermal performance compared to the copper foam with 20, 30, and 40 PPI pore density foams.
•The Nu of the smooth target surface has a small increase with the increment of the slot-to-plate distance.
•It was observed that there is no influence of slot-to-plate distances on the Nu of a copper foam target surface with a thickness of 8 mm. While the highest increase in the Nu for the copper foam target surface 4 mm thick appeared at z/b = 8, However, the highest increase in the Nu for the copper foam target surface 12 mm thick appeared at z/b = 2.
•It was found that the flow deflection of a copper foam target surface 12 mm thick is larger than that of a copper foam target surface 4 mm and 8 mm thick. Also, the jet velocity distribution along the flow direction of the copper foam target surface is not affected when the PPI of the copper foam is different.
•The effect of the total pressure on the copper foam flat surface 12 mm thick was lower compared to a copper foam flat surface 4 mm and 8 mm thick. While the effect of the total pressure increases with the decreasing PPI of copper foam.
|
b |
Width of the slot (m) |
|
c1, c2 |
Inertia resistance, viscous resistance |
|
$c_{1 \epsilon}, c_\mu, c_{2 \epsilon}$ |
Turbulent model constants |
|
dp |
Pore diameter (m) |
|
h |
Local convection heat transfer coefficient in (W/ m2 K) |
|
$\bar{h}$ |
Average convection heat transfer Coefficient in (W/ m2 K) |
|
kair |
Air thermal conductivity (W/m K) |
|
Keff |
Effective thermal conductivity (W/m K) |
|
Ksolid |
Solid thermal conductivity (W/m k) |
|
L |
Plate length (m) |
|
Ls |
Slot length (m) |
|
Nu |
Local Nusselt number |
|
$\overline{N u}$ |
Average Nusselt number |
|
P |
Pressure (Pa) |
|
PPI |
Pore per inch |
|
Re |
Reynolds number |
|
Tjet |
Temperature of jet (℃) |
|
Tw |
Temperature of wall (℃) |
|
Tf |
Temperature of a metal foam (℃) |
|
t |
Thickness of the base plate |
|
tf |
Thickness of a metal foam |
|
v |
Nozzle exit velocity (m/s) |
|
W |
Width of plate |
|
x |
Streamwise direction |
|
x/b |
Non-dimensional streamwise direction |
|
y |
Spanwise direction |
|
z |
Slot-to-plate distance |
|
z/b |
Non-dimensional slot-to-plate distance |
|
Greek symbols |
|
|
$\alpha$ |
Permeability,m2 |
|
$\beta$ |
Porosity |
|
$\epsilon$ |
Energy dissipation rate (m2. S−3) |
|
$\mu$ |
Fluid dynamic viscosity, N. s. m−2 |
|
Subscripts |
|
|
amb |
Ambient |
|
eff |
Effective |
|
f |
Metal foam |
|
p |
Pore |
|
s |
Slot |
|
w |
Wall |
[1] Nirmalkumar, M., Katti, V., Prabhu, S.V. (2011). Local heat transfer distribution on a smooth flat plate impinged by a slot jet. International Journal of Heat and Mass Transfer, 54(1-3): 727-738. https://doi.org/10.1016/j.ijheatmasstransfer.2010.09.030
[2] Joshi, J., Sahu, S.K. (2022). Heat transfer characteristics of flat and concave surfaces by circular and elliptical jet impingement. Experimental Heat Transfer, 35(7): 938-963. https://doi.org/10.1080/08916152.2021.1995082
[3] Dhruw, L., Kothadia, H.B. (2023). Experimental analysis of local and average heat transfer between circular impinging jet and flat plate. Experimental Heat Transfer, 36(1): 1-25. https://doi.org/10.1080/08916152.2022.2099036
[4] Attalla, M., Salem, M. (2013). Effect of nozzle geometry on heat transfer characteristics from a single circular air jet. Applied Thermal Engineering, 51(1-2): 723-733. https://doi.org/10.1016/j.applthermaleng.2012.09.032
[5] Caliskan, S., Baskaya, S., Calisir, T. (2014). Experimental and numerical investigation of geometry effects on multiple impinging air jets. International Journal of Heat and Mass Transfer, 75: 685-703. https://doi.org/10.1016/j.ijheatmasstransfer.2014.04.005
[6] Hwang, M.L., Yang, Y.T. (2012). Numerical simulation of turbulent fluid flow and heat transfer characteristics in metallic porous block subjected to a confined slot jet. International Journal of Thermal Sciences, 55: 31-39. https://doi.org/10.1016/j.ijthermalsci.2011.11.008
[7] Singh, P.K., Joshi, J., Sahu, S.K. (2024). Experimental investigation of metal foam embedded surface thermal characteristics using air-jet impingement with different orifice geometry. Experimental Heat Transfer, 1-25. https://doi.org/10.1080/08916152.2024.2353728
[8] Wang, J., Kong, H., Xu, Y., Wu, J. (2019). Experimental investigation of heat transfer and flow characteristics in finned copper foam heat sinks subjected to jet impingement cooling. Applied Energy, 241: 433-443. https://doi.org/10.1016/j.apenergy.2019.03.040
[9] Yogi, K., Krishnan, S., Prabhu, S.V. (2021). Experimental investigation on the local heat transfer with an unconfined slot jet impinging on a metal foamed flat plate. International Journal of Thermal Sciences, 169: 107065. https://doi.org/10.1016/j.ijthermalsci.2021.107065
[10] Singh, P., Nithyanandam, K., Zhang, M., Mahajan, R.L. (2020). The effect of metal foam thickness on jet array impingement heat transfer in high-porosity aluminum foams. Journal of Heat Transfer, 142(5): 052301. https://doi.org/10.1115/1.4045640
[11] Sambamurthy, V.S., Madhavan, S., Singh, P., Ekkad, S.V. (2020). Array jet impingement on high porosity thin metal foams: Effect of foam height, pore-density, and spent air crossflow scheme on flow distribution and heat transfer. Journal of Heat Transfer, 142(11): 112301. https://doi.org/10.1115/1.4047560
[12] Fu, W.S., Huang, H.C. (1997). Thermal performances of different shape porous blocks under an impinging jet. International Journal of Heat and Mass Transfer, 40(10): 2261-2272. https://doi.org/10.1016/S0017-9310(96)00320-1
[13] Shih, W.H., Chiu, W.C., Hsieh, W.H. (2006). Height effect on heat-transfer characteristics of aluminum-foam heat sinks. Journal of Heat and Mass Transfer, 128(6): 530-537. https://doi.org/10.1115/1.2188461
[14] Amori, K.E., Khalaf, D.A. (2015). Thermal analysis of metal foam heat sink subjected to impingement jet cooling. Iraqi Journal of Mechanical and Material Engineering, 15(1): 12-30.
[15] Sivasamy, A., Kanna, P.R., Selladurai, V. (2011). Jet impingement cooling of a horizontal surface in an unconfined porous medium: Mixed convection regime. International Journal of Heat and Mass Transfer, 54(17-18): 4127-4134. https://doi.org/10.1016/j.ijheatmasstransfer.2011.03.027
[16] Yogi, K., Krishnan, S., Prabhu, S.V. (2022). Influence of metal foam thickness on the conduction and convective heat transfer for a flat plate with metal foam impinged by a rectangular slot jet. International Journal of Thermal Sciences, 179: 107665. https://doi.org/10.1016/j.ijthermalsci.2022.107665
[17] Ezzat, A.W., Abdullah, N.N., Ghashim, S.L. (2017). Effect of air bubbles on heat transfer coefficient in turbulent convection flow. Journal of Engineering, 23(1): 8-28. https://doi.org/10.31026/j.eng.2017.01.02
[18] Amori, K.I., Adeeb, R.A. (2016). Absorber diameter effect on the thermal performance of solar steam generator. Journal of Engineering, 22(4): 127-146. https://doi.org/10.31026/j.eng.2016.04.09
[19] Jasim, S., Ezzat, A.W., Hu, E. (2023). Simulation and experimental investigation of performance and flow behavior for steam ejector refrigeration system. Journal of Engineering, 29(12): 13-38. https://doi.org/10.31026/j.eng.2023.12.02
[20] Issac, J., Singh, D., Kango, S. (2020). Experimental and numerical investigation of heat transfer characteristics of jet impingement on a flat plate. Heat and Mass Transfer, 56(2): 531-546. https://doi.org/10.1007/s00231-019-02724-9
[21] Ali, R.M.K., Ghashim, S.L. (2023). Numerical analysis of the heat transfer enhancement by using metal foam. Case Studies in Thermal Engineering, 49: 103336. https://doi.org/10.1016/j.csite.2023.103336
[22] Lin, W., Xie, G., Yuan, J., Sundén, B. (2016). Comparison and analysis of heat transfer in aluminum foam using local thermal equilibrium or nonequilibrium model. Heat Transfer Engineering, 37(3-4): 314-322. https://doi.org/10.1080/01457632.2015.1052682
[23] Wang, B., Hong, Y., Hou, X., Xu, Z., Wang, P., Fang, X., Ruan, X. (2015). Numerical configuration design and investigation of heat transfer enhancement in pipes filled with gradient porous materials. Energy Conversion and Management, 105: 206-215. https://doi.org/10.1016/j.enconman.2015.07.064
[24] Patankar, S. (2018). Numerical Heat Transfer and Fluid Flow. CRC Press. https://doi.org/10.1201/9781482234213
[25] Midhat, Y.F., Aljubury, I.M.A. (2023). Numerical simulation of the thermal performance of a tubular solar air heater. Journal of Engineering, 29(11): 143-166. https://doi.org/10.31026/j.eng.2023.11.09
[26] Yakkatelli, R., Wu, Q., Fleischer, A.S. (2010). A visualization study of the flow dynamics of a single round jet impinging on porous media. Experimental Thermal and Fluid Science, 34(8): 1008-1015. https://doi.org/10.1016/j.expthermflusci.2010.03.004