Jian Dong![]()
© 2023 IIETA. This article is published by IIETA and is licensed under the CC BY 4.0 license (http://creativecommons.org/licenses/by/4.0/).
OPEN ACCESS
With the growing prominence of environmental protection and energy efficiency issues, the improvement of energy efficiency and optimization of comfort in thermal systems have emerged as key research directions. Current studies often overlook the impact of multiple disturbance factors and employ oversimplified comfort modeling methods, along with inflexible automated control approaches. Addressing these challenges, this research delves into three critical aspects. Firstly, an energy efficiency analysis model for thermal systems is constructed, taking into account various disturbance scenarios, thereby enhancing the accuracy of system efficiency analysis. Secondly, a heat comfort modeling method driven by thermal data is proposed, better catering to user requirements. Lastly, an automated control method for thermal systems based on Fuzzy-PID control is implemented, elevating the precision and convenience of system control. These research outcomes hold significant theoretical and practical value in advancing the efficient operation and optimized control of thermal systems.
thermal systems, energy efficiency analysis, user heat comfort modeling, fuzzy-PID control, automated control
As societal focus intensifies on environmental protection and energy efficiency, the significant challenge of substantially enhancing the energy efficiency of thermal systems, while providing comfortable living and working environments, has emerged as a pivotal research topic [1-5]. Additionally, the complexity of the operational environment of thermal systems, influenced by multiple disturbance factors, presents a problem that necessitates efficient and stable operation [6, 7]. Thus, an in-depth study and optimization of automated control methods for thermal systems from a scientific and technological perspective are required [8, 9].
This research holds significant practical value in advancing the efficiency of thermal systems. Firstly, the development of an energy efficiency analysis model, incorporating various disturbance factors, facilitates a more precise evaluation of system operational efficiency. This approach lays a scientific foundation for system optimization [10-13]. Secondly, the adoption of a user heat comfort model, driven by thermal data, aligns more closely with user needs, thereby improving service quality [14-18]. Lastly, the application of automated control within thermal systems, utilizing Fuzzy-PID control, enhances the system's intelligence, enabling more accurate and user-friendly control mechanisms. However, existing methods for automated control of thermal systems often exhibit deficiencies and limitations. For instance, current energy efficiency analysis models tend to overlook the impact of multiple disturbance factors, leading to biased assessment results [19-22]. Similarly, existing methods for modeling thermal comfort are often oversimplified, failing to accurately reflect actual user needs [23-25]. Moreover, current automated control methods lack flexibility, struggling to effectively respond to complex and changing work environments.
Addressing these issues, this paper primarily focuses on three aspects. Firstly, an energy efficiency analysis model for thermal systems that considers multiple disturbance scenarios is constructed, enhancing the accuracy of system efficiency analysis. Secondly, a user heat comfort modeling method driven by thermal data is developed, increasing the satisfaction of user comfort. Lastly, an automated control method for thermal systems based on Fuzzy-PID control is implemented, improving the precision and convenience of system control. These research outcomes are of significant theoretical and practical value in advancing the efficient operation and optimized control of thermal systems.
The cycle thermal efficiency of generator sets is a key indicator for measuring their energy conversion efficiency, directly impacting the economic and environmental aspects of the generator sets. In practical operation, the cycle thermal efficiency of generator sets is influenced by various factors, including equipment condition, operational parameters, environmental conditions, and human operation. Changes in these factors can cause relative variations in the cycle thermal efficiency of the generator sets, thereby affecting their energy efficiency. Therefore, for the optimization and control of the energy efficiency of generator sets, an in-depth theoretical and technical study of these influencing factors is required. The development and optimization of automated control methods for thermal systems aimed at energy efficiency are designed to address this issue. By constructing an energy efficiency analysis model for thermal systems that considers multiple disturbance scenarios, a more accurate analysis and evaluation of the cycle thermal efficiency of generator sets can be achieved, allowing for the timely identification and adjustment of factors affecting energy efficiency, thereby enhancing the energy efficiency of the generator sets.
In the practical conditions of automated control of thermal systems, considering the system's complexity and dynamic nature, more refined and dynamic measurement indicators are needed. The cycle thermal efficiency and the relative change in cycle thermal efficiency are defined based on these requirements. In this paper, the cycle thermal efficiency is defined as the ratio of the effective work produced by the thermal system using the input heat energy to the total heat energy consumed over a certain period. This indicator reflects the energy conversion efficiency of the thermal system under actual working conditions and is an important parameter for measuring system energy efficiency. The relative change in cycle thermal efficiency is defined as the relative difference between the actual value of the cycle thermal efficiency over a certain period and its theoretical value under standard conditions, and it is an important parameter for measuring changes in the energy efficiency of the thermal system.
Let the cycle thermal efficiency be represented by λy=B/W, where B denotes the internal power of the generator set, and W denotes the cycle heat absorption of the unit. Taking the natural logarithm of both sides of the cycle thermal efficiency and then differentiating, the definition of the relative change in cycle thermal efficiency can be obtained:
$\frac{d \lambda_y}{\lambda_y}=\frac{d B}{B}-\frac{d W}{W}$ (1)
Figure 1. Automation control system of a 300MW thermal power system
Figure 1 presents the automation control system of a 300MW thermal power system. In actual thermal system automation control, the operational conditions of the system are influenced by various factors, which may include environmental conditions, equipment status, and operational methods. These changing factors can impact the energy efficiency of the system, leading to variability and uncertainty in both the system's operational conditions and its energy efficiency. Therefore, to more accurately describe and analyze the changes in the energy efficiency of the thermal system, it is necessary to introduce an indicator that reflects the impact of these disturbance factors, namely the intensity coefficient. The intensity coefficient is an indicator characterizing the effect of disturbance factors on the rate of change per physical unit of the system. By incorporating the intensity coefficient, the impact of various disturbance factors can be quantified, thereby more directly reflecting the extent of these factors' influence on system energy efficiency. Combining other equipment internal power differential formulas and cycle heat dissipation differential formulas, the above equation can be organized as follows:
$\frac{d \lambda_y}{\lambda_y}=\left[j_G+j_F+j_W\right] d Z$ (2)
where,
$j_G=\left[-\frac{1}{W} \frac{1}{B}-\eta_0 \eta_0\right]\left[\begin{array}{l}\left.\nabla G_n\right|_z \Gamma F_n \\ \left.\nabla G_y\right|_z \Gamma F_y \\ \left.\nabla S\right|_z \Gamma F \\ \left.\nabla \pi\right|_z \Gamma H\end{array}\right]$ (3)
$j_F=\left[\eta-\frac{1}{W} G_n \eta_0 \pi \frac{1}{B} G_y\right]\left[\begin{array}{c}\left.\nabla F_0\right|_Z \\ \left.\nabla F_{n d}\right|_Z \\ \left.\nabla F_{d q}\right|_z \\ \left.\nabla F_{y d}\right|_Z\end{array}\right]$ (4)
$j_W=-\left[\eta_0 \frac{1}{W} U\right] \cdot\left[\begin{array}{c}\left.\nabla W\right|_Z \\ \left.\nabla W_n\right|_Z\end{array}\right]$ (5)
$\left.\eta_0\left(\frac{G_n}{W}-\frac{G_y}{B}\right) \nabla F_\beta\right|_F \cdot S^{-1}$ (6)
$\left.\nabla F_\beta\right|_F=\left[\begin{array}{cccc}0 & 0 & \cdots & 0 \\ 1 & 0 & \cdots & 0 \\ 1 & 1 & \ddots & \vdots \\ \vdots & \vdots & \ddots & 0 \\ 1 & 1 & \cdots & 1\end{array}\right]_{(b+1) \times b}$ (7)
$\eta=\frac{1}{B} G_y-\frac{1}{W} G_n+\left[\eta_0 \pi 0\right]$ (8)
By replacing S with S' and π with π' in the above formula, it can be used for energy efficiency analysis of thermal systems where the system structure has changed. In practical automated control of thermal systems, to achieve efficient operation, an ideal operational condition is often set as the target. This ideal condition is the target operational state of the unit. At this target state, the system's operational parameters (such as temperature, pressure, etc.) are set to their optimum levels to achieve the highest energy efficiency. As can be inferred from the formula, the intensity coefficient, an indicator reflecting the impact of disturbance factors on the rate of change per physical unit of the system, is determined only by the conditions prior to the disturbance. This is because the system parameters under ideal conditions are fixed, and the calculation of the intensity coefficient is based on these parameters. Therefore, when the system is at its ideal state, the variation pattern of the intensity coefficient also has a certain predictability, meaning its variation pattern is consistent with the change pattern of the ideal state. Thus, if the condition before the disturbance is chosen as the ideal operational state of the unit, then the intensity coefficient under this condition can be considered an inherent attribute of the unit.
Traditional energy efficiency analysis models often consider only a single disturbance factor, failing to accurately reflect the changes in energy efficiency under actual operational conditions. A unified model can consider the complexity of multiple disturbances, more accurately reflecting the changes in energy efficiency under actual conditions, thereby enhancing the accuracy of the energy efficiency analysis. Furthermore, through the unified model, the complex problem of multiple disturbances can be transformed into the task of calculating and analyzing the intensity coefficient, simplifying the process of energy efficiency analysis and improving its efficiency. Therefore, this paper further introduces the concepts of absolute intensity coefficient and relative intensity coefficient, constructing the most generalized unified model for the analysis of multi-disturbance energy efficiency in thermal systems of generator sets.
Let J=jG+jF+jW, then Eq. (2) can be written as:
$\frac{d \lambda_y}{\lambda_y}=J d Z$ (9)
where, J=[J1,J2,...,Jw], each element Ju(u=1~w) corresponds to elements dZu(u=1~w) in the disturbance matrix dZ, In this paper, it is defined as the intensity coefficient of Zu on dλy/λy. The absolute intensity coefficient introduced here focuses on the impact of disturbance factors on the entire system and thus needs to be dimensioned. In this paper, it is assumed that each element Zu of the disturbance matrix Z is dimensioned, meaning the intensity coefficient Ju with dimensions is defined as the absolute intensity coefficient. The absolute intensity coefficient indicates the degree of impact of disturbance factors on the overall energy efficiency change of the thermal system. It reflects the ratio between the rate of change in system energy efficiency and the rate of change in disturbance factors under the influence of these factors.
The relative intensity coefficient, on the other hand, indicates the degree of impact of disturbance factors on the energy efficiency change of a particular part or process within the thermal system. It reflects the ratio between the rate of change in energy efficiency of that part or process and the overall system energy efficiency rate under the influence of the disturbance factors. This means that the element ju(u=1~w) of j is the intensity coefficient that reflects the impact on dλy/λy when the disturbance factor is the relative quantity zu(u=1~w), and it characterizes the change in dλy/λy for every 1% change in the disturbance factor zu. If dZu is replaced by dzu=dZu/Zu and let dz= [dz1dz2... dzw], and if Ju is replaced by ju=JuJu and let j=[j1j2... jw], then the equation can be expressed as:
$\frac{d \lambda_y}{\lambda_y}=j d j$ (10)
By incorporating both absolute and relative intensity coefficients into the energy efficiency analysis model, a unified model that considers the impact of multiple disturbances is formed. In this model, the absolute and relative intensity coefficients represent the degree of impact of each disturbance factor on the system's overall energy efficiency and the energy efficiency of a specific part or process, respectively. The larger their values, the greater the impact of the disturbance factor on energy efficiency. Assuming that the change in auxiliary steam water flow is represented by dZu, then replacing dZu with fz0u=fZu/F0 and defining dz0=[dz01dz02...dz0w], and replacing Ju with j0u=JuF0 and defining j0=[j01j02 ... j0w], Eq. (9) can further be converted to:
$\frac{d \lambda_y}{b_y}=j^0 d z^0$ (11)
The element j0u(u=1~w) of j0 is defined as the intensity coefficient reflecting the impact on dλy/λy when the disturbance factor is the relative quantity z0u(u=1~w), which is the relative F0 intensity coefficient. It is used to characterize the change in dλy/λy for every 1% change in z0u.
Through the unified model, a comprehensive and accurate analysis of energy efficiency changes under actual operational conditions can be conducted. Firstly, based on the actual operational conditions and the changes in disturbance factors, the absolute and relative intensity coefficients for each disturbance factor can be calculated. Further, based on these intensity coefficients, the degree of impact of each disturbance factor on the system's overall energy efficiency and the energy efficiency of a specific part or process can be analyzed, identifying the primary factors influencing energy efficiency changes. Finally, based on the analysis, the main disturbance factors affecting system energy efficiency and the extent of their impact can be determined. With this information, the thermal system can be optimized and adjusted to achieve optimal energy efficiency. These optimization and adjustment measures specifically include changing operational settings, adjusting control strategies, and optimizing equipment configuration.
Thermal comfort refers to people's comfort perception of environmental temperature, directly influencing their work efficiency and quality of life. In many scenarios, such as in offices, residential buildings, and shopping malls, people's comfort perception of environmental temperature is particularly important. As thermal systems are the primary means of regulating the temperature in these places, improving thermal comfort through the enhancement of automated control methods in thermal systems is a problem of significant practical importance.
An important factor to be considered in the automated control of thermal systems is the user's thermal comfort. In practice, this often involves adjusting various environmental parameters (such as indoor temperature and humidity) to meet users' comfort requirements. However, each user's perception of thermal comfort may vary, necessitating individualized modeling of each user's thermal comfort perception. Based on actual user feedback data, this paper models users' thermal comfort through a data-driven approach, aiming to derive each user's probability distribution curve of thermal comfort at different indoor environmental temperatures. The key to this modeling method lies in abstracting users' thermal comfort perception into a quantifiable probability distribution model and determining the model's parameters by fitting actual user data. Specifically, users' thermal comfort perception is categorized into three types: too cold, too hot, and comfortable. Then, a multi-class logistic regression model, namely the softmax regression model, is used to model the probability distribution of these three types of thermal comfort perceptions under different environmental temperatures. The softmax regression model is a multi-class model that extends the binary logistic regression model. For each environmental temperature, the model outputs a probability distribution representing the probabilities of the three types of thermal comfort perceptions at that temperature. The model's parameters are estimated by maximizing the log-likelihood of the training data, meaning the model strives to fit the actual feedback data of users, making the predicted probability distribution of thermal comfort perceptions as consistent with the actual data as possible.
The binary logistic regression model is a statistical model widely used in binary classification problems. In this paper, this model is utilized to predict whether users will feel comfortable at a given indoor environmental temperature. The basic assumption of this model is that users' comfort perception can be predicted through a set of influencing factors, and this prediction process can be described by a logistic function.
User feedback data on comfort levels at different indoor environmental temperatures, along with other factors that may affect comfort, are collected. Suppose the training sample consists of b labeled data points, denoted as {(zb,tb)}. Here, the input feature zu∈Eb, and the class label tu∈{0,1}. The following expression provides the conditional probability distribution that the binary logistic regression model needs to satisfy:
$O(t=1 \mid z)=\frac{\exp (\varphi \cdot z+n)}{1+\exp (\varphi \cdot z+n)}$ (12)
$O(t=0 \mid z)=\frac{1}{1+\exp (\varphi \cdot z+n)}$ (13)
Parameter estimation is a crucial step in the establishment of the binary logistic regression model. This paper estimates the model's parameters by maximizing the log-likelihood function of the data. Let:
$O(t=1 \mid z)=g_{\varphi}(z)$ (14)
$O(t=0 \mid z) 1-g_{\varphi}(z)$ (15)
Combining the above two equations yields:
$O(t \mid z ; \varphi)=\left(g_{\varphi}(z)\right)^t\left(1-g_{\varphi}(z)\right)^{(1-t)}$ (16)
Considering l independently distributed training samples, the likelihood function expression can be obtained as shown in the following equation:
$\begin{aligned} & M(\varphi)=o(\vec{t} \mid Z ; \varphi)=\prod_{u=1}^l o\left(t^{(u)} \mid z^{(u)} ; \varphi\right) =\prod_{u=1}^l o\left(g_{\varphi}\left(z^{(u)}\right)\right)^{t(u)}\left(1-g_{\varphi}\left(z^{(u)}\right)\right)^{u-t^{(u)}}\end{aligned}$ (17)
To simplify calculations, this paper opts for the log-likelihood function shown in the following equation:
$\begin{aligned} & \ell(\varphi)=\log M(\varphi) =\sum_{u=1}^l \log g\left(z^{(u)}\right)+\left(1-t^{(u)}\right) \log \left(1-g\left(z^{(u)}\right)\right)\end{aligned}$ (18)
This paper addresses a three-category problem of feeling too cold, too hot, and comfortable. Therefore, for the training set {(z1,t1),(z2,t2),...,(zb,tb)}, there is tu∈[1,2,3]. Thus, the probability distribution of different thermal comfort perceptions of users under different thermal conditions O(Ayg|Yub) can be calculated through the following equation:
$\begin{aligned} & O\left(A_{y g} \mid Y_{u b}\right)=\left[\begin{array}{c}o\left(A_{y g}=1 \mid Y_{u b}^{(u)} ; \varphi\right) \\ o\left(A_{y g}=2 \mid Y_{u b}^{(u)} ; \varphi\right) \\ o\left(A_{y g}=3 \mid Y_{u b}^{(u)} ; \varphi\right)\end{array}\right] =\frac{1}{\sum_{k=1}^3 e^{\left(\varphi_{k 0}+\varphi_{k 1} Y_{u b}\right)}}\left[\begin{array}{l}e^{\left(\varphi_{10}+\varphi_{11} Y u b\right)} \\ e^{\left(\varphi_{20}+\varphi_{21} Y u b\right)} \\ e^{\left(\varphi_{30}+\varphi_{31} Y u b\right)}\end{array}\right]\end{aligned}$ (19)
Assuming that a vector φ is subtracted from the parameter vector ϕk of the softmax regression model, the above equation can be adjusted as:
$\begin{aligned} & o\left(A_{y g}=k \mid Y_{u b} ; \varphi\right)=\frac{e^{\left(\varphi_k-\phi\right)^T Y_{u b}^{(u)}}}{\sum_{j=1}^3 e^{\varphi_j-\phi^T Y_{u b}^{(u)}}} =\frac{e^{\varphi_k^T Y_{u b}^{(u)}} e^{-\phi^T Y_{t b}^{(u)}}}{\sum_{j=1}^3 e^{\varphi_j^T Y_{u b}^{(u)}} e^{-\phi^T Y u b^{(u)}}}=\frac{e^{\left(\varphi_k\right)^T Y_{t b}^{(u)}}}{\sum_{j=1}^3 e^{\varphi_j^T Y_{u b}^{(u)}}}\end{aligned}$ (20)
In the automated control of thermal systems, particularly in real-time control environments, computational efficiency is a critical factor. Complex models may require longer computation times, affecting the response speed of the control system. By transforming the model, the structure can be simplified, reducing the number of parameters or changing the form of parameters to reduce or eliminate issues of multiple solutions. This enhances the robustness and predictive accuracy of the model. It also reduces computational burden, improving the system's response speed and efficiency, which is particularly important for real-time control. When φ=ϕ2, this paper substitutes ϕ2 with ϕ2-φ=0⟶, resulting in the following transformed equation:
$\begin{aligned} & g_{\varphi}\left(z^{(u)}\right)=\frac{1}{1+e^{\left(\varphi_1-\varphi_2\right)^Y z^{(u)}}+e^{\left(\varphi_3-\varphi_2\right)^Y z^{(u)}}}\left[\begin{array}{c}e^{\left(\varphi_1-\varphi_2\right)^Y z^{(u)}} \\ 1 \\ e^{\left(\varphi_3-\varphi_2\right)^Y z^{(u)}}\end{array}\right] =\frac{1}{1+e^{\alpha_1^Y z^{(u)}}+e^{\alpha_3^Y z^{(u)}}}\left[\begin{array}{c}e^{\alpha_1^Y z^{(u)}} \\ 1 \\ e^{\alpha_3^Y z^{(u)}}\end{array}\right]\end{aligned}$ (21)
$o\left(A_{y g}=2 \mid Y_{u b} ; \alpha\right)=\frac{1}{1+e^{\left(\alpha_{10+} \alpha_{11} Y_{u b}^{(u)}\right)}+e^{\left(\alpha_{30+} \alpha_{31} Y_{u b}^{(u)}\right)}}$ (22)
In the field of automated control for thermal systems, Fuzzy-PID controllers amalgamate the benefits of fuzzy logic control and traditional PID control, adapting to complex and variable operational conditions. Such controllers are particularly apt for handling systems that are challenging to accurately describe with traditional mathematical models. Figure 2 illustrates the process flow of the thermal system automated control method proposed in this paper. Based on the multi-disturbance scenario energy efficiency analysis model for thermal systems and the heat data-driven user thermal comfort model, the specific principles and steps of Fuzzy-PID control implementation are as follows:
Firstly, deploy high-precision sensors, such as temperature, humidity, flow meters, and pressure sensors, at key locations to capture the system's comprehensive state in real-time. Utilize a data collection system to ensure accurate and timely data reception from all sensors, completing real-time data stream processing. Implement real-time data monitoring to rapidly identify and respond to any abnormal behavior in the system, enabling threshold alert setting and automatic diagnosis of system issues. Consider various methods for determining initial PID parameters, including empirical formulas, system identification methods, or data analysis based on previous cases. Conduct pre-adjustment trials before the system operation, using laboratory tests or simulations to determine the optimal initial parameter settings.
Furthermore, when designing fuzzy rules, it's essential to consider the specific needs and characteristics of the system. For thermal systems requiring high-speed responses, more proactive adjustment strategies may be needed. In formulating rules, consider users' thermal comfort and changes in environmental conditions, such as seasonal variations and room usage. Define precise membership functions for each input and output variable. These functions describe how to convert actual values into fuzzy values, such as "temperature too high," "temperature moderate," and "temperature too low." Conduct sensitivity analysis to determine the impact of different membership functions on system performance. Consider dynamically adjusting the membership functions over time and with changing system conditions to maintain the flexibility and adaptability of the controller.
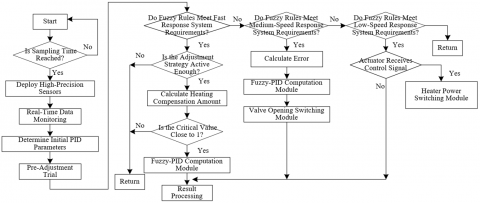
Then, convert the fuzzy inference results into precise PID parameter adjustment values. Implement a real-time adjustment mechanism to quickly modify PID parameters based on the output of the fuzzy logic controller. This means that the controller can respond in real-time to system performance, optimizing control effects. Set upper and lower limits for PID parameter adjustments to prevent excessive regulation that could destabilize the system. This includes setting upper and lower limits for the proportional, integral, and differential gains. Through appropriate adjustment strategies, avoid system oscillation and overshooting. This may require fine-tuning of the fuzzy rules to ensure smooth system transitions. Figure 3 presents the structure diagram of the Fuzzy-PID controller, while Figure 4 shows the control program flowchart for the automated control system of the thermal system.
Figure 2. The process flow of the proposed automated control method for thermal systems
Figure 3. Structure diagram of the Fuzzy-PID controller
Assuming the system deviation, cumulative deviation, and rate of change of deviation are represented by r(j), Σjk=0r(k), rv(j) respectively, the proportional coefficient is represented by Jo, the integral coefficient by Ju=JoY/Yu, and the differential coefficient by Jf=JoY/Yf. The following equation provides the positional formula description for the conventional PID controller:
$\begin{aligned} & i(j)=j_o\left\{r(j)+\frac{Y}{Y_u} \sum_{k=0}^j r(k)+\frac{Y_f}{Y}[r(j)-r(j-1)]\right\} =J_o r(j)+J_u \sum_{k=0}^j r(k)+J_f r v(j)\end{aligned}$ (23)
The Fuzzy-PID controller can be regarded as performing real-time online tuning of the three correction parameters ΔJo, ΔJu, ΔJf of the PID controller in the above formula, based on the pre-set PID parameters and utilizing fuzzy rules. At the same time, the parameters J'o+ΔJo, J'u+ΔJo, J'f+ΔJf are used as the real-time parameters ΔJo, ΔJf, ΔJu of the controller. The adjusted PID parameters are then converted into specific control commands, such as adjusting valve openings or modifying heater power. It is crucial to ensure that control commands are rapidly and accurately conveyed to each actuator, such as valves, pumps, fans, etc. Considering the physical characteristics and response times of the actuators, ensure that the implementation of control commands is not hindered by the limitations of the actuators.
Figure 4. Control program flowchart for the automated control system of the thermal system
This paper constructs an energy efficiency analysis model for thermal systems that considers multiple disturbance scenarios, thereby enhancing the accuracy of system energy efficiency analysis. By introducing intensity coefficients, the impact of various disturbance factors is quantified, more vividly reflecting the degree of their influence on system energy efficiency. From Table 1, it is evident that for different disturbance parameter items in the thermal system, including input/output temperature, pressure, and humidity, the calculated values using the method presented in this paper show relative errors of less than 1% compared to manufacturer data. Notably, the relative error for input/output temperature is the smallest, at only 0.0851%. This indicates that the model developed in this study can yield highly accurate results in energy efficiency analysis under these disturbance conditions. This high degree of accuracy is attributed to the introduction of intensity coefficients to quantify the impact of various disturbance factors. Such quantification allows for a more intuitive assessment and comparison of the impact of each disturbance factor on system energy efficiency. This not only aids in more accurately understanding and predicting the system's energy efficiency but also provides an important basis for optimizing control strategies.
Table 1. Impact of various disturbance parameter changes on the energy efficiency of the thermal system
|
|
Parameter Change |
Manufacturer Data |
Calculated value by the Proposed Method |
Relative Error % |
|
Input/Output Temperature |
-11 |
-0.002789 |
-0.002784 |
0.0851 |
|
Pressure |
0.82 |
0.00354518 |
0.00323682 |
0.4215 |
|
Humidity |
-5 |
-0.001236487 |
-0.001236 |
0.56892 |
Table 2. Absolute intensity coefficients for different disturbance parameter changes in the thermal system
|
Load |
Input/Output Temperature |
Pressure |
Humidity |
|
100% |
0.004258 |
0.0002745 |
0.000224 |
|
75% |
0.00512 |
0.000214 |
0.000235 |
|
50% |
0.00735 |
0.000125 |
0.000327 |
Figure 5. Absolute disturbance intensity spectrum of different disturbance parameters in the thermal system
Table 2 displays the absolute intensity coefficients for changes in the input/output temperature, pressure, and humidity parameters under different load conditions in the thermal system. A larger intensity coefficient indicates a greater impact of that parameter on the system's energy efficiency. From the table, it is evident that at all load levels, the absolute intensity coefficient for input/output temperature is the highest, signifying that input/output temperature is the primary factor affecting the energy efficiency of the thermal system. In contrast, the impact of pressure and humidity is relatively smaller. Additionally, it is observed that as the system load decreases, the absolute intensity coefficient for input/output temperature gradually increases, indicating that under conditions of lower load, the impact of input/output temperature on system energy efficiency is more pronounced. Conversely, the absolute intensity coefficients for pressure and humidity decrease as the system load decreases, suggesting that at higher loads, pressure and humidity have a more significant impact on system energy efficiency. These conclusions are derived from calculations using the model constructed in this study, demonstrating the model's effectiveness and practicality. Utilizing this model not only enables accurate analysis of the impact strength of each parameter on system energy efficiency but also facilitates further exploration of how to adjust these parameters under different loads to optimize system energy efficiency.
Via analyzing the absolute disturbance intensity spectrum of different disturbance parameters in the thermal system as shown in Figure 5, the following conclusions can be drawn. Among all the disturbance parameters, the absolute intensity coefficient of input/output temperature is the highest, indicating that input/output temperature is the most critical factor affecting the energy efficiency of the thermal system. Whether at 100%, 75%, or 50% thermal load, the impact of input/output temperature on system energy efficiency is more significant than that of pressure and humidity. As the thermal load decreases (from 100% to 50%), the absolute intensity coefficient of input/output temperature gradually increases, suggesting that temperature has a more sensitive impact on system energy efficiency at lower loads. This might be because the system's operating point moves further away from the designed operating point at lower loads, making temperature changes more impactful on system efficiency. For pressure and humidity, it’s observed that as the load decreases, the absolute intensity coefficient of pressure tends to decline, while that of humidity shows an increasing trend. This might reflect the different impact effects of various disturbance parameters on system energy efficiency at different loads. The length variations of the blue, red, and green bars in the figure also demonstrate the difference in the impact weight of disturbance parameters under different load conditions, providing valuable guidance for the optimization and adjustment of the thermal system. These analytical results highlight the effectiveness of the model constructed in this paper, demonstrating that the model can identify key control parameters in the thermal system and clearly present their specific impacts on system energy efficiency. This provides an important basis for further system optimization and the formulation of control strategies.
By analyzing the trend graph of the absolute intensity coefficients for disturbance parameters in the thermal system as shown in Figure 6, the following conclusions can be drawn: In terms of input/output temperature, the blue line indicates that the absolute intensity coefficient of input/output temperature significantly increases as the load decreases. This means that under lower load conditions, fluctuations in temperature have a more significant impact on system energy efficiency. This could be due to the system being more sensitive to temperature changes at lower loads, making the control of input/output temperature particularly crucial for maintaining energy efficiency in system operations. In terms of pressure, the red line shows that the absolute intensity coefficient of pressure slightly decreases with the reduction in load, suggesting that the impact of pressure on system energy efficiency does not vary greatly under different load conditions. Nevertheless, it can still be observed that the impact of pressure on system energy efficiency slightly diminishes as the load decreases. In terms of humidity, the green line indicates that the absolute intensity coefficient of humidity increases as the load decreases, similar to the trend observed for input/output temperature. This may imply that the impact of humidity on system energy efficiency becomes more pronounced under low load conditions. These trends demonstrate that the impact of different disturbance parameters on the energy efficiency of thermal systems varies significantly under different load conditions. The energy efficiency analysis model for thermal systems developed in this paper can accurately reflect this variation, demonstrating its effectiveness. This is crucial for the operation and control of thermal systems, as this information can be used to optimize operational parameters, ensuring efficient operation of the thermal system under various conditions.
In Table 3, data is provided showing the minimum and maximum temperatures different users find thermally comfortable. Thermal comfort is defined within the range [-0.5, 0.5], likely representing a standardized rating, where 0 indicates complete comfort, negative numbers may denote feeling too cold, and positive numbers feeling too warm. The temperature ranges accepted by users indicate that each person’s comfort temperature band varies. Analyzing the data in the table, it's observable that different users have varying tolerances for the lowest and highest temperatures regarding thermal comfort. For instance, User 9 can tolerate a lower temperature range (23.10℃ - 25.10℃), while User 8 and User 10 can tolerate higher temperature ranges (User 8: 25.70℃ - 27.10℃, User 10: 24.10℃ - 27.10℃). This variation reflects the personalized nature of user thermal comfort. The diversity of data in the table suggests that using a standard, non-personalized control strategy (such as setting a fixed temperature range to satisfy all users) might not meet the needs of some users. Therefore, the effectiveness of the method proposed in this study lies in its ability to intelligently adjust system settings to meet each individual's unique needs by analyzing and modeling different users' thermal comfort data, thereby enhancing the overall level of comfort. Through this approach, thermal systems can not only improve user satisfaction but also increase energy efficiency.
Figure 6. Absolute intensity coefficient trend for different disturbance parameters in the thermal system when disturbed
Figure 7. Step response curves of fuzzy-PID control vs. conventional PID control
Table 3. User thermal comfort temperature data information
|
User Number |
Thermal Comfort Range |
Minimum Temperature |
Maximum Temperature |
|
1 |
[-0.5,0.5] |
25.10 |
27.10 |
|
2 |
[-0.5,0.5] |
24.60 |
26.60 |
|
3 |
[-0.5,0.5] |
25.20 |
26.60 |
|
4 |
[-0.5,0.5] |
25.10 |
26.60 |
|
5 |
[-0.5,0.5] |
24.40 |
26.60 |
|
6 |
[-0.5,0.5] |
25.20 |
26.10 |
|
7 |
[-0.5,0.5] |
25.10 |
27.40 |
|
8 |
[-0.5,0.5] |
25.70 |
27.10 |
|
9 |
[-0.5,0.5] |
23.10 |
25.10 |
|
10 |
[-0.5,0.5] |
24.10 |
27.10 |
Figure 8. Room comfort comparison under different control methods
Analyzing the step response curves provided in Figure 7, a distinct difference can be observed in the dynamic responses of the system under Fuzzy-PID control (blue line) and conventional PID control (red line). The rise time for the Fuzzy-PID control appears shorter than that of conventional PID control, indicating that with Fuzzy-PID, the system reaches the desired output level more quickly. The overshoot of the Fuzzy-PID control is less than that of the conventional PID control, suggesting better stability of the system output under Fuzzy-PID control, with a quicker recovery to a stable state after overshooting. Additionally, the settling time for the system under Fuzzy-PID control is shorter than with conventional PID control, meaning the system reaches and maintains the steady-state value in less time. Both control methods eventually reach the same steady-state value, exhibiting minimal steady-state error, and their performances in terms of steady-state error appear similar. The comparative analysis of the curves demonstrates the superior performance of Fuzzy-PID control in the automated control of thermal systems, especially in terms of speeding up the stabilization process and reducing overshoot. This validates the effectiveness of the Fuzzy-PID control method proposed in this study. The inclusion of fuzzy logic control, capable of handling uncertainties and non-linear characteristics, allows for real-time adjustment of PID controller parameters, adapting to the dynamic changes in thermal systems. This improvement is particularly beneficial for thermal systems requiring fast response and high stability, effectively enhancing the precision and convenience of system control.
In the room comfort comparison chart shown in Figure 8, the thermal comfort index at different time points under Fuzzy-PID control aimed at enhancing energy efficiency and comfort (blue line) and conventional PID control aimed at enhancing comfort (red line) is observed. The following conclusions can be drawn:
The trend of the Fuzzy-PID control (blue line) generally remains near the central line around "0," indicating that users feel more comfortable most of the time. This suggests that the Fuzzy-PID control method is relatively better at maintaining an ideal level of comfort. In contrast, the trend of conventional PID control (red line) shows more fluctuations over time and deviates further from the "0" comfort center line at certain points, potentially indicating more discomfort due to temperature variations for the users.
Compared to conventional PID control, the Fuzzy-PID control method exhibits smaller fluctuations and faster response times. Particularly in situations where the system faces external disturbances or requires quick adjustments, it can recover to comfortable levels more swiftly. Based on these observations, it can be concluded that the Fuzzy-PID control method proposed in this study is more effective in maintaining room comfort compared to the conventional PID control method. Due to its inherent fuzzy logic component, the Fuzzy-PID control can flexibly adjust control strategies when dealing with nonlinear, complex, or uncertain system behaviors, thus providing a more stable and comfortable environment. Therefore, this method is significant in enhancing the precision and convenience of automated control in thermal systems.
This paper successfully constructs an energy efficiency analysis model for thermal systems that considers multiple disturbance factors, incorporating both absolute and relative intensity coefficients to quantify the impact of various disturbances. This model demonstrates higher predictive and analytical accuracy compared to traditional methods under different operational conditions and disturbances, thereby proving its effectiveness. This aids in identifying key parameters affecting system energy efficiency and provides a robust tool for optimizing control of thermal systems.
The heat data-driven user thermal comfort modeling method developed in this paper effectively captures users' comfort perceptions in different indoor temperature environments. Through data analysis, the model can be tailored to match each user's thermal comfort needs, significantly enhancing user comfort satisfaction. This approach meets the demand for personalized comfort control and exhibits superior performance compared to generalized settings.
The automated control method for thermal systems based on Fuzzy-PID control, as proposed in the paper, shows better performance than conventional PID control, particularly in terms of rapid response, accuracy, and system stability. Fuzzy-PID control, with real-time adjustment of control parameters through fuzzy logic, responds more quickly and adjusts better to system disturbances, enhancing the precision of system control and simplifying the control process.
In summary, this research contributes three main advancements to the field of automated control for thermal systems: an energy efficiency analysis model considering the impact of multiple disturbances, a personalized modeling method based on user thermal comfort data, and an improved Fuzzy-PID control strategy. Combined, these three areas of research not only enhance thermal system energy efficiency and user comfort but also improve the overall performance of system control, demonstrating clear practicality and innovation.
[1] Sayad, B., Alkama, D., Rebhi, R., Kidar, A., Lorenzini, G., Ahmad, H., Menni, Y. (2021). Enhanced outdoor thermal comfort through natural design technique: In-situ measurement and microclimate simulation. Instrumentation Mesure Métrologie, 20(3): 131-136. https://doi.org/10.18280/i2m.200302
[2] Kaddour, A., Bezari, S., Tearnbucha, C., Sudsutad, W., Lorenzini, G., Ahmad, H., Menni, Y. (2022). Simulation investigation of natural ventilation on the thermal comfort in arid regions: Case Ghardaïa. International Journal of Design & Nature and Ecodynamics, 17(1): 9-15. https://doi.org/10.18280/ijdne.170102
[3] Salameh, M., Touqan, B. (2023). Comparative analysis of thermal conditions and comfort between modern and traditional districts in Hot-Arid Climate: Case study in Ajman-UAE. International Journal of Computational Methods and Experimental Measurements, 11(3): 169-180. https://doi.org/10.18280/ijcmem.110306
[4] Chen, Y., Feng, G., Chen, H., Gou, L., He, W., Meng, X. (2023). A multi-objective honey badger approach for energy efficiency enhancement of the hybrid pressure retarded osmosis and photovoltaic thermal system. Journal of Energy Storage, 59: 106468. https://doi.org/10.1016/j.est.2022.106468
[5] Wu, M., Zhang, J., Wu, J., Sun, L. (2023). Dynamic energy efficiency optimization of photovoltaic/thermal integrated heat pump system based on economic model predictive control. Proceedings of The Chinese Society of Electrical Engineering 43(6): 2119-2129.
[6] Nattappan, A., Ganesan, S.P., Thiagarajan, V., Ranganathan, K. (2022). Design of automation control thermal system integrated with parabolic trough collector based solar plant. Thermal Science, 26(2Part A): 947-954.
[7] Gibson, J.D., Porter, D., Goble, W. (2016). Automation and control of the MMT thermal system. In Software and Cyberinfrastructure for Astronomy IV, 9913: 599-613. https://doi.org/10.1117/12.2231062
[8] Tverskoy, Y.S., Gaydina, Y.A., Pertsev, A.V. (2023). About control systems of gas-oil power units. Power Technology and Engineering, 57(1): 90-97. https://doi.org/10.1007/s10749-023-01627-4
[9] Ferrarini, L., Pernice, M. (2009). Modeling and control of a thermal energy system in a building automation scenario. In 2009 7th IEEE International Conference on Industrial Informatics, Cardiff, UK, pp. 238-243. https://doi.org/10.1109/INDIN.2009.5195810
[10] Park, H., Lee, J., Lim, J., Cho, H., Kim, J. (2022). Optimal operating strategy of ash deposit removal system to maximize boiler efficiency using CFD and a thermal transfer efficiency model. Journal of Industrial and Engineering Chemistry, 110: 301-317. https://doi.org/10.1016/j.jiec.2022.03.004
[11] Ren, J., Liu, Y. (2020). Operating efficiency optimal control algorithms of flue gas denitrification system in thermal power plant. In Proceedings of the 2020 International Conference on Cyber Security Intelligence and Analytics (CSIA 2020), Haikou, China, pp. 628-632. https://doi.org/10.1007/978-3-030-43309-3_90
[12] Dal Magro, F., Jimenez-Arreola, M., Romagnoli, A. (2017). Improving energy recovery efficiency by retrofitting a PCM-based technology to an ORC system operating under thermal power fluctuations. Applied Energy, 208: 972-985. https://doi.org/10.1016/j.apenergy.2017.09.054
[13] Ahn, B.L., Park, J.W., Yoo, S., Kim, J., Jeong, H., Leigh, S.B., Jang, C.Y. (2015). Synergetic effect between lighting efficiency enhancement and building energy reduction using alternative thermal operating system of indoor LED lighting. Energies, 8(8): 8736-8748. https://doi.org/10.3390/en8088736
[14] Wu, Y., Cao, B., Zhu, Y. (2023). Development of an automatic personal comfort system (APCS) based on real-time thermal sensation prediction. Building and Environment, 246: 110958. https://doi.org/10.1016/j.buildenv.2023.110958
[15] Vivek, T., Balaji, K. (2023). Heat transfer and thermal comfort analysis of thermally activated building system in warm and humid climate-A case study in an educational building. International Journal of Thermal Sciences, 183: 107883. https://doi.org/10.1016/j.ijthermalsci.2022.107883
[16] Wang, S., Zhang, S., Cheng, H., Yuan, K., Song, Y., Han, F. (2023). Reliability indices and evaluation method of integrated energy system considering thermal comfort level of customers. Automation of Electric Power Systems, 47(1): 86-95. https://doi.org/10.7500/AEPS20211028003
[17] Egeli, D., Oner, E., Seckin, A.C., Seckin, M. (2022). Development of a novel thermal mannequin system for thermal comfort measurements. Journal of Biomimetics, Biomaterials and Biomedical Engineering, 57: 89-96. https://doi.org/10.4028/p-l1p3kn
[18] Xie, X., Xia, F., Zhao, Y.Q., Xu, B., Wang, Y.L., Pei, G. (2022). Parametric study on the effect of radiant heating system on indoor thermal comfort with/without external thermal disturbance. Energy, 249: 123708. https://doi.org/10.1016/j.energy.2022.123708
[19] Yan, C., Yao, W., Cui, Y., Sun, K., Wen, J., Guo, R.. (2022). Small disturbance stability analysis of wind-thermal coupling system considering virtual inertia and droop control. Electric Power Automation Equipment, 42(8): 19-28.
[20] He, X., Wang, X., Zhao, Z., Zhang, S. (2019). Disturbance rejection and vibration control for a floating ocean thermal energy conversion system. Acta Automatica Sinica, 45(10): 1846-1856. https://doi.org/10.16383/j.aas.c180197
[21] Zhang, R., Ma, L., Ma, Y., Liang, Y., Geng, L. (2016). Active disturbance rejection control of thermal power unit coordinated system based on frequency domain analysis. TELKOMNIKA (Telecommunication Computing Electronics and Control), 14(1): 162-170. https://doi.org/10.12928/TELKOMNIKA.v14i1.2746
[22] Bi, Y., Liu, T., Zhao, L., Li, X., Gu, Y. (2018). DC additional damping control of subsynchronous oscillation based on improved active disturbance rejection control for wind-thermal-bundled power system. Electric Power Automation Equipment, 38(11): 174-180.
[23] Aryal, A., Becerik-Gerber, B. (2020). Thermal comfort modeling when personalized comfort systems are in use: Comparison of sensing and learning methods. Building and Environment, 185: 107316. https://doi.org/10.1016/j.buildenv.2020.107316
[24] Pirotti, F., Piragnolo, M., D’Agostini, M., Cavalli, R. (2022). Information technologies for real-time mapping of human well-being indicators in an urban historical garden. Future Internet, 14(10): 280. https://doi.org/10.3390/fi14100280
[25] Ma, N., Chen, L., Hu, J., Perdikaris, P., Braham, W. W. (2021). Adaptive behavior and different thermal experiences of real people: A Bayesian neural network approach to thermal preference prediction and classification. Building and Environment, 198: 107875. https://doi.org/10.1016/j.buildenv.2021.107875