Oussama Benhacene*![]() | Rachid Boucetta
| Rachid Boucetta![]()
© 2023 IIETA. This article is published by IIETA and is licensed under the CC BY 4.0 license (http://creativecommons.org/licenses/by/4.0/).
OPEN ACCESS
Wax deposition in crude oil pipelines is a significant challenge that escalates under turbulent flow conditions. This phenomenon is initiated by the cooling of crude oil during its conveyance, causing wax constituents to solidify and adhere to the pipeline walls via molecular diffusion. This study embarks on an investigation of the impact of fluid flow velocity on wax accumulation in pipelines transporting heavy, viscous, and wax-laden fluids, such as crude oil. A rigorous exploration of this behavior was conducted, intertwining fundamental principles from fluid dynamics, heat transfer, and mass transport. The resultant complex governing equations were tackled utilizing numerical approaches. Our findings reveal a notable trend: an acceleration in fluid flow speed prompts an increase in pipeline wax deposition. The outcomes of this study bear substantial implications for pipeline management and construction, underlining the necessity to account for flow velocity to optimize operations, minimize maintenance, and promote cost-effective transportation of heavy, viscous fluids. This research initiates a critical conversation on the role of flow velocity in wax deposition, opening avenues for future investigations and potential mitigation strategies.
wax deposit, turbulent flow, upward flow in pipelines, molecular diffusion, heat transfer
The transport of waxy and viscous fluids through pipelines, particularly within industrial settings such as oil production networks and transportation pipelines, often results in the pervasive issue of pipeline blockages. Wax deposition in pipelines is a formidable challenge within the oil and gas industry, as it can lead to significant production delays and equipment damage due to blockage-induced issues.
This predicament has spurred researchers to delve into the study of wax deposition during the transportation process [1, 2]. The scrutiny of wax deposition encompasses a range of approaches, including experimental studies that investigate the characteristics of wax, such as the temperature at which wax deposition occurs and the thickness of the deposition layer [3, 4].
In a seminal study by Jessen and Howell [5], experimental research was conducted on paraffin deposition and the velocity of the liquid during the transition phase where it begins to decrease. This observation was attributed to a higher mass transfer coefficient correlating with more effective flow rates and the influence of material retention on corrosion. Two mechanisms of sedimentation were also proposed: the deposition of paraffin crude oil on the pipeline wall through molecular diffusion, and particle transfer onto the wall. It was observed that molecular distribution serves as the primary mechanism of deposition.
Further, Hunt [6] carried out an experimental study that scrutinized the growth mechanism of the paraffin layer through molecular diffusion.
Brown et al. [7] employed a flow apparatus to validate the hypothesis that in the absence of heat flux, no paraffin deposition occurs. Their studies led to the conclusion that shear dispersion does not contribute to paraffin deposition, and only molecular diffusion was modeled as a deposition mechanism.
Theab [8] facilitated an experimental study aimed at assessing the volume of paraffin deposits. The investigation encompassed multiple factors influencing the paraffin deposition process, including crude oil temperature, flow rate, pressure loss, oil viscosity, and duration. The study utilized four distinct techniques to estimate the thickness of the paraffin deposits: pressure drop measurements, scraping techniques, heat transfer analysis, and liquid displacement level detection (LD-LD). A strategy rooted in spiral flow was proposed to alleviate paraffin deposition in pipelines.
Wei et al. [9] utilized a "cold finger" setup to investigate paraffin deposition under tubular flow conditions. They quantified various parameters such as the deposition of paraffin in relation to temperature, temperature differentials between the crude oil and the wall, deposition time, and the rotation speed of the "cold finger". The results demonstrated a deposition rate ranging from 0.35 g/h over an 8 to 24-hour period, with a peak deposition rate of 0.26 g/h observed at a rotation speed of 90 rotations per minute. Following these experimental investigations, theoretical work and simulations have been pursued to address the complex equations governing paraffin deposition. A significant contribution in this realm was made by Svendsen [10], who performed a comprehensive mathematical analysis of the sedimentation problem in both open and closed pipe systems. The distribution of deposits as a function of time was determined through the resolution of mass-energy conservation equations and the application of Fick's law of diffusion.
In their comprehensive study, Boucetta and Kessal [11] executed a detailed mathematical analysis of the deposition problem. The influence of paraffin porosity on flow parameters was investigated, with a specific focus on the thickness of the paraffin deposit, the longitudinal temperature distribution, and the evolution of the flow rate. They discerned that porosity plays a significant role in the growth of the deposited paraffin layer.
Mehrotra et al. [12] developed and validated a heat transfer approach for studying paraffin deposition in pipelines, using laboratory data for validation. Multicomponent paraffin blends and solvent samples containing n-alkanes were used in their study. The mathematical model they developed eliminates the need for adjustable parameters or 'tuning', as all properties and parameters could be estimated using available prediction methods and correlations. They provided numerical predictions for variations in deposit thickness as a function of changes in numerous parameters, including oil temperature, ambient or coolant temperature, heat transfer coefficient for oil flow, inner radius of the pipeline, average thermal conductivity of the deposit, thermal conductivity of the pipeline wall, thermal conductivity of the insulation, and the crystallization temperature of the paraffin.
Numerical simulation has been utilized to predict wax buildup in petroleum pipelines, based on various parameters such as temperature, pressure, flow rate, pipe surface roughness, and chemical composition [13]. The outcomes of such numerical studies can aid in optimizing the operational conditions of the pipelines, thereby mitigating the risk of blockages due to paraffin. The Wax Appearance Temperature (WAT) is used to measure the temperature at which a wax sample transitions from a solid to a liquid state. This measurement is crucial for determining the viscosity of waxes at different temperatures and consequently, for determining the suitability of wax for specific applications. Waxes with higher WATs are suitable for applications that necessitate higher melting temperatures.
To comprehend the rheology of crude oil and the deposition of solids, it is imperative to accurately determine the amount of wax precipitated at a given temperature and the Wax Appearance Temperature (WAT) [14]. These measurements are, therefore, considered critical in this field of study.
Building on the work of Singh et al. [14] and Elphingstone et al. [15], Ramirez-Jaramillo et al. [16] developed and assessed a pipeline wax deposition model. The simulation outcomes of the model indicated that radial mass diffusion, induced by a concentration gradient resulting from a temperature gradient, was responsible for pipeline wax deposition. The authors inferred that both the Reynold numbers and the mass Peclet number significantly affect the mass deposition rate.
It was observed that the solid deposition rate in pipelines exhibited a steep increase with the Reynolds number. However, a decrease in mass deposition was noticed when Re>2000, a phenomenon attributed to the increased shear forces acting on the deposited layer at higher Reynolds numbers. These forces were said to remove the deposit on the pipeline wall at a certain point, consequently decreasing the deposit's thickness. The researchers also highlighted a significant relationship between the mass Peclet number and the radial mass flux when estimating the average molecular dilution coefficient. Moreover, a noteworthy correlation was observed between the thickness of the deposited mass layer and the calculated average diffusion coefficient.
Modeling the formation and growth of deposits may necessitate the integration of various factors, including thermodynamics, the equilibrium between solid and liquid phases, heat transfer, fluid dynamics, and the characteristics of the pipeline surface, among others [17, 18]. To explain wax deposition, the primary mechanisms utilized thus far have been molecular diffusion and heat transfer.
A prevailing theory of wax deposition in tubes, attributing it to molecular diffusion, was first proposed by Huang et al. [19]. This process is characterized by the movement of wax in its liquid phase towards the tube wall. When oil within the pipeline undergoes cooling, a radial temperature gradient is formed in the fluid. Consequently, the liquid near the cooling wall reaches a lower temperature than the bulk liquid, which potentially precipitates wax crystals from the solution if the temperature in a certain region falls below the cloud point of that specific oil type. This leads to the liquid phase reaching equilibrium with the solid phase, possibly culminating in wax deposition on the tube wall.
In a recent study, Boucetta et al. [20] undertook numerical investigations to predict the temporal and spatial distribution of porous wax deposits during laminar flow in a tube. By analyzing the wax deposit concentration along a short axial length, a peak concentration was revealed at X/L=0.014. This concentration remained invariant when both the wax and the tube were porous.
This paper delves into two fundamental facets of wax deposition in pipeline systems. The first facet scrutinizes whether the cooling of crude oil in pipelines with turbulent flow could induce wax deposition on the pipeline walls via molecular diffusion. The second facet probes whether escalating the velocity of oil flow within pipelines could exacerbate wax deposition on the pipeline walls by fostering increased contact between the oil and the pipeline surface. To address these inquiries, a comprehensive review of extant research on wax deposition in pipeline walls is conducted, focusing particularly on the influence of the diffusion mechanism within turbulent flow. Various factors known to impact the wax deposition process, such as flow rate, pressure, temperature, and heat transfer coefficient, are considered. Key findings from recent research studies are examined and their implications for the oil industry are discussed. The ultimate aim is to deepen the understanding of this complex phenomenon and contribute valuable insights towards the development of more efficient and reliable pipeline systems, with a particular emphasis on the hydrodynamic aspects of wax deposition.
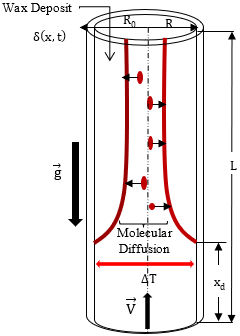
The mathematical model can be used to quantitatively evaluate the properties of wax deposition in pipelines (Figure 1). The model combines two approaches: the energy and momentum balance equations and the molecular diffusion model.
Figure 1. Schematic of the problem
2.1 Momentum balance equation
The momentum equation for Newtonian, incompressible, unsteady single-phase fluid flow, and taking into account the radial deposit thickness repartition (d=2[R-δ]) can be written as:
$\frac{d p}{d x}=-f \frac{\rho Q^2}{4 \pi^2(R-\delta)^5}$ (1)
where, f=(x,t) is the shear friction factor, R is the pipe radius and ρ the constant fluid density.
Integrating both sides of Eq. (1) and by introducing the following dimensionless parameters
$\begin{aligned} \delta^* & =\delta / R \\ x^* & =x / R \\ L^* & =L / R\end{aligned}$
where, then re-expressed using these dimensionless parameters
$\Delta p=p_{\text {in }}-p_{\text {atm }}-\rho g H=\frac{\rho Q^2}{4 \pi^2 R^4} \int_0^{L^*} \frac{f}{\left(1-\delta^*\right)^5} d x^*$ (2)
The term pin represents the pressure at the inlet, while patm denotes the atmospheric pressure at x=L. H is the length of the pipe. The equation can be re-expressed as follows:
$Q(t)=2 \pi R^2 \sqrt{\frac{\Delta p}{\rho}} \frac{1}{\sqrt{\int_0^{L^*} \frac{f}{\left(1-\delta^*\right)^5} d x^*}}$ (3)
When 1200 <Re<100000 flow is considered to be turbulent smooth. The friction factor (f) in this case can be determined using the Blasius equation, which is given by:
$f=0.316 \operatorname{Re}^{-0.25}$ (4)
The initial values can be utilized to determine the flow rate by means of the following mathematical expression.
$\frac{Q}{Q_0}=\frac{1}{\int_0^ {L^*} \frac{f}{1-\delta^*}} \sqrt{\frac{0.316 L^*}{\operatorname{Re}_0^{0.25}}}$ (5)
The pressure variation along the pipe's length is denoted by the subsequent equation:
$P^*=\frac{\operatorname{Re}_0^{0.25}}{0.316 \mathrm{~L}^*}\left(\frac{Q}{Q_0}\right)^2 \int_{x^*}^{L^*} \frac{f}{1-\delta^*} d x$ (6)
2.2 Energy balance equation
The energy balance equation is a statement of the conservation of energy in a physical system, which relates the energy input and output of the system, taking into account any internal energy conversions.
$\rho Q c \frac{d T}{d x}=2 \pi R U\left(T_e-T\right)$ (7)
The provided equations define the heat transfer coefficient (U) for a system involving convection on both the interior and exterior of the pipe, with conduction through the pipe wall and the paraffin layer. The calculation of U takes into account parameters such as specific heat capacity (c), external medium temperature (Te), and other relevant variables.
$U=\left[\frac{R}{R_o} \frac{1}{h_e}+\frac{R}{k_w} \ln \left(\frac{R_o}{R}\right)+\frac{R}{k_d} \ln \left(\frac{1}{1-\delta^*}\right)+\left(\frac{1}{1-\delta^*}\right) \frac{1}{h_{\mathrm{i}}}\right]^{-1}$ (8)
The radius of the pipe is represented by Ro, the exterior and internal convective heat transfer coefficients are represented by he and hi, and the thermal conductivity of the pipe and paraffin layer is represented by kw and kd, respectively. Table 1 provides the thermal conductivities of both the fluids and the deposited paraffin layer
The dimensionless form of Eq. (8) is as follows:
${{U}^{*}}=\frac{UR}{{{k}_{i}}}={{\left[ \frac{2}{N{{u}_{e}}}(\frac{{{k}_{i}}}{{{k}_{e}}})+\frac{{{k}_{i}}}{{{k}_{w}}}\ln (\frac{{{R}_{o}}}{R})+\frac{{{k}_{i}}}{{{k}_{d}}}\ln (\frac{1}{1-{{\delta }^{*}}})+\frac{2}{N{{u}_{i}}} \right]}^{-1}}$ (9)
Given that the flow is turbulent and L/D (ratio of pipe length to pipe diameter) is assumed to be large, the Dittus-Boelter correlation can be applied:
$N{{u}_{i}}=\frac{{{h}_{i}}}{{{k}_{i}}}2R\left( 1-{{\delta }^{*}} \right)=0.023{{\operatorname{Re}}^{0.8}}{{\Pr }^{0.3}}$ (10)
To calculate the average heat-transfer coefficient for crossflow over a cylindrical surface:
$N{{u}_{e}}=\frac{2{{R}_{o}}{{h}_{e}}}{{{k}_{e}}}=0.3+\frac{0.62{{\operatorname{Re}}^{1/2}}{{\Pr }^{1/3}}}{{{\left[ 1+{{(0.4/\Pr )}^{2/3}} \right]}^{1/4}}}{{\left[ 1+{{(\frac{\operatorname{Re}}{282000})}^{5/8}} \right]}^{4/5}}$ (11)
Using dimensionless parameters and integrating Eq. (10) yields the following result:
$\theta =\frac{T-{{T}_{e}}}{{{T}_{i}}-{{T}_{e}}}=\exp \left[ -\frac{2\pi R{{k}_{i}}}{\rho Qc}\int_{0}^{{{x}^{*}}}{{{U}^{*}}}d{{x}^{*}}^{^{^{'}}} \right]$ (12)
The temperature distribution along the length can be expressed as:
$\theta =\exp \left[ -\frac{4}{P{{e}_{0}}Q/{{Q}_{0}}}\int_{0}^{{{x}^{*}}}{{{U}^{*}}}d{{x}^{*}}^{^{^{'}}} \right]$ (13)
We can define the dimensionless cloud point, Reynolds number, and Peclet number as:
$\begin{aligned} \theta_c & =\frac{T_c-T_e}{T_i-T_e} \\ R e & =\frac{2 \rho Q}{\mu \pi R} \\ P e & =\frac{2 \rho Q c}{\pi R k_i}\end{aligned}$ (14)
2.3 The layer of deposit wax
Using oil production, lost heat causes dissolved wax in crude oil to precipitate as the temperature falls below the WAT. Molecular diffusion of wax particles occurs due to a concentration gradient between the bulk fluid and the pipe wall, resulting in the formation of a wax deposit on the wall. Fick's molecular diffusion law governs the rate of wax transport, according to the law [12]:
${{j}_{{{i}^{'}}}}=\left\{ \begin{align}
& 0,si0\le x<{{x}_{d}}; \\
& \\
& -D\frac{d{{\rho }_{s}}}{dT}\mathop{|}_{{{i}^{'}}}\frac{\partial T}{\partial r}\mathop{|}_{{{i}^{'}}},si\underset{{}}{\mathop{{{x}_{d}}\le x\le L.}}\, \\
\end{align} \right.$ (15)
ρS refers to solubility calculated at "Ti," which is the interface of the phase change, and D is the coefficient of the molecular diffusivity.
Burger et al. [1] suggested that this coefficient is inversely proportional to viscosity.
$D=\frac{{{C}_{1}}}{\mu }$ (16)
The equilibrium between the local temperature gradient at the solid-liquid interface, denoted by ∂T/∂r|i’, and other relevant factors, is known as the following processing
$2\pi (R-\delta )dx{{k}_{i}}\frac{\partial T}{\partial r}\left| _{_{_{{{_{i}}^{'}}}}} \right.=-2\pi RdxU(T-{{T}_{e}})$ (17)
where, we find
$\frac{\partial T}{\partial r}\left| _{_{_{_{{{i}^{'}}}}}} \right.=-\frac{{{U}^{*}}}{1-{{\delta }^{*}}}\frac{{{T}_{i}}-{{T}_{e}}}{R}\theta $ (18)
To fully mathematically describe the current problem, an equation is necessary to represent the deposit thickness, denoted as δ∗(x, t). This equation is linked to the mass flux equation at the interface of phase change and can be written as shown in Ribeiro et al. [21]:
${{j}_{i}}={{\rho }_{d}}\frac{\partial \delta (x,t)}{\partial t}$ (19)
ρd the density of the paraffin deposit.
One way to express the thickness of the deposit is by combining Eqs. (15), (18) and (19) to obtain an equation, which can be stated as follows:
$\frac{\partial {{\delta }^{*}}}{\partial {{t}^{*}}}=\left\{ \begin{align}
& 0,si0\le {{x}^{*}}<x_{d}^{*}; \\
& \\
& \frac{{{S}^{*}}{{U}^{*}}}{(1-{{\delta }^{*}})}\theta ,si\underset{{}}{\mathop{x_{d}^{*}\le {{x}^{*}}\le {{L}^{^{*}}}.}}\, \\
\end{align} \right.$ (20)
The FORTRAN code was designed to solve equations related to energy, momentum, and molecular diffusion, taking into account the initial and boundary conditions specified in Table 1. The arithmetic domain is divided into a unified grid, and the code uses the fourth-order Runge-Kutta method to solve these equations. The numerical approach algorithm can be summarized as follows:
• Adjust initial conditions for pressure, temperature and thickness of paraffin deposits.
• Study the equations of energy, momentum, and molecular diffusion using the Runge-Kutta method of the fourth degree.
• Updated pressure, temperature and thickness of paraffin deposits at each time step.
• Check the convergence criteria and adjust the time step size if necessary.
• Repeat steps 4 through 6 until the desired level of accuracy is achieved or the maximum number of time steps is reached.
• Extract variable values such as final pressure, temperature and thickness of paraffin deposits.
Table 1. Data and average properties used [12]
|
Property |
Value |
|
Crude oil |
|
|
Flow rate Q |
0.0148 m3/s |
|
Specific-heat capacity ci |
2400 J/kg.K |
|
Thermal conductivity ki |
0.15 W/m.K |
|
Viscosity μi |
10-2 Pa.s |
|
Density ρi |
750 kg/m3 |
|
Pipeline |
|
|
wall thermal conductivity kw |
24 W/m.K |
|
Inside diameter Di |
0.0254 m |
|
Wall thickness (Ro-R) |
0.0159 m |
|
Outside diameter D0 |
0.286 m |
|
Seawater |
|
|
Specific-heat capacity Ce |
4200 J/kg.K |
|
Thermal conductivity ke |
0.65 W/m.K |
|
Viscosity μi |
10-3 Pa.s |
|
Density ρi |
1020 kg/m3 |
|
Deposit |
|
|
Thermal conductivity kd |
0.24 W/m.K |
In the following sections, we present and analyze the impact of Reynolds number (6000≤Re0≤30000) and Peclet number (960000≤Pe0≤4800000) on the evolution of paraffin thickness, temperature, the overall heat transfer coefficient, deposition onset point, pressure along the pipeline and variation of flow rate.
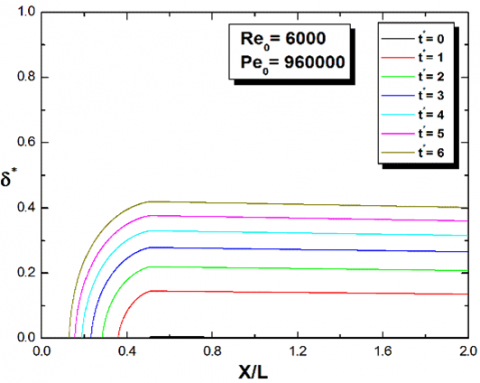
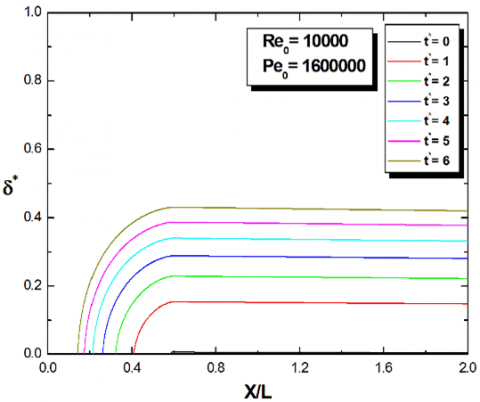
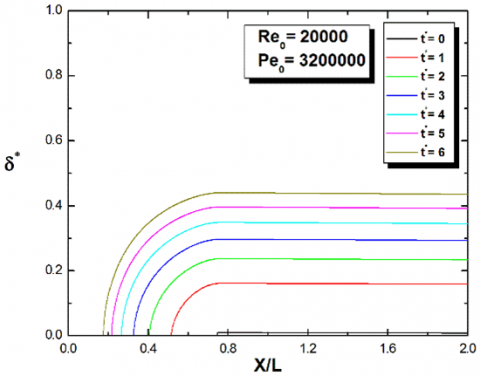
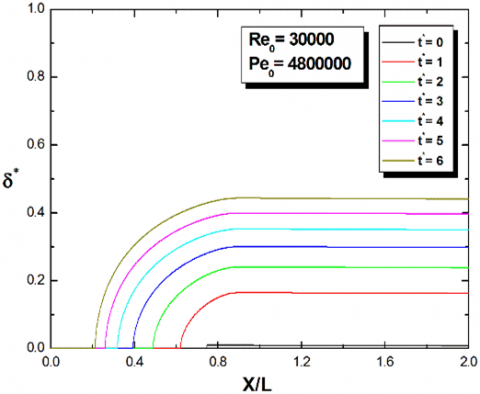
Figures 2, 3, 4, and 5 show the variation of the wax deposition thickness as a function of the dimensionless length of the pipeline for Reynolds numbers Re0=6000, 10000, 20000, and 30000, and Peclet numbers on the order of Pe0=960000, 160000, 320000, and 4800000. For the high value of the Peclet number (Pe0=4800000), it is observed that the deposited paraffin layer covers a significant length compared to that of the smaller Peclet value (Pe0=960000). This can be explained by the fact that if the Peclet number is small, the fluid flow is relatively slow, and forced convection is weak. If the flow velocity is relatively low, the fluid cools down quickly, but the amount of deposited wax is minimal. On the other hand, it is also noteworthy that when the Peclet number is high, the fluid velocity is high, and therefore the heat transfer by forced convection increases, causing the fluid to cool over a long distance. This allows many paraffin crystals to appear, precipitating onto the pipeline wall under the influence of molecular diffusion, resulting in a significant amount of wax deposition in this case. As the Peclet number increases from Pe0=960000 to 4800000 at t*=6, a 6.18% increase in the deposit thickness is observed.
Physically, the phenomenon of (forced) convection predominates.
We have plotted the evolution of the deposition onset point (Xd/L) as a function of time (Figure 6). This point evolves in the opposite direction of the flow.
Figure 2. Longitudinal distribution of paraffin thickness
Figure 3. Longitudinal distribution of paraffin thickness
Figure 4. Longitudinal distribution of paraffin thickness
Figure 5. Longitudinal distribution of paraffin thickness
Figure 6. Evolution of the deposition onset point (Xd/L)
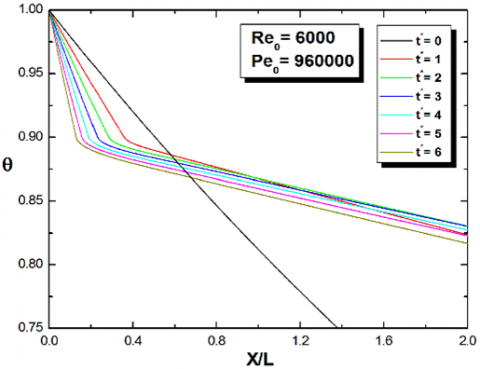
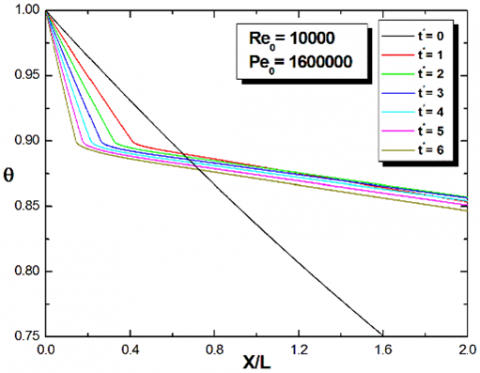
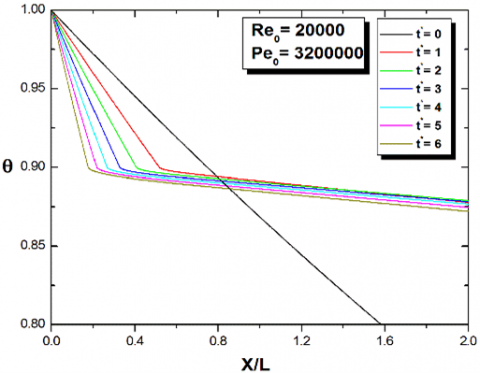
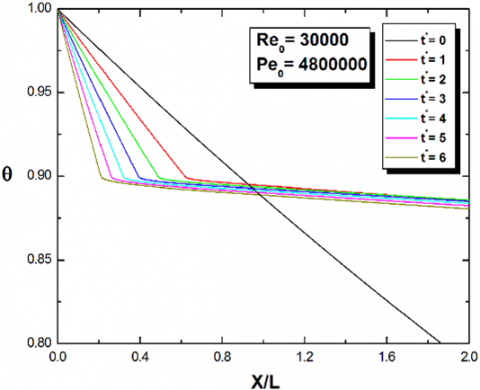
Considering molecular diffusion as the primary mechanism of wax deposition formation, we have plotted the variation of temperature as a function of the dimensionless length of the pipeline for Reynolds numbers Re0=6000, 10000, 20000, and 30000, and Peclet numbers on the order of Pe0=960000, 160000, 320000, and 4800000, as shown in Figures 7, 8, 9, and 10. We can observe a sharp decrease in temperature with distance. Indeed, for a Peclet number of Pe0 = 960000, the fluid velocity will be low, resulting in a relatively slow flow and rapid cooling of the fluid, leading to a rapid drop in temperature until reaching the crystallization temperature, where paraffin crystals will appear at the pipeline inlet. These crystals migrate towards the wall under a high-temperature gradient in that region, forming a paraffin layer. On the other hand, for a high Peclet number (Pe0=4800000), the flow velocity will also be high, and consequently, the cooling of the fluid occurs more slowly, allowing for a more significant amount of wax deposition. This deposition will occupy a long distance within the pipeline. These wax deposits can cause partial or total obstruction of the pipelines, resulting in a slowdown or even a halt in production.
Figure 7. Longitudinal temperature distribution
Figure 8. Longitudinal temperature distribution
Figure 9. Longitudinal temperature distribution
Figure 10. Longitudinal temperature distribution
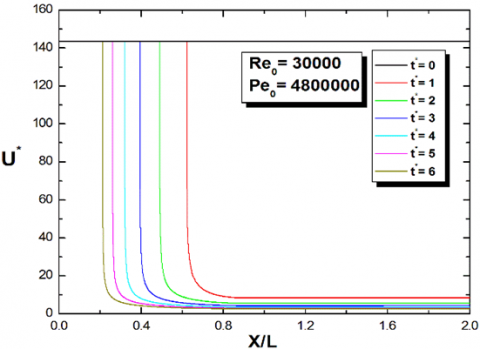
Similarly, Figures 11, 12, 13, and 14 show the variation of the overall heat transfer coefficient as a function of the dimensionless length of the pipeline. The comparison between the four figures for different values of the Peclet number clearly demonstrates the effect of this number. The heat transfer coefficient decreases over time and with increasing Peclet number. However, higher Peclet numbers correspond to lower heat transfer coefficient. At the point of maximum deposit thickness, as time increases from t*=0 to t*=6, a 94.45% reduction in the heat transfer is observed at Pe=960000. When the Peclet number increases from Pe0=960000 to Pe0=4800000, the heat transfer coefficient decreases by 5.26% at t*=6.
Figure 11. Longitudinal distribution of the overall heat transfer coefficient
Figure 12. Longitudinal distribution of the overall heat transfer coefficient
Figure 13. Longitudinal distribution of the overall heat transfer coefficient
Figure 14. Longitudinal distribution of the overall heat transfer coefficient
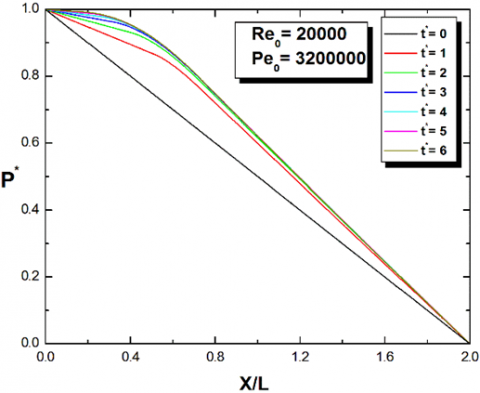
Figure 15. Longitudinal distribution of pressure
Figure 16. Longitudinal distribution of pressure
Figure 17. Longitudinal distribution of pressure
Figure 18. Longitudinal distribution of pressure
Figures 15, 16, 17, and 18 show the longitudinal variation of pressure for different values of the Peclet number. A pressure drop in the pipeline space can be observed, which may result in insufficient product transportation. This is likely due to the amount of deposited paraffin, which reduces the effective diameter of the pipeline and causes an increase in flow resistance. These paraffin deposits can create obstructions that limit the fluid flow, leading to a pressure drop along the pipeline. This situation may require cleaning and maintenance actions to ensure the efficient operation of the fluid transport system.
In Figure 19, on the plot of the variation of flow rate with dimensionless time for Reynolds numbers on the order of Re0=6000, 10000, 20000, and 30000, we can observe a decrease in flow rate over time, and this decrease is due to the growth of the thickness of the wax deposition. The influence of the Reynolds number on the evolution of the flow rate is slight because when this number is increased, the amplitude of the paraffin layer deposited on the wall varies weakly. However, the deposited paraffin layer covers a very long distance and a significant length.
Figure 19. Variation of flow rate with dimensionless time
While this study primarily considers molecular diffusion as the main wax deposition mechanism, it is important to note that several other mechanisms such as shear stripping, shear dispersion, Brownian diffusion, and gravity settling), can significantly influence the simulation of the deposition process. As a result, it is highly recommended to expand the current model for future research in the field.
The present study aimed to provide insights for better predicting the issue of paraffin deposition in pipelines during the transportation of a viscous fluid laden with paraffin, as well as to develop an appropriate numerical tool. We proposed using molecular diffusion as the mechanism responsible for the creation of the deposits, as commonly suggested in the literature. Molecular diffusion is characterized by a temperature gradient primarily driving the paraffin deposition phenomenon.
This study considered the upward turbulent flow of a viscous fluid laden with paraffin in a pipeline, with a detailed analysis of heat and mass transfer phenomena. A hydrodynamic model based on this qualitative approach was developed and numerically implemented. This model represents a subtle coupling between flow dynamics, heat transfer equation, and mass transfer represented by Fick's equation. Here are the primary results of the current study:
This study provides useful insights for researchers and engineers working with turbulent flow conditions. However, the model's limitations warrant necessary refinements to encompass all crucial deposition phenomena. Proposed modifications will enhance the model's accuracy for targeted flow conditions.
|
c |
specific heat capacity, J.kg−1 .K−1 |
|
C1 |
Adjusting parameter for fitting experimental data, kg.m/s2 |
|
f |
Local friction factor |
|
g |
Gravitational acceleration, m/s2 |
|
he |
External convective heat transfer coefficient, W/m2⋅K |
|
hi |
Internal convective heat transfer coefficient, W/m2⋅K |
|
H |
Tube height, m |
|
ji |
Diffusion mass flux, kg/s⋅m2 |
|
kw |
wall thermal conductivity, W/m.K |
|
ki |
internal fluid thermal conductivity, W/m⋅K |
|
ke |
external fluid thermal conductivity, W/m⋅K |
|
kd |
thermal conductivity of the deposited layer, W/m⋅K |
|
L* |
dimensionless tube length |
|
L |
tube length, m |
|
md |
deposit mass, kg |
|
Nui |
internal Nusselt number |
|
Nue |
external Nusselt number |
|
Pr |
Prandtl number |
|
pat |
atmospheric pressure, Pa |
|
p* |
dimensionless Pressure |
|
pi |
inlet pressure, Pa |
|
p |
pressure, pa |
|
Pe0 |
initial Peclet number |
|
Pe |
peclet number |
|
Q |
flow rate, m3/s |
|
Q0 |
initial flow rate, m3/s |
|
r |
radial coordinate, m |
|
Ro |
radius of the outer tube, m |
|
R |
radius of the inner tube, m |
|
Re |
Reynolds number |
|
Re0 |
Initial Reynolds number |
|
S |
solubility coefficient, kg/m3⋅K |
|
S* |
dimensionless solubility coefficient |
|
t* |
dimensionless time |
|
t |
time, s |
|
Te |
temperature of external environment, K |
|
Ti |
oil inlet temperature, K |
|
Tc |
cloud point, K |
|
T |
oil bulk temperature, K |
|
U* |
imensionless overall heat transfer coefficient |
|
U |
overall heat transfer coefficient, W/m2⋅K |
|
v |
velocity, m/s |
|
x d* |
dimensionless clean tube length |
|
xd |
clean tube length, m |
|
x* |
dimensionless axial coordinate |
|
x |
axial coordinate, m |
|
Greek symbols |
|
|
δ∗ |
dimensionless deposited thickness |
|
δ |
deposited thickness, m |
|
θ |
dimensionless temperature |
|
θc |
dimensionless cloud point |
|
ρ |
fluid mass density, kg/m3 |
|
Δp |
overall pressure differential, Pa |
|
Δp0 |
initial overall pressure differential, Pa |
|
ρs |
solubility, kg/m |
|
μ |
viscosity, Pa⋅s |
|
ρd |
deposit mass density, kg/m3 |
[1] Burger, E.D., Perkins, T.K., Striegler, J.H. (1981). Studies of wax deposition in the trans alaska pipeline. Journal of Petroleum Technology, 33(6): 1075-1086. https://doi.org/10.2118/8788-pa
[2] Brown, T.S., Niesen, V.G., Erickson, D.D. (1993). Measurement and prediction of the kinetics of paraffin deposition. All Days. https://doi.org/10.2118/26548-ms
[3] Alnaimat, F., Ziauddin, M. (2020). Wax deposition and prediction in petroleum pipelines. Journal of Petroleum Science and Engineering, 184: 106385. https://doi.org/10.1016/j.petrol.2019.106385
[4] Perez, P., Boden, E., Chichak, K., Kate Gurnon, A., Hu, L., Lee, J., McDermott, J., Osaheni, J., Peng, W., Richards, W., Xie, X. (2015). Evaluation of paraffin wax inhibitors: an experimental comparison of bench-top test results and small-scale deposition rigs for model waxy oils. All Days. https://doi.org/10.4043/25927-ms
[5] Jessen, F.W., Howell, J.N. (1958). Effect of flow rate on paraffin accumulation in plastic, steel, and coated pipe. Transactions of the AIME, 213(1): 80-84. https://doi.org/10.2118/968-g
[6] Hunt, E.B. (1962). Laboratory study of paraffin deposition. Journal of Petroleum Technology, 14(11): 1259-1269. https://doi.org/10.2118/279-pa
[7] Brown, T.S., Niesen, V.G., Erickson, D.D. (1993). Measurement and prediction of the kinetics of paraffin deposition. all days. https://doi.org/10.2118/26548-ms
[8] Theyab, M.A. (2018). Experimental methodology followed to evaluate wax deposition process. Journal of Petroleum & Environmental Biotechnology, 9(1). https://doi.org/10.4172/2157-7463.1000357
[9] Wei, L., Li, D., Liu, C., He, Z., Ge, Y. (2022). Study of wax deposition pattern of high wax-bearing crude oil based on cold finger experiment. Processes, 10(1): 103. https://doi.org/10.3390/pr10010103
[10] Svendsen, J.A. (1993). Mathematical modeling of wax deposition in oil pipeline systems. AIChE Journal, 39(8): 1377-1388. https://doi.org/10.1002/aic.690390815
[11] Boucetta, R., Kessal, M. (2011). Effect of the latent heat on wax deposit in pipelines. Defect and Diffusion Forum, 312-315: 154-159. https://doi.org/10.4028/www.scientific.net/ddf.312-315.154
[12] Mehrotra, A.K., Haj-Shafiei, S., Ehsani, S. (2021). Predictions for wax deposition in a pipeline carrying paraffinic or ‘waxy’ crude oil from the heat-transfer approach. Journal of Pipeline Science and Engineering, 1(4): 428-435. https://doi.org/10.1016/j.jpse.2021.09.001
[13] McClaflin, G.G., Whitfill, D.L. (1984). Control of paraffin deposition in production operations. Journal of Petroleum Technology, 36(11): 1965-1970. https://doi.org/10.2118/12204-pa
[14] Singh, P., Venkatesan, R., Fogler, H.S., Nagarajan, N. (2000). Formation and aging of incipient thin film wax-oil gels. AIChE Journal, 46(5): 1059-1074. https://doi.org/10.1002/aic.690460517
[15] Elphingstone, G.M., Greenhill, K.L., Hsu, J.J.C. (1999). Modeling of multiphase wax deposition. Journal of Energy Resources Technology, 121(2): 81-85. https://doi.org/10.1115/1.2795072
[16] Ramirez-Jaramillo, E., Lira-Galeana, C., Manero, O. (2004). Modeling wax deposition in pipelines. Petroleum Science and Technology, 22(7-8): 821-861. https://doi.org/10.1081/lft-120038726
[17] Cordoba, A.J., Schall, C.A. (2001). Application of a heat transfer method to determine wax deposition in a hydrocarbon binary mixture. Fuel, 80(9): 1285-1291. https://doi.org/10.1016/s0016-2361(00)00207-6
[18] Azevedo, L.F.A., Teixeira, A.M. (2003). A critical review of the modeling of wax deposition mechanisms. Petroleum Science and Technology, 21(3-4): 393-408. https://doi.org/10.1081/lft-120018528
[19] Huang, Z., Lee, H.S., Senra, M., Scott Fogler, H. (2011). A fundamental model of wax deposition in subsea oil pipelines. AIChE Journal, 57(11): 2955-2964. https://doi.org/10.1002/aic.12517
[20] Boucetta, R., Haddad, Z., Zamoum, M., Kessal, M., Arıcı, M. (2022). Numerical investigation of wax deposition features in a pipeline under laminar flow conditions. Journal of Petroleum Science and Engineering, 217: 110929. https://doi.org/10.1016/j.petrol.2022.110929
[21] Ribeiro, F.S., Souza Mendes, P.R., Braga, S.L. (1997). Obstruction of pipelines due to paraffin deposition during the flow of crude oils. International Journal of Heat and Mass Transfer, 40(18): 4319-4328. https://doi.org/10.1016/s0017-9310(97)00082-3