Zainal Arifin*![]() | Singgih Dwi Prasetyo
| Singgih Dwi Prasetyo![]() | Rendy Adhi Rachmanto
| Rendy Adhi Rachmanto![]() | Wibawa Endra Juwana
| Wibawa Endra Juwana![]() | Eflita Yohana
| Eflita Yohana![]() | Denny Widhiyanuriyawan
| Denny Widhiyanuriyawan![]()
© 2023 IIETA. This article is published by IIETA and is licensed under the CC BY 4.0 license (http://creativecommons.org/licenses/by/4.0/).
OPEN ACCESS
The abundant availability of solar energy presents a promising renewable resource, yet its potential remains underexploited due to limitations in current technology. Specifically, high operating temperatures pose a significant challenge to the overall efficiency of photovoltaic (PV) panels. This study, therefore, investigates the development of a combined Photovoltaic-Thermal (PVT) system, designed to concurrently generate electricity and thermal energy, with the primary objective of reducing PV surface operating temperatures to enhance electricity production. A computational fluid dynamics (CFD) approach was employed to simulate the design of the collector within the PVT system using Solidworks 2017. Multiple collector configurations were modelled, encompassing 5, 10, and 15 collectors with edge angles of 90° and 180°, to elucidate the resulting temperature differentials. Our findings reveal that the utilization of 15 collectors with a 90o edge angle generated the lowest mean temperature, approximately 329.51 K, with a uniform distribution. The heat generation factor within each collector variation was observed to bear an impact on collector temperature, although the associated Anova P-value of 0.48 suggests non-significant temperature alterations across these collector variations. Similarly, the volume flow rate demonstrated negligible influence on temperature variations across each collector, with an Anova P-value of 0.03. This study, thus, illuminates potential pathways for advancing the geometric modeling of thermal collectors, with implications for the future development of solar energy exploitation technologies.
solar energy, PVT, collector, Solidworks
Solar energy, a widely accessible and inexhaustible resource, has garnered increasing attention due to its diverse applications, which include solar water heating, solar desalination, and solar lighting [1]. Moreover, solar energy can be converted into electrical energy through various technologies, such as photovoltaic cells, thin films, and Dye-Sensitized Solar Cells (DSSC) [2]. Of these technologies, photovoltaic cells have demonstrated superior efficiency in solar energy utilization, ranging between 15-20% [3-6]. However, the efficacy and performance of photovoltaic technology remain suboptimal, primarily due to the detrimental effects of high operating temperatures within the panels. Such high temperatures have been identified as a significant challenge to the advancement of solar power utilization [7]. To address this issue, cooling systems have been integrated into solar panels. Particularly noteworthy are adsorption cycles and air cooling methods that utilize low-temperature heat energy and environmentally friendly working materials. These methods have attracted considerable interest, given their potential for reducing the environmental impact of solar power systems [8, 9].
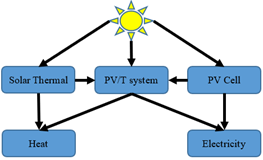
Photovoltaic-Thermal (PVT) systems, as depicted in Figure 1, amalgamate photovoltaic (PV) and thermal (T) components to concurrently generate electrical and thermal energy. This dual-functionality of PVT solar cells facilitates a more efficient conversion of total solar energy, thus enhancing the overall performance of solar energy systems [10, 11]. However, one notable challenge arises from the heat that is trapped within the photovoltaic cells, which they are incapable of converting into electrical energy. This accumulation of heat elevates the temperature of the cells, leading to degradation and a subsequent drop in photovoltaic performance. In PVT systems, this detrimental heat is strategically redirected from the photovoltaic cells via a collector into a solar water heater. This process not only reduces the operating temperature of the photovoltaic cells, thereby increasing their efficiency, but also ensures that the radiation and radiant heat intensity is maintained. The redirected heat can then be repurposed for water heating, further enhancing the system's energy efficiency [12-14].
Another strategy proposed for enhancing the design of PVT systems involves the dispersion of heat across the photovoltaic surface, enabling the production of more electrical energy [15-17]. Various factors influencing PVT performance have been investigated through simulations and experimental research. These influential variables extend to design parameters, operational parameters, and climatic parameters, each of which can significantly impact performance [18-20]. Among the various design modifications proposed, PVT collectors have been identified as a viable means to augment photoelectric performance [21-23]. The enhancement of electrical and thermal efficiency is predicated on ensuring robust thermal conductivity between the solar module and the heat absorption device.
Figure 1. Solar energy conversion flowchart
In 2018, Herrando et al. [24] posited an increase in temperature, thermal efficiency, and electrical efficiency with the expansion of the number of collectors in the chain. The study highlighted the supremacy of the number of riser tubes over their diameter in determining thermal efficiency. Doubling the number of riser tubes resulted in an absolute increase of 1.5% in thermal efficiency, or a relative increase of 2.3%. A different study conducted in Sheshpoli et al. [25], in 2021 manipulated the design of the collector and the angle of the collector edges. According to the findings, the arrangement of the tube and angled edges could enhance electrical efficiency by 7.3% compared to an uncooled condition, and thermal efficiency by 48.4%. Under optimal operation, the overall efficiency could reach up to 51.76%. Misha et al. [26] in a 2019 study, reported the highest average thermal efficiency of Photovoltaic-Thermal (PVT) systems to be approximately 59.6%. At a mass flow rate of 6 l/m, the highest average values for the electrical efficiency of PV panels and PVT water systems were found to be 10.86% and 11.71%, respectively.
While prior research has identified several factors that can enhance the overall performance of PVT systems, the modeling of thermal collectors still requires further development to maximize the temperature reduction effects integral to these systems [27-29]. Consequently, the present study embarks on an exploration of the phenomena arising from alterations in the geometry of the thermal collector, with proportions aligned to solar panels. Employing the computational fluid dynamics (CFD) technique, an analysis of fluid flow and temperature distribution on solar panels is conducted in this work. The aim of this analysis is to model a hybrid system, leveraging various configurations previously developed by researchers. The modeling is carried out using a distinct CFD approach, with simulations performed utilizing the Solidworks 2017 application. In this study, several parameters are taken into account as benchmarks, including configuration shape, number of collectors, and flow rate, all of which are identified to have a significant impact on enhancing PVT performance.
This research utilizes computational fluid dynamics (CFD) modeling to solve mathematical equations governing various physics, including fluid flow, heat transfer, chemical reactions, phase change, and many other phenomena. The stages involved in CFD simulation of Solar PV/T panels encompass geometric modeling, meshing or grid generation, setup and solution, and results analysis [30, 31]. Solidworks 2017 was used to design the model developed in three dimensions (3D) [32]. Additionally, SolidWorks can perform structural and dynamic analysis, as well as generate visualizations of 3D designs. A laptop with an Intel (R) Core (TM) i3-6006U CPU running at 2.00GHz and the Solidworks 2017 program were used to perform the investigation. The program was used to simulate and design computational fluid dynamics (CFD).
(a)
(b)
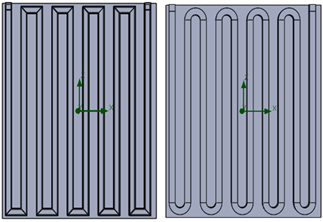
Figure 2. (a) Cross-sectional scheme of the box configuration PVT collector [24]; (b) Design results of the collector model
This research delves into the temperature variation of photovoltaic thermal collectors concerning the number of collectors utilized. The investigation specifically focused on evaluating how different quantities of collectors impact temperature levels. To replicate real-world conditions, the study considered a bright summer day characterized by a high temperature of 307 K and maintained a static pressure of 101325 Pa. These parameters were chosen to observe the specific effects of collector quantity on the thermal performance under typical high-temperature conditions. Direct radiation to the collector's base was used to study coatings that had PV panel properties [33]. The research was conducted using as benchmarks the studies by Misha et al. [26] about the fluid flow rate in the collector, Sheshpoli et al. [25] regarding the form and angle of the collector, and Herrando et al. [24] considering the number of collectors utilized.
The modeling process followed the configuration shown in Figure 2(a). computational fluid dynamics (CFD) simulations were conducted on the collectors using water flowing at a rate of 0.00005 m³/s. The viscosity and other properties of the water were determined based on the research conducted by Ni et al. [34]. The collector was designed with a square shape of 15.77×15.77 mm and a thickness of 1.95 mm, and a thin plate was added with a thickness of 0.4 mm, as shown in Figure 2(b). The number of collectors modeled in this study was 5, 10, and 15, taking into account the proportional composition between the dimensions of the panel and the cross-sectional area of the collector. In addition, the selection of edge angles of 90° and 180° applied represents the most commonly used forms in thermal collector schemes. This research aims to examine the heat transfer phenomena and flow rates occurring in each variation used to enhance solar cell performance.
The study used collectors made of 302 Stainless Steel, meeting the parameters in Table 1. A solar energy intensity of 1000 watts per square meter was directed onto the collector's upper surface. In Figure 2(b), water was pumped in from the left end of the collector and flowed towards the right along the x+ axis. The output had a fixed pressure of 101325 Pa. Different collector designs were tested, following reported models' edge angles. The unique aspect of this study was varying the number of collectors. All other conditions were kept constant for a fair comparison.
Table 1. Collector material specification
|
Path |
Solids Pre-Defined/Alloys |
|
Density |
7900.00 kg/m3 |
|
Specific heat |
500.0 J/(kgK) |
|
Conductivity type |
Isotropic |
|
Thermal conductivity |
16.3000 W/(mK) |
|
Electrical conductivity |
Conductor |
|
Resistivity |
7.2000e-007 Ohm m |
|
Radiation properties |
No |
|
Melting temperature |
Yes |
|
Temperature |
1673.15 K |
An explanation of the current-voltage curve for solar cells' performance is possible (IV curve). The output of a photovoltaic (PV) device is represented by the I-V curve as combinations of current and voltage. Utilize the theoretical Maximum Power produced by the PV cell, which is equivalent to the open-circuit voltage (Voc) and short-circuit current, to calculate the parameters of curve IV at constant temperature and solar radiation (Isc). The fill factor (FF) is determined by these circumstances when [35, 36].
$F F=\frac{P_{M P P}}{I_{S C} \times V_{O C}}=\frac{I_{M P P} \times V_{M P P}}{I_{S C} \times V_{O C}}$ (1)
The maximum power (PMPP) to solar radiation power received by solar cells is referred to as solar cell efficiency ($\eta$). Calculating the efficiency involves:
$\eta=\frac{P_{M P P}}{P_{\text {light }}} \times 100 \%$ (2)
To determine the effect of the number of collectors, research was also carried out on variations in heat generation rate and flow rate. The surface heat generation rate is given on the surface of the plate in the collector design. Therefore, the thermal efficiency can be calculated by:
$\eta_{t h}=\frac{\dot{m} c_p\left(T_o-T_i\right)}{I A}$ (3)
To improve the accuracy of the CFD simulation results, mesh generation was done [37]. The simulation using SolidWorks has a mesh control function, which gives the ability to adjust the grid density only where you need it. Standard conditions were used to generate mesh results when auto-completed. Each variation's mesh creation followed a consistent procedure [38]. The basic mesh dimensions for each design in cells x, y, z was 12, 42, 14. The Solidworks CFD simulation automatically generated the same grid as seen in Table 2 and Figure 3 by meshing the collector. In order to assess the impact of the number of collectors on the temperature of the solar thermal collector, the mesh generated automatically was directly simulated for heat transmission to the collector.
Table 2. Number of cells
|
Mesh |
Amount |
|
Cells |
82991 |
|
Fluid cells |
53183 |
|
Solid cells |
29808 |
|
Irregular cells |
0 |
|
Trimmed cells |
0 |
Figure 3. Result of mesh design
In order to confirm that the data set being measured originates from a homogenous population, homogeneity testing is used. Researchers compute homogeneity while comparing the attitude, purpose, or behavior (variance) between two groups. ANOVA, or analysis of variance, is one of the statistical tests that is most frequently employed in academic research [39, 40]. To ascertain whether there is a significant difference between three or more groups, an analysis of variance is utilized. In the analysis of variance hypothesis, some researchers additionally take into account the impact of the independent variable on the dependent variable. Depending on the objectives of each investigation, these two hypotheses really imply the same thing [41]. The assumption H0 is that the influence of heat generation or flow rate does not cause a change in the collector temperature. Ha's theory is that fluctuations in the collector temperature are brought on by the influence of heat generation or flow rate. The test conditions are based on the hypothesis; if the P value is less than 0.05 with α 5%, the hypothesis H0 can be accepted. Meanwhile, the hypothesis Ha can be accepted if the P value is more than 0.05 with α 5% [39, 41].
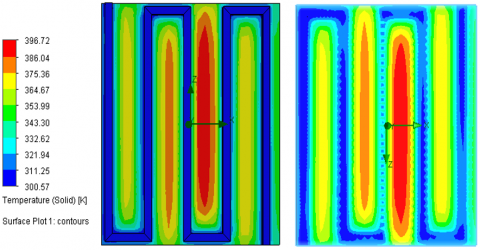
At various numbers and angles of collector edges, the simulation results are shown as temperature contours throughout the collector domain. Figure 4 depicts the contour of the temperature collector with an edge angle of 90° while Figure 5 depicts the contour of the temperature collector with an edge angle of 180°. It is well known that temperature contours are lower and more consistent the more collectors there are. A high temperature is denoted by the red contour, whereas a low temperature is denoted by the dark blue contour.
(a)
(b)
(c)
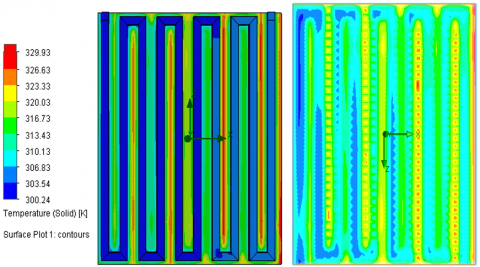
Figure 4. Simulation results for a 90° solid temperature collector with (a) 5 collectors (b) 10 collectors (c) 15 collectors
As shown in Table 3, the collector with a collector number of 15 and an edge angle of 90° had the lowest average temperature value of 329.51 K at a heat generation rate of 1000 W/m2 and a volume flow rate of 0.00005 m3/s. The quantity of blue outlines and the evenly distributed simulation results further support this. In order to boost the thermal and electrical efficiency of the PVT, more heat may be collected from the PV panel as seen by the low temperature when utilizing 15 collectors with 90° edge angles.
(a)
(b)
(c)
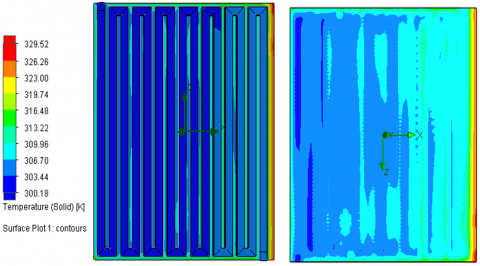
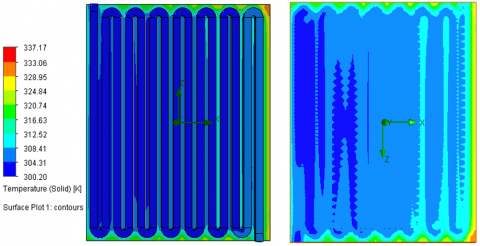
Figure 5. Simulation results for a 180° solid temperature collector with (a) 5 collectors (b) 10 collectors (c) 15 collectors
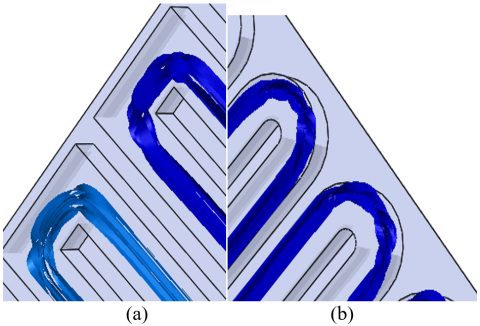
Figures 4 and 5 show that altering the edge angle results in varied temperature distributions. While creating a denser and more directed flow, the 180° edge angle cannot cover as many collector shapes. On the contrary, the 90° edge angle allows for a broader water flow range, ensuring even cooling. This difference is highlighted by the temperature gap of up to 7.63 K between using a 90° angle and a 180° angle on the collector. Using a 90° angle provides superior cooling compared to a 180° angle when the number of collectors is the same. However, with 5 collectors, the 180° angle remains more effective due to the grooves' shape inside the collector, reducing the occurring pressure drop. This phenomenon occurs because a higher number of collectors can reduce the cross-sectional area through which the fluid flows yet can expand the contact surface area between the collector and the panel. Adding more collectors becomes ineffective due to the reduction in the fluid flow area, leading to increased pressure drop and altered flow patterns. Figure 6 illustrates flow patterns that can still be maintained, even when using both 90° and 180° edge angles on the collector, making their influence less significant compared to the more dominant contact surface area between the panels.
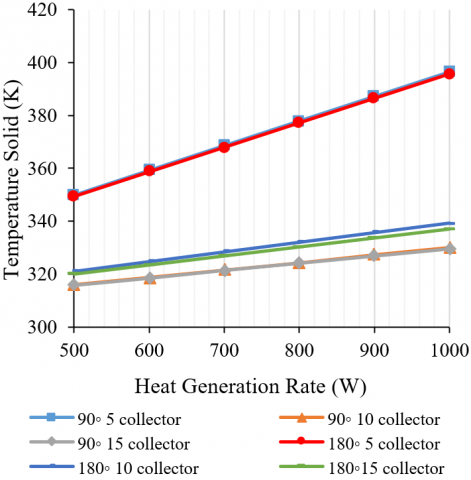
The maximum temperature for each collector variation under the rate of heat output is shown in Figure 7. The rate of heat generation has risen, which has raised the temperature of the collector. The use of a collector with an edge angle of 90o and several collectors as much as 15 always has a lower temperature than other collector variations at any given heat generation rate.
Figure 6. Water flow at collector angle (a) 90o (b) 180o
The simulation results for the collector temperature at each heat generation rate are presented in Table 4. The greatest average temperature, 354.65 K, is known to occur when a heat generating rate of 1000 W/mw is used. After obtaining the results, an ANOVA test was conducted using the specified variables. As shown in Table 5, the ANOVA test results indicated a P-value of 0.48. Therefore, the Ha hypothesis, stating that temperature changes are caused by fluctuations in the heat generation rate, is validated. This statement proves that alterations in the heat generation rate do indeed affect temperature changes, aligning with the initial hypothesis.
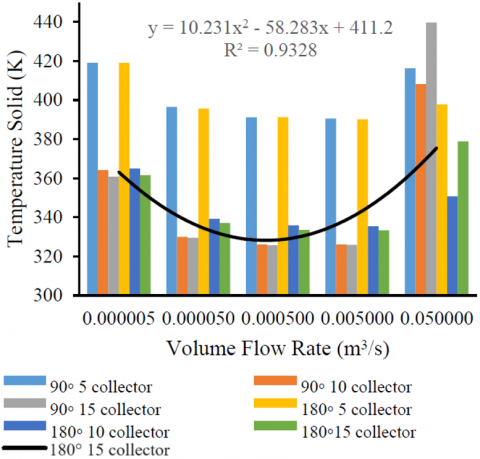
The effect of flow rate on each variation of the edge angle and number of collectors on the collector temperature is presented in Figure 8. Based on this figure, the flow rate has no significant effect on temperature for any changes in the variation of the collector used. The flow rate of 0.0005 m3/s has the lowest temperature value for each collector variation. The trendline illustrates that flow rates above 0.0005 m3/s experience an increase in temperature. This suggests that compared to lower flow rates, the working fluid would require more time to absorb heat from the PV panels.
Figure 7. Collector temperature vs. heat generation rate
Table 3. Temperature simulation results
|
Variation |
Goal Name |
Value (K) |
Average (K) |
Minimum (K) |
Maximum (K) |
|
90o 5 collector |
Surface Temperature (Solid) 1 |
396.72 |
396.5 |
396.24 |
396.72 |
|
Outlet Temperature (Fluid) 1 |
312.81 |
312.79 |
312.74 |
312.98 |
|
|
90o 10 collector |
Surface Temperature (Solid) 1 |
329.93 |
329.97 |
329.90 |
330.12 |
|
Outlet Temperature (Fluid) 1 |
309.98 |
310.01 |
309.98 |
310.2 |
|
|
90o 15 collector |
Surface Temperature (Solid) 1 |
329.53 |
329.51 |
329.45 |
329.53 |
|
Outlet Temperature (Fluid) 1 |
309.91 |
309.89 |
309.82 |
309.91 |
|
|
180o 5 collector |
Surface Temperature (Solid) 1 |
395.81 |
395.64 |
395.37 |
395.81 |
|
Outlet Temperature (Fluid) 1 |
313.22 |
313.14 |
313.00 |
313.22 |
|
|
180o 10 collector |
Surface Temperature (Solid) 1 |
339.26 |
339.2 |
339.08 |
339.26 |
|
Outlet Temperature (Fluid) 1 |
309.97 |
309.95 |
309.85 |
309.97 |
|
|
180o 15 collector |
Surface Temperature (Solid) 1 |
337.17 |
337.14 |
337.06 |
337.17 |
|
Outlet Temperature (Fluid) 1 |
310.07 |
310.05 |
309.98 |
310.07 |
Table 4. Data summary of the results of heat generation rate to temperature
|
Groups |
Count |
Sum |
Average |
Variance |
|
500 |
6 |
1971.992 |
328.6653 |
265.8995 |
|
600 |
6 |
2003187 |
333.8645 |
3817474 |
|
700 |
6 |
2034,615 |
339.1025 |
516.5072 |
|
800 |
6 |
2065,697 |
344.2829 |
673.4028 |
|
900 |
6 |
2096.99 |
349.4984 |
846.9492 |
|
1000 |
6 |
2127,958 |
354.6596 |
1043,768 |
Table 5. ANOVA heat generation rate to temperature
|
Source of Variation |
SS |
df |
MS |
F |
P-Value |
F Crit |
|
Between Groups |
2840,886 |
5 |
568.1773 |
0.914381 |
0.485034 |
2.533555 |
|
Within Groups |
18641.37 |
30 |
621,379 |
|||
|
Total |
21482.26 |
35 |
Figure 8. Temperature vs. volume flow rate
The simulation results for the collector temperature at each volume flow rate are displayed in Table 6. It is well known that an average temperature of 350.24 K is achieved with a volume flow rate of 0.005 m3/s. After obtaining the results, an ANOVA test was conducted using the predetermined variables. According to the analysis of the ANOVA test results presented in Table 7, the resulting P-value is 0.03. Therefore, the H0 hypothesis, which states that the volume flow rate does not affect the temperature regardless of differences in the collectors, is confirmed. This statement indicates that the findings indeed suggest that variations in the volume flow rate significantly influence the temperature, aligning with what was hypothesized in this study. Consequently, these results confirm that changes in the volume flow rate affect the temperature of the collectors, supporting the findings consistent with the initial hypothesis. This is consistent with what Figure 8 says.
Table 6. Data summary of the results of volume flow rate to temperature
|
Groups |
Count |
Sum |
Average |
Variance |
|
0.000005 |
6 |
2289,487 |
381.5811 |
846.1083 |
|
0.00005 |
6 |
2127,966 |
354.6611 |
1043,691 |
|
0.0005 |
6 |
2103.642 |
350,607 |
1007.061 |
|
0.005 |
6 |
2101.444 |
350.2407 |
979.9188 |
|
0.05 |
6 |
2391,482 |
398.5803 |
955,829 |
Table 7. ANOVA volume flow rate to temperature
|
Source of Variation |
SS |
df |
MS |
F |
P-Value |
F Crit |
|
Between Groups |
11470.15 |
4 |
2867,537 |
2.966863 |
0.039105 |
2.75871 |
|
Within Groups |
24163.04 |
25 |
966.5216 |
|||
|
Total |
35633.19 |
29 |
Based on the simulation results of temperature changes as shown in Table 2, it is known that the use of 15 collectors has the smallest temperature change compared to 5 and 10 collectors. In addition, the use of turning angles on the collector has a role in fluid distribution, which affects heat transfer in the collector. Changes in the temperature of the collector have an effect on the resulting thermal efficiency.
Thermal efficiency can be measured by using a collector design of 15 with a turning angle of 90° and 180° given fluid input in the form of water with an input temperature of 300 K. Water fluid has a mass flow rate ($\dot{m}$) of 0.05 kg/s with a specific heat capacity (cp) of 4218 J/kgK. The input temperature (Ti) of the given fluid is 300 K, resulting in the output temperature (To), which is obtained from the simulation process. The surface heat generation rate represents the radiation intensity (I) 1000 W/m2 given a total collector surface area (A) of 1.55 m2.
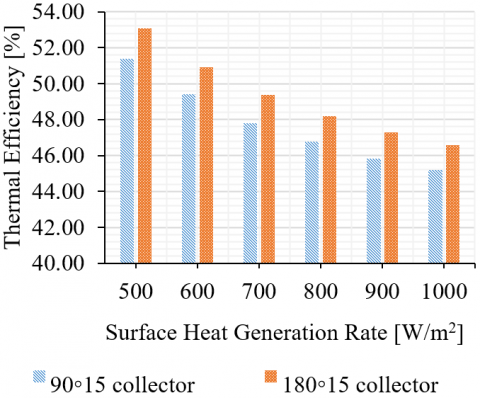
For the thermal efficiency generated in the 15-collector design, it is known that the higher the given surface heat generation, the lower the efficiency value, as shown in Figure 8. At the same surface heat generation rate of 1000 W/m2, the collector design with a collector angle of 180° has a higher fluid output temperature value compared to the 90° angle collector. Therefore, the 180° collector angle design has a higher thermal efficiency of 46.56% compared to the 90° angle of 45.18%. This indicates that the collector with an angle of 180° facilitates fluid flow so that it has sufficient time to transfer the heat that is in the collector to the fluid that results in a higher fluid output temperature and thermal efficiency. These results are the basis for considering the results of the thermal efficiency of this study, as shown in Figure 9.
Figure 9. Thermal efficiency vs. surface heat generation
The decrease in thermal efficiency occurs in the higher heat flux, because a high heat flux can affect the overall temperature so that heat transfer in the collector becomes less effective. A temperature change at the collector depending on the given boundary conditions. It is known that an increase in the value of a given specific heat generation results in a higher collector temperature. The raised heat flux is one of the main problems because it can reduce the performance of the thermal collector, so it is necessary to make further improvements in order to produce more optimal energy.
The result was revealed in a study conducted by Herrando et al. [24] in 2018 for each radiation intensity of 800, 900, and 1000 W/m2. In addition, in the use of fluid flow rates, there are differences in temperature changes for each given fluid flow rate input. Similar findings were also demonstrated by Rosli et al. [13] in 2018, using a mass flow rate ranging from 0 to 0.006 kg/s. To validate the results more accurately, experimental research under identical conditions is necessary. Conducting experimental studies with similar parameters will enable further confirmation of the simulation results, enhancing the reliability of the findings obtained in this research. This is crucial to ensure that the results derived from simulations align with the real behavior of the studied system. Sardouei et al. [42] conducted studies on these collectors and reported their findings. They observed that under different radiation intensities (800, 900, and 1000 W/m²) and varying flow rates (ranging from 30 to 180 liters per hour), the thermal efficiency of these collectors exhibited a range of 30% to 48%. This variability in efficiency highlights the sensitivity of thermal collectors to changes in radiation intensity and flow rates, emphasizing the need for precise design considerations and operational parameters in maximizing their performance.
The study utilized computational fluid dynamics (CFD) simulation through the Solidworks 2017 application to comprehensively analyze the influence of two critical factors: the quantity of collectors and various edge angles on collector performance. These simulations allowed for a detailed examination of how alterations in these factors influenced the collector's performance metrics. This enhancement was reflected in the collector's ability to modify temperature effectively, indicating a promising trend for optimizing solar energy collection. The study observed that an indiscriminate increase in the number of collectors could lead to a potential issue with pressure drop. Pressure drop, in this context, refers to the reduction in fluid pressure due to the flow resistance encountered within the collector system. An excessive increase in collectors might interfere with the flow rate, impacting the efficiency of the system.
The model with amount of 15 collectors with 90° angle edges has the lowest temperature of 329.51 K at a heat generation rate of 1000 W/m2 and a volume flow rate of 0.00005 m3/s. The higher the number of collectors, the lower the temperature, and the 90° edge angle can make the collector temperature spread more evenly. Changes in the collector temperature can be influenced by variations in the heat generating rate for each collector variation. Based on the P value in the homogeneity test using ANOVA, which is 0.48 above the standard value, the impact of heat generation is justified. However, because the P value of the volume flow rate is 0.03 less than the reference value, it does not produce temperature changes in any of the collector variations. The 180° edge angle with 15 collectors design has a higher thermal efficiency of 46.56% compared to that with the 90° angle of 45.18%. To enhance the model further, future research could incorporate the consideration of pressure drop and contact surface area into the simulation. Factoring in pressure drop dynamics and optimizing the contact surface area would provide a more comprehensive understanding of how these variables interact with the number of collectors and edge angles.
This research was fully supported by the PNBP grant from the Sebelas Maret University, Indonesia, with contract number 228/UN27.22/PT.01.03/2023 of the Penelitian Unggulan Terapan (PUT-UNS) scheme.
|
$\dot{m}$ |
Mass flow rate (kg/s) |
|
cp |
Specific heat capacity (J/kgK) |
|
Ti |
Input temperature (K) |
|
To |
Output temperature (K) |
|
I |
Radiation intensity (W/m2) |
|
A |
Surface area collector (m2) |
|
Greek symbols |
|
|
η |
efficiency (%) |
|
Subscripts |
|
|
PV |
Photovoltaic |
|
T |
Thermal |
|
PVT |
Photovoltaic thermal collector |
|
CFD |
Computational fluid dynamics |
[1] Eisavi, B., Nami, H., Yari, M., Ranjbar, F. (2021). Solar-driven mechanical vapor compression desalination equipped with organic Rankine cycle to supply domestic distilled water and power – Thermodynamic and exergoeconomic implications. Applied Thermal Engineering, 193: 116997. https://doi.org/10.1016/j.applthermaleng.2021.116997
[2] Arifin, Z., Suyitno, Hadi, S., Prasetyo, S.D., Hasbi, M. (2022). Promoting effect of TiCl4 pre-coating time on TiO2 semiconductors on double layer dye-sensitized solar cell. Journal of Sustainability for Energy, 1(1): 18-26. https://doi.org/10.56578/jse010103
[3] Fayaz, H., Rahim, N.A., Hasanuzzaman, M., Nasrin, R., Rivai, A. (2019). Numerical and experimental investigation of the effect of operating conditions on performance of PVT and PVT-PCM. Renewable Energy, Renewable Energy, 143: 827-841. https://doi.org/10.1016/j.renene.2019.05.041
[4] Arifin, Z., Hadi, S., Jati, H.N., Prasetyo, S.D., Suyitno. (2020). Effect of electrospinning distance to fabricate ZnO nanofiber as photoanode of dye-sensitized solar cells. AIP Conference Proceedings, 2217: 030095. https://doi.org/10.1063/5.0000705
[5] Nurwidiana, N., Sopha, B.M., Widyaparaga, A. (2021). Modelling photovoltaic system adoption for households: A systematic literature review. Evergreen, 8(1): 69-81. https://doi.org/10.5109/4372262
[6] Byrne, P., Putra, N., Mare, T., Abdullah, N., Lalanne, P., Alhamid, M. (2018). Design of a solar AC system including a PCM storage for sustainable resorts in tropical region. Kyushu University Institutional Repository, 6(2): 143-148. https://doi.org/10.5109/2321009
[7] Rahman, M.M.M., Hasanuzzaman, M., Rahim, N.A.A. (2015). Effects of various parameters on PV-module power and efficiency. Energy Conversion and Management, 103: 348-358. https://doi.org/10.1016/j.enconman.2015.06.067
[8] Rouf, R.A., Hakim Khan, M.A., Ariful Kabir, K.M., Saha, B.B. (2016). Energy management and heat storage for solar adsorption cooling. Evergreen, 3(2): 1-10. https://doi.org/10.5109/1800866
[9] Arifin, Z., Tribhuwana, B.A., Kristiawan, B., Tjahjana, D.D.D.P., Hadi, S., Rachmanto, R.A., Prasetyo, S.D., Hijriawan, M. (2022). The effect of soybean wax as a phase change material on the cooling performance of photovoltaic solar panel. International Journal of Heat and Technology, 40(1): 326-332. https://doi.org/10.18280/ijht.400139
[10] Widyolar, B., Jiang, L., Ferry, J., Winston, R., Kirk, A., Osowski, M., Cygan, D., Abbasi, H. (2019). Theoretical and experimental performance of a two-stage (50X) hybrid spectrum splitting solar collector tested to 600℃. Applied Energy, 239: 514-525. https://doi.org/10.1016/j.apenergy.2019.01.172
[11] Gonzalez-Sanchez, M., Camaraza-Medina, Y. (2022). Application of the thermal solar energy in the primary circuit of hot water of the four palms hotel. Journal of Sustainability for Energy, 1(1): 1-7. https://doi.org/10.56578/jse010101
[12] Guarracino, I., Freeman, J., Ramos, A., Kalogirou, S.A., Ekins-Daukes, N.J., Markides, C.N. (2019). Systematic testing of hybrid PV-thermal (PVT) solar collectors in steady-state and dynamic outdoor conditions. Applied Energy, 240: 1014-1030. https://doi.org/10.1016/j.apenergy.2018.12.049
[13] Rosli, M.A.M., Ping, Y.J., Misha, S., Akop, M.Z., Sopian, K., Mat, S., Al-Shamani, A.N., Saruni, M.A. (2018). Simulation study of computational fluid dynamics on photovoltaic thermal water collector with different designs of absorber tube. Journal of Advanced Research in Fluid Mechanics and Thermal Sciences, 52(1): 12-22.
[14] Tewari, K., Dev, R. (2018). Analysis of modified solar water heating system made of transparent tubes & insulated metal absorber. Evergreen, 5(1): 62-72. https://doi.org/10.5109/1929731
[15] Kandeal, A.W., Thakur, A.K., Elkadeem, M.R., Elmorshedy, M.F., Ullah, Z., Sathyamurthy, R., Sharshir, S.W. (2020). Photovoltaics performance improvement using different cooling methodologies: A state-of-art review. Journal of Cleaner Production, 273: 122772. https://doi.org/10.1016/j.jclepro.2020.122772
[16] Liu, Y., Lin, K.Y. (2023). Enhancing energy efficiency in sow houses: An annual temperature regulation system employing heat recovery and photovoltaic-thermal technology. Journal of Sustainability for Energy, 2(2): 76-90. https://doi.org/10.56578/jse020204
[17] Agarwal, S.K., Batista, R.C. (2023). Enhancement of building thermal performance: A comparative analysis of integrated solar chimney and geothermal systems. Journal of Sustainability for Energy, 2(2): 91-108. https://doi.org/10.56578/jse020205
[18] Abdullah, A.L., Misha, S., Tamaldin, N., Rosli, M.A.M. and Sachit, F.A. (2019). A review: Parameters affecting the PVT collector performance on the thermal, electrical, and overall efficiency of PVT system. Journal of Advanced Research in Fluid Mechanics and Thermal Sciences, 60(2): 191-232.
[19] Prasetyo, S.D., Prabowo, A.R., Arifin, Z. (2022). The effect of collector design in increasing PVT performance: Current state and milestone. Materials Today: Proceedings, 63(1): S1-S9. https://doi.org/10.1016/j.matpr.2021.12.356
[20] Arifin, Z., Prasetyo, S.D., Tjahjana, D.D.D.P., Rachmanto, R.A., Prabowo, A.R., Alfaiz, N.F. (2022). The application of TiO2 nanofluids in photovoltaic thermal collector systems. Energy Reports, 8(9): 1371-1380. https://doi.org/10.1016/j.egyr.2022.08.070
[21] Yu, Y., Yang, H., Peng, J., Long, E. (2019). Performance comparisons of two flat-plate photovoltaic thermal collectors with different channel configurations. Energy, 175: 300-308. https://doi.org/10.1016/j.energy.2019.03.054
[22] Touafek, K., Khelifa, A., Adouane, M. (2014). Theoretical and experimental study of sheet and tubes hybrid PVT collector. Energy Conversion and Management, 80: 71-77. https://doi.org/10.1016/j.enconman.2014.01.021
[23] Ismaeel, A.A., Wahhab, H.A.A., Naji, Z.H. (2021). Performance evaluation of updraft air tower power plant integrated with double skin solar air heater. Evergreen, 8(2): 296-303. https://doi.org/10.5109/4480706
[24] Herrando, M., Ramos, A., Zabalza, I., Markides, C.N. (2019). A comprehensive assessment of alternative absorber-exchanger designs for hybrid PVT-water collectors. Applied Energy, 235: 1583-1602. https://doi.org/10.1016/j.apenergy.2018.11.024
[25] Sheshpoli, A.Z., Jahanian, O., Nikzadfar, K., Aghajani Delavar, M. (2021). Numerical and experimental investigation on the performance of hybrid PV/thermal systems in the north of Iran. Solar Energy, 215: 108-120. https://doi.org/10.1016/j.solener.2020.12.036
[26] Misha, S., Abdullah, A.L., Tamaldin, N., Rosli, M.A.M., Sachit, F.A. (2020). Simulation CFD and experimental investigation of PVT water system under natural Malaysian weather conditions. Energy Reports, 6(7): 28-44. https://doi.org/10.1016/j.egyr.2019.11.162
[27] Driss, Z., Mlayeh, O., Driss, S., Driss, D., Maaloul, M., Abid, M.S. (2015). Study of the bucket design effect on the turbulent flow around unconventional Savonius wind rotors. Energy, 89: 708-729. https://doi.org/10.1016/J.ENERGY.2015.06.023
[28] Mahakul, R., Nath Thatoi, D., Choudhury, S., Patnaik, P. (2019). Design and numerical analysis of spur gear using SolidWorks simulation technique. Materials Today: Proceedings, 41(Part 2): 340-346. https://doi.org/10.1016/j.matpr.2020.09.554
[29] Ibrahim, S., Alkali, B., Oyewole, A., Alhaji, S.B., Abdullahi, A.A., Aku, I.A. (2020). Preliminary structural integrity investigation for quadcopter frame to be deployed for pest control. In Conference: Mechanical Engineering Research Day 2020, Kampus Teknology UTeM Malaysia.
[30] Prasetyo, S.D., Prabowo, A.R.A.R., Arifin, Z. (2023). The use of a hybrid photovoltaic/thermal (PV/T) collector system as a sustainable energy-harvest instrument in urban technology. Heliyon, 9(2): 13390. https://doi.org/10.1016/j.heliyon.2023.e13390
[31] Prasetyo, S.D., Prabowo, A.R., Arifin, Z. (2022). Investigation of thermal collector nanofluids to increase the efficiency of photovoltaic solar cells. International Journal of Heat and Technology, 40(2): 415-422. https://doi.org/10.18280/ijht.400208
[32] Arifin, Z., Prasetyo, S.D., Prabowo, A.R., Tjahjana, D.D.D.P., Rachmanto, R.A. (2021). Effect of thermal collector configuration on the photovoltaic heat transfer performance with 3D CFD modeling. Open Engineering, 11(1): 1076-1085. https://doi.org/10.1515/eng-2021-0107
[33] Hocine, H.B.C.E., Touafek, K., Kerrour, F., Haloui, H., Khelifa, A. (2015). Model validation of an empirical photovoltaic thermal (PV/T) collector. Energy Procedia, 74: 1090-1099. https://doi.org/10.1016/j.egypro.2015.07.749
[34] Ni, K., Fang, H., Yu, Z., Fan, Z. (2019). The velocity dependence of viscosity of flowing water. Journal of Molecular Liquids, 278: 234-238. https://doi.org/10.1016/j.molliq.2019.01.055
[35] Nituca, C., Chiriac, G., Cuciureanu, D., Zhang, G., Han, D., Plesca, A. (2018). Numerical analysis of a real photovoltaic module with various parameters. Modelling and Simulation in Engineering, 2018: 7329014. https://doi.org/10.1155/2018/7329014
[36] Kasaeian, A., Khanjari, Y., Golzari, S., Mahian, O., Wongwises, S. (2017). Effects of forced convection on the performance of a photovoltaic thermal system: An experimental study. Experimental Thermal and Fluid Science, 85: 13-21. https://doi.org/10.1016/j.expthermflusci.2017.02.012
[37] Mohamed, M.H., Ali, A.M., Hafiz, A.A. (2015). CFD analysis for H-rotor Darrieus turbine as a low speed wind energy converter. Engineering Science and Technology, an International Journal, 18(1): 1-13. https://doi.org/10.1016/j.jestch.2014.08.002
[38] Mulyana, T., Sebayang, D., Rafsanjani, A.M.D., Adani, J.H.D., Muhyiddin, Y.S. (2017). Mesh control information of windmill designed by Solidwork program. IOP Conference Series: Materials Science and Engineering, 277(1): 012010. https://doi.org/10.1088/1757-899X/277/1/012010
[39] Anders, K. (2017). Resolution of students t-tests, ANOVA and analysis of variance components from intermediary data. Biochemia Medica, 27(2): 253-261. https://doi.org/10.11613/BM.2017.026
[40] Refaningati, T., Nahry, Tangkudung, E.S.W., Kusuma, A. (2020). Analysis of characteristics and efficiency of smart locker system (Case study: Jabodetabek). Evergreen, 7(1): 111-117. https://doi.org/10.5109/2740966
[41] Al-Alwani, M.A.M., Ludin, N.A., Mohamad, A.B., Kadhum, A.A.H., Baabbad, M.M., Sopian, K. (2016). Optimization of dye extraction from Cordyline fruticosa via response surface methodology to produce a natural sensitizer for dye-sensitized solar cells. Results in Physics, 6: 520-529. https://doi.org/10.1016/j.rinp.2016.08.013
[42] Sardouei, M.M., Mortezapour, H., Jafari Naeimi, K. (2018). Temperature distribution and efficiency assessment of different PVT water collector designs. Sādhanā, 43(6): 84. https://doi.org/10.1007/s12046-018-0826-x