Hua Bai![]() | Wangying Kong
| Wangying Kong![]() | Zhengyong Wang
| Zhengyong Wang![]() | Lixia Tian*
| Lixia Tian*![]()
© 2023 IIETA. This article is published by IIETA and is licensed under the CC BY 4.0 license (http://creativecommons.org/licenses/by/4.0/).
OPEN ACCESS
Amid the escalating global focus on renewable energy, Multi-Energy Systems (MES) within distribution networks have emerged as crucial facilitators in addressing diverse energy requirements. This study delves into the collaborative interplay among energy sources, storage, and load within these networks, with a specific accent on electrical storage mechanisms. By evaluating interactions between renewable sources such as wind and solar, storage units, predominantly battery-based, and diverse loads like buildings and transportation, an integrated model is proposed. Both the first and second laws of thermodynamics are imposed as constraints on the MES operations within these networks. The effect of these thermodynamic laws, intertwined with electrical storage tactics, on overall thermodynamic efficiency is extensively detailed. Preliminary results have shown that, under certain circumstances, the adoption of well-defined source-storage-load synergistic strategies within distribution networks can significantly amplify the system's operational efficiency whilst maintaining a consistent energy supply. The insights derived from this investigation provide invaluable guidance to both designers and decision-makers in the realm of multi-energy systems within distribution networks, propelling the investigative nexus between thermodynamics and energy distribution systems.
thermodynamics, multi-energy systems, distribution network, economic cost, thermodynamic efficiency, synergistic strategy
With surging global energy consumption and urgent calls for environmental stewardship, Multi-Energy Systems (MES) have risen as a pivotal research focus within distribution network studies [1-4]. By synergising a plethora of energy resources, these systems are observed not only to augment energy utilisation efficiency but also to counter the intermittency and instability inherent to renewable sources [5, 6]. In this context, the capabilities exhibited by MES in distribution networks-especially in ensuring reliability and catering to diverse energy needs-appear significant [7-9]. Nonetheless, achieving the optimal function of MES, especially under thermodynamic constraints, remains a subject of ongoing investigation.
The introduction of the Source-Storage-Load synergy strategy is posited as a solution that views energy conversion, storage, and consumption processes in MES through an integrated lens [10, 11]. When applied within distribution networks, this strategy is believed to markedly enhance system performance, ensuring energy supply stability whilst attenuating environmental and economic detriments [12-15]. A particular emphasis on thermodynamics, especially the adherence to the first and second laws, has been found to provide deeper insights into the functioning of MES, underpinning the path to higher efficiencies both thermodynamically and economically.
Yet, while the importance of the Source-Storage-Load synergy strategy is widely recognised and has spurred expansive investigations, the neglect of thermodynamic constraints in many practical applications can potentially diminish MES efficiency [16-19]. Traditional research methodologies, at times, seem to fixate on singular technical or economic metrics, bypassing an exhaustive assessment of the entire system. Such methodologies might be ill-equipped to address the multifaceted and evolving energy requirements within distribution networks [20-22]. Moreover, detailed studies that consider the effects of individual MES subsystems on the overarching system's thermodynamic efficiency and economic attributes are notably scant.
Within the scope of this research, an in-depth evaluation of the thermodynamic efficiency and economic costs associated with different MES subsystems is undertaken. Building on this analysis and integrating the primary thermodynamic laws, the ramifications of these subsystems on the comprehensive performance of MES in distribution networks are dissected. Furthermore, an innovative optimal economic scheduling model under the Source-Storage-Load synergy strategy is elucidated, holding potential for real-world applications and shaping the theoretical groundwork for subsequent MES investigations.
Multi-Energy Systems (MES) comprise numerous subsystems, each tailored to address dynamic energy demands. It has been noted that the performance attributes, both thermodynamic and economic, of individual subsystems can significantly influence the collective efficiency and cost-effectiveness of MES. Consequently, the estimation of thermodynamic efficiency and the associated economic costs for each subsystem within MES has been deemed critical. Through these estimations, distinctions between optimally-performing subsystems and those requiring enhancements under prevailing operational conditions are drawn. Such findings are instrumental in the conception of refined energy management strategies, bolstering overall MES efficiency. Furthermore, awareness of the economic implications linked to each subsystem can illuminate the most economically viable operational point of the system as a whole. Such awareness not only holds promise for curtailing operational expenses but also provides pivotal guidance on the most cost-beneficial Source-Storage-Load synergy strategies. It is thereby suggested that a delicate balance between energy supply and demand can be achieved, ensuring a steadfast, efficient, and economically sound operation of the system.
2.1 Definition of thermodynamic efficiency in MES subsystems
Figure 1. Schematic of multi-energy system
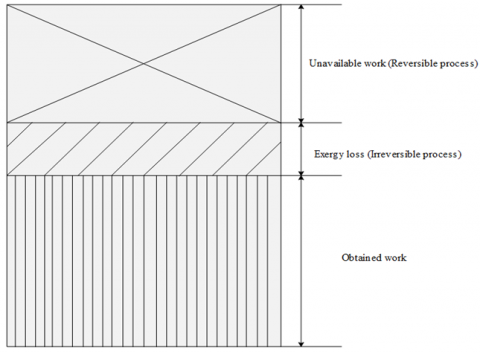
Figure 2. Relationship between first law efficiency and exergy efficiency
In Figure 1, a schematic representation of the Multi-Energy System (MES) is depicted. It is discerned that MES comprises various subsystem categories, which include production, storage, conversion, and load subsystems. Within the production subsystem, energy is generated from a multitude of sources, such as wind, solar, thermal power, and other sustainable energy modalities. Its thermodynamic efficiency is characterised by the proficiency at which unit input energy (e.g., fuel, wind, sunlight) is transmuted into utilitarian energy forms (e.g., electricity). This definition inherently integrates the economic expenses per unit output and any environmental or technical restrictions. The storage subsystem, dedicated to conserving surplus energy for prospective utilisation, employs mechanisms like batteries, thermal storage, or compressed air energy storage. The efficiency for this subsystem is derived from the proportion of utilitarian energy reclaimed from storage to the energy originally consigned, whilst contemplating the economic implications of energy conservation and retrieval. The task of the conversion subsystem lies in transfiguring one energy modality into another, exemplified by cogeneration systems or electrothermal converters. The thermodynamic efficiency here is gauged by the proficiency at which unit input energy undergoes transformation into a distinct useful energy form, incorporating both economic and technical constraints. The load subsystem epitomises the MES's terminal beneficiaries, spanning residential, commercial, and industrial sectors. Its thermodynamic efficiency is delineated by the proportion of energy requisitioned to fulfil end-user requirements to the energy proffered by the system. This assessment concurrently assimilates economic outlays and conceivable efficiency detriments when accommodating these requisites.
While, an association between First Law Efficiency and Exergy Efficiency is illustrated in Figure 2. The protocol to ascertain the overarching thermodynamic efficiency of the MES, grounded on the exergy efficiency appraised for each subsystem, emanates from the collective application of energy conservation and thermodynamic tenets. For multi-energy systems, distinctive functions and efficiencies are inherent to each subsystem. The cumulative thermodynamic efficiency of the total system materialises as an aggregate of these discrete efficiencies. Thermodynamic efficiency is typically segregated into First Law Efficiency and Second Law Efficiency. Given that exergy (or the peak work potential) is symbolised by RW and the aggregate system energy by W, the stipulation for First Law Efficiency can be articulated as Eq. (1):
${{\lambda }_{1}}=\frac{{{R}_{W}}}{W}$ (1)
Given that the actual work performed by the system is symbolised by M, the Second Law Efficiency (often termed exergy efficiency) is delineated in Eq. (2):
${{\lambda }_{2}}=\frac{M}{{{R}_{W}}}$ (2)
As depicted in Figure 2, an intricate interrelation between First Law Efficiency and exergy efficiency becomes evident. In the evaluation of exergy efficiency, attention is not solely directed towards energy conversion efficiency but also incorporates an assessment of economic feasibility. It is therefore deduced that a particular subsystem, even with commendable thermodynamic efficiency, may have its contribution to the overarching system's exergy efficiency attenuated if accompanied by exorbitant economic costs. Consequently, the holistic thermodynamic efficiency of MES materialises as an amalgamation of individual subsystem exergy efficiencies. To elucidate, consider a scenario where energy traverses from the production subsystem, through storage and conversion processes, to eventually cater to a load. In this instance, the cumulative efficiency manifests as a product of the efficiencies intrinsic to each of these subsystems. Within MES, potential interplays between subsystems can either bolster or diminish the global efficiency. An illustrative example might be where surplus heat, emanating from the production subsystem, is opportunistically harnessed by the conversion subsystem for alternate applications, culminating in an enhancement of the system-wide efficiency.
2.2 Thermoeconomic cost analysis in MES subsystems
The comprehensive cost inherent to a Multi-Energy System (MES) not only envelops direct energy expenditures, stemming from energy production, conversion, transmission, and utilisation, but also encapsulates an array of non-energy expenses. The inclusion of these non-energy costs proves indispensable when gauging the economic feasibility, viability, and long-term sustainability of MES undertakings. Such costs may emerge from distinct geographical, technological, market-based, and regulatory factors and are susceptible to temporal variations. Within the MES paradigm, salient non-energy costs encompass: 1) Equipment and infrastructure capital costs, addressing the preliminary acquisition and commissioning charges of all essential MES components; 2) Operational and maintenance overheads, encompassing regular surveillance, preservation, and refurbishment outlays; 3) Ecological and health-impacting costs, arising from potential detrimental consequences on both the environment and public health due to MES operations; 4) Regulatory and conformance expenses, unforeseen levies possibly required to secure indispensable approvals, accreditations, or to align with specific environmental or technical benchmarks.
In relation to energy expenditures, the partitioned matrix methodology is employed for the thermoeconomic analysis of MES subsystems. This technique begets a structured dissection of interconnections and cooperative dynamics inherent in sophisticated multi-energy networks. Subsystems within the MES are initially demarcated based on their intrinsic functions and attributes, leading to the depiction of both thermoefficiency and economic cost metrics of each subsystem in the form of matrices—subsequently structured as partitioned matrices. Every block matrix resonates with a specific subsystem or the interplay amongst them. Given that an MES consists of l subsystems, l equilibrium equations are postulated, culminating in a matrix representation as:
$S\times \sigma +V=0$ (3)
For each subsystem, energy flows (both input and output) and their associated exergy costs are defined, taking into account factors such as energy conversion efficiency, unit energy cost, and operational expenses. Furthermore, (b-l) supplementary equations are constructed to complete the matrix full-rank computation:
$\beta \times \sigma -\left[ {{v}_{\gamma }}\gamma \right]=0$ (4)
Relationships based on thermoeconomic principles are established for each subsystem block, linking energy flows with cost flows. This might encompass efficiency, losses, return on investment, and other parameters. Subsequently, a (b-b) computational matrix is formed:
${{S}^{*}}\times \sigma +{{V}^{*}}=0$ (5)
where:
${{V}^{*}}=\left[ \begin{align} & V \\ & -{{v}_{\gamma }}\gamma \\\end{align} \right]$ (6)
Interactions between subsystems, such as energy transfer, sharing, or synergistic effects, are integrated into the partitioned matrix. This might necessitate considering efficiency losses, extra costs, or cost savings during the interaction processes. If S is reversible, then:
$\sigma =-{{S}^{*-1}}\times {{V}^{*}}$ (7)
Matrix computational methods, like matrix multiplication or matrix inversion, are employed to consolidate all subsystem blocks, leading to the derivation of the overall MES thermoeconomic cost matrix, as expressed by:
${{\sigma }^{*}}=-{{\left( {{R}_{F}} \right)}^{*-1}}\times {{S}^{*-1}}\times {{V}^{*}}$ (8)
For MES subsystems, thermoeconomic cost allocation aims to provide a detailed depiction and analysis of the economic burden brought about by each energy flow (or exergy flow). By allocating the thermoeconomic costs to the exergy flows, insights can be gained into which energy flows are efficient yet costly and which are less efficient but more economical. It also provides decision-makers with explicit energy and non-energy cost data to better manage and optimise the MES.
Assuming the MES subsystem u has k exergy flows, the specific exergy cost for u can be defined as the average unit price of all input exergy flows for u, expressed as:
$\overline{{{R}_{u}}}=\frac{\sum{{{R}_{u,k}}{{c}_{u,k}}}}{\sum{{{R}_{u,k}}}}$ (9)
Further, the specific non-energy cost for u can be determined using:
$\overline{{{V}_{bu}}}=\frac{\sum{{{V}_{bu}}}}{\sum{{{R}_{u,k}}}}$ (10)
Using the causality-based allocation method, the total cost is allocated to each exergy flow. Thus, the unit commission cost for the kth exergy flow in u can be computed as:
$\overline{{{v}_{u,k}}}=\frac{\overline{{{R}_{u}}}+\overline{{{V}_{bu}}}}{{{\lambda }_{u,k}}}$ (11)
Furthermore, given:
$\overline{{{v}_{u,k}}}={{\alpha }_{u,k}}{{v}_{ub}}$ (12)
It follows that:
${{\alpha }_{u,k}}=\frac{\overline{{{v}_{u,k}}}}{{{v}_{b}}}=\frac{\overline{{{R}_{u}}}+\overline{{{V}_{bu}}}}{{{\lambda }_{u,k}}{{v}_{ub}}}$ (13)
Assuming specific energy costs are represented by vu and specific non-energy costs by Vbu. From the aforementioned computational process, it becomes evident that vu, Vbu, exergy efficiency, and input exergy unit price collectively determine the growth factor of the unit exergy cost for the kth output flow in u. Its value is directly proportional to the total cost and inversely proportional to the exergy efficiency.
To counteract the burgeoning reliance on a spectrum of energy sources and fortify the efficacy, resilience, and reliability of energy, an optimal economic scheduling model is proposed herein. This model aims to attenuate the aggregate operational expenditure of the Multi-Energy System (MES). Emphasis is concurrently placed on the inception of a source-storage-load collaboration strategy, thereby broadening the investigative scope. While economic advantages remain paramount, efficient harnessing of renewable energy sources is also given due consideration.
The formulation of the optimal economic scheduling model, under the aegis of the source-storage-load collaboration strategy, necessitates a holistic overview of MES operations. It is imperative to foster harmony amongst the subsystems, optimizing collective benefits. Costs integrated within this model are expected to encompass the operational outlays of individual MES subsystems, paired with the distribution grid's network loss expenses. Simultaneously, economic repercussions stemming from wind energy curtailments must be contemplated, ensuring the renewable energy's judicious deployment and negating potential wastage, especially when confronted with surges in load demands or storage thresholds. Acknowledging the mutable nature of energy demand, yield, and retention, adaptability to fluctuating operational scenarios is deemed essential for the model.
In sculpting the model's objective function, the paramount goal remains the reduction of MES's operational expenditure. Distinct optimisation targets have been delineated as:
(1) Curtailment of aggregate operational cost: This amalgamates the operational overheads of individual MES subsystems with the distribution grid's network loss charges.
(2) Reduction of wind curtailment penalties: It is essential to mitigate wind energy wastage arising from exceeded load requirements or storage limits.
(3) Ensuring equilibrium between supply and demand: It is stipulated that the MES's cumulative energy output should perpetually resonate with the totality of load requisites.
(4) Refinement of energy storage dynamics: This encompasses the prudent management of energy storage and retrieval, bearing in mind the constraints on storage magnitude and conversion prowess.
Assuming that within the operational cycle of the system, the cost of network losses in the distribution grid is represented by VLO. The operational costs of Type I, II, and III energy transfer stations, as well as the penalty costs for wind curtailment, are denoted by VRAI, VRAII, VRAIII and VQY respectively. The total number of time intervals is denoted by By. The electricity and natural gas prices for interval y are represented by Vry and Vhy respectively. The network losses in the distribution grid for interval y are indicated by OLOy. For interval y, the gas intake rate and power transferred to the grid from the Type I energy transfer station at node u of the thermal network are represented by CVGOu,y and MVGO,ru,y respectively. The power from the Type II energy transfer station at node u of the thermal network for interval y is denoted by OGO,ru,y. The gas intake rate of the Type III energy transfer station at node u of the thermal network for interval y is expressed by CGNu,y. The power of the energy transfer station pump at node u of the thermal network for interval y is represented by PVOu,y. The wind curtailment penalty coefficient for interval y is represented by ψQYy. For interval y, the maximum and actual power generation of the jth wind turbine is denoted by O-QYj,y and OQYj,y respectively. The sets of distribution grid nodes and wind turbines are represented by Гrb and ГQY respectively.
Considering the absorption of renewable energy, this paper introduces the wind curtailment volume as a penalty term in the objective function, and the expression for the objective function is given in the following equation.
$\begin{align} & MIN\ {{V}^{TO}}={{V}^{LO}}+V_{I}^{RA}+V_{II}^{RA}+V_{III}^{RA}+{{V}^{QY}} \\ & {{V}^{LO}}=\sum\limits_{Y=1}^{{{B}_{y}}}{\left( V_{y}^{r}\cdot O_{y}^{LO}\cdot \Delta y \right)} \\ & V_{U}^{RA}=\sum\limits_{y=1}^{{{B}_{y}}}{\left( \sum\limits_{u\in \Gamma _{b}^{RA}}{\left( V_{y}^{h}\cdot C_{i,t}^{VGO}-V_{y}^{r}\cdot C_{u,y}^{VGO,r}+V_{t}^{e}\cdot C_{u,y}^{VO} \right)\cdot \Delta y} \right)} \\ & V_{II}^{RA}=\sum\limits_{y=1}^{{{B}_{y}}}{\left( \sum\limits_{u\in \Gamma _{b}^{EA}}{\left( V_{y}^{r}\cdot O_{u,y}^{GO}+V_{y}^{r}\cdot O_{u,y}^{VO} \right)\cdot \Delta y} \right)} \\ & V_{III}^{RA}=\sum\limits_{y=1}^{{{B}_{y}}}{\left( \sum\limits_{u\in \Gamma _{b}^{RA}}{\left( V_{y}^{h}\cdot O_{u,y}^{HN}+V_{y}^{r}\cdot O_{u,y}^{VO} \right)\cdot \Delta y} \right)} \\ & {{V}^{QY}}=\sum\limits_{y=1}^{{{B}_{y}}}{\left( \sum\limits_{u\in \Gamma _{b}^{RA}}{\left( \psi _{y}^{QY}\cdot \left( \bar{O}_{j,y}^{QY}-O_{j,y}^{QY} \right) \right)\cdot \Delta y} \right)} \\\end{align}$ (14)
The constraints associated with the aforestated objective function fall into four significant categories as depicted in Figure 3:
Figure 3. Constraints and objective function of the MES system
(1) Distribution Grid Constraints
Every node, commonly referred to as a bus, within the distribution grid operates within a designated voltage range, typically dictated by equipment safety and operational standards. Should the voltage at a node exceed this permissible range, it poses potential harm to the equipment and load connected to said node, even possibly resulting in equipment failure. Furthermore, deviations of voltage from its nominal value can also compromise grid stability and impede the regular operation of the load. Ensuring that all node voltages are maintained within a safe bracket is thus imperative. Let the upper and lower limit values of phase o voltage at the u-th node of the distribution grid be represented by C-ou and Cou respectively. The constraint for node voltage is given by:
$\underline{C}_{u}^{o}\le C_{u,y}^{o}\le V_{u,y}^{o}\begin{matrix} {} \\\end{matrix}\forall u\in \Gamma _{b}^{r},y\in {{\Gamma }_{y}},o\in \left[ s,n,v \right]$ (15)
Each transmission line or connector within the distribution grid has a designed maximum power transfer capability, determined by the physical properties of the line, material, and design standards. An exceedance of this rated value in actual power transfer can result in overheating, reducing its lifespan and, in extreme instances, causing failure. Excessive power transfer might also lead to voltage drops or issues with grid stability. Monitoring and constraining power transfer on these lines are thus essential. Let the set of transmission lines in the distribution grid be denoted by Гrb, and the actual power transfer and permissible maximum power transfer on the n-th line of phase o in the grid be represented by A.on,y and A.on respectively. The constraint for power transfer on grid lines is provided by:
$\left| \dot{A}_{n,y}^{o} \right|\le \bar{A}_{n}^{o}\begin{matrix} {} \\\end{matrix}\forall n\in \Gamma _{m}^{r},o\in \left[ s,n,v \right]$ (16)
At any node within the distribution grid, abiding by the law of energy conservation, the aggregate power injected into the node from various incoming lines should equate the sum of powers flowing out to the respective outgoing lines. This ensures no energy loss or gain in the system, merely transfers. Any deviations from this equilibrium may suggest underlying issues, such as equipment malfunctions or measurement inaccuracies, potentially undermining the grid's efficiency and stability. Let the active power at the balancing node of the distribution grid during time interval y be symbolised by Ohfy, and its permissible minimum value be denoted by Ohfy The constraint for power at the grid's balancing node is described by:
${{O}^{hf}}\le O_{y}^{hf}\begin{matrix} {} \\\end{matrix}\forall y\in {{\Gamma }_{y}}$ (17)
(2) Thermal Network Constraints
Within a thermal network, energy is transmitted from one location to another through the flow of heat. Each transmission pathway, be it a pipeline or another medium, possesses a maximum heat transfer capability defined during its design phase. This signifies that when the heat traversing these routes exceeds this stipulated value, damage to materials might ensue, or there might be an increase in heat loss or a decline in thermal transfer efficiency. Hence, maintaining heat levels within these confines is crucial for preserving the system's long-term stability and efficiency. Assuming the maximum permissible water pressure loss per unit length for the n-th heating and return water pipeline is represented by Δo-an and Δo-en respectively, the constraint for water pressure drop in the thermal network pipeline is articulated by:
$\left\{ \begin{align} & \left| {\Delta o_{n,y}^{a}}/{{{M}_{n}}}\; \right|\le \Delta \overline{o}_{n}^{a}\begin{matrix} {} \\\end{matrix}\forall n\in \Gamma _{p}^{ga},y\in {{\Gamma }_{y}} \\ & \left| {\Delta o_{n,y}^{e}}/{{{M}_{n}}}\; \right|\le \Delta \overline{o}_{n}^{e}\begin{matrix} {} \\\end{matrix}\forall n\in \Gamma _{o}^{ge},y\in {{\Gamma }_{y}} \\\end{align} \right.$ (18)
(3) Energy Transfer Station Constraints
Energy transfer stations incorporate components such as energy conversion equipment, circulating water pumps, and PHEs. The energy conversion equipment presents therein each has distinct input-output characteristics and operational ranges. Conversion efficiency of these devices may vary with load alterations, and they usually have both minimum and maximum operational points. Furthermore, activation and deactivation of these devices might demand additional energy and time, all of which must be taken into account. Operating away from optimal points could result in unwarranted wear and inefficiency of the device. It's therefore essential to consider these constraints in scheduling to ensure device longevity and efficient performance. Let the upper and lower bounds for CHP operational power at the u-th node's I energy transfer station in the thermal network be denoted by O-VGOu and OVGO-u, the upper and lower bounds for CHP ramp rate at this station by ΔO-VGOu and ΔOVGO-u, the upper and lower bounds for HP operational power at the u-th node's II energy transfer station by O-GOu and OGO-u and the upper and lower bounds for GB operational power at this station by O-HNu and OHN-u. The constraints required for the safe, standard operation of energy conversion devices are described by:
$\left\{ \begin{align} & \underline{O}_{u}^{VGO}\le O_{u,y}^{VGO}\le \overline{O}_{u}^{VGO} \\ & \underline{\Delta O}_{u}^{VGO}\le \Delta O_{u,y}^{VGO}\le \Delta \overline{O}_{u}^{VGO} \\ & \underline{O}_{u}^{GO}\le O_{u,y}^{GO}\le \overline{O}_{u}^{GO} \\ & \underline{O}_{u}^{HN}\le O_{u,y}^{HN}\le \overline{O}_{u}^{HN} \\\end{align} \right.\forall U\in \Gamma _{b}^{RA},y\in {{\Gamma }_{y}}$ (19)
Plate Heat Exchangers (PHE) are efficient thermal exchange devices commonly found within energy transfer stations. Their performance depends on the properties of the fluid, flow rate, inlet and outlet temperatures, and the design and arrangement of the plates. PHEs have designed maximum and minimum temperature and pressure differentials. Operating outside these bounds might lead to device damage or reduced efficiency. Moreover, for specific cooling or heating fluid demands, ensuring that the PHE operates within its optimal performance range is of paramount importance. Assuming the upper and lower bounds for the mass flow rate of water entering the thermal network at the u-th node PHE are represented by l-OGRu and lOGR-u, the constraint for the PHE is stated by:
$\underline{l}_{u}^{NYZ}\le l_{u,y}^{NYZ}\le \overline{l}_{u}^{NYZ}\begin{matrix} {} \\\end{matrix}\forall u\in \Gamma _{b}^{RA},y\in {{\Gamma }_{y}}$ (20)
Circulating water pumps, prevalent in energy transfer stations for heat transfer purposes, have operational efficiency and performance linked to their operational load and speed. Pumps possess optimal operational points as well as maximum and minimum operational ranges. Surpassing or undercutting these ranges might result in the pump's inefficient functioning, overheating, or other potential complications. Additionally, the start and stop operations of these pumps require consideration, as frequent cycling might lead to excessive wear and augmented energy consumption. Let the upper limit of the circulating pump's operational power at the u-th node in the thermal network be symbolised by O-VOu. The constraint essential for the standard operation of the circulating water pump is given by:
$0\le O_{u,y}^{VO}\le \bar{O}_{u}^{VO}\begin{matrix} {} \\\end{matrix}\forall u\in \Gamma _{b}^{RA},y\in {{\Gamma }_{y}}$ (21)
(4) Constraints on Secondary Heat Exchangers and Building Virtual Energy Storage Systems
Secondary heat exchangers in the MES serve as intermediaries, receiving heat from the primary energy supply and transferring it to end users or other systems. The operational efficiency, heat transfer rate, and heat loss of these exchangers are influenced by various factors such as fluid flow rate, fluid properties, inlet and outlet temperatures, and the design and material of the heat exchanger itself. These exchangers have their optimal operating points, as well as maximum and minimum operating ranges. Operating outside these ranges may lead to a decrease in equipment efficiency or a shortened lifespan. To ensure stable and efficient heat exchange, it is essential that secondary heat exchangers always operate within their permissible range. Under the volume regulation mode, the upper and lower limits of the water flow mass flow rate entering the SHE at the u-th node of the thermal network are represented by l-AGRu and lAGR-u, respectively. Under the quality regulation mode, the heat energy flow power entering and exiting the SHE during the y-period is represented by GAGR+u,y and GAGR-u,y. The constraints required for the normal operation of the secondary heat exchanger under different thermal network operating modes are as follows:
$\begin{align} & \underline{l}_{u}^{AGR}\le l_{u,y}^{AGR}\le \overline{l}_{u}^{AGR}\begin{matrix} {} \\\end{matrix}\forall u\in \Gamma _{b}^{ga},y\in {{\Gamma }_{y}},under\ CD-VY \\ & G_{u,y}^{AGR-}\le G_{u,y}^{AGR+}\begin{matrix} {} \\\end{matrix}\forall u\in {{\Gamma }_{y}},under\ VD-CY \\\end{align}$ (22)
Building virtual energy storage systems utilize the thermal capacity of buildings themselves to temporarily store or release heat energy, thereby smoothing out fluctuations in energy demand and enhancing the overall efficiency of the system. The operation of such systems is constrained by many factors, such as the thermal capacity of the building, external weather conditions, activity patterns inside the building, and thermal control strategies. These virtual storage systems have maximum and minimum thermal storage and release capabilities. Moreover, indoor temperature constraints must be considered to ensure comfort within the building. Frequent heat injections or releases might lead to fluctuations in indoor temperatures, affecting the comfort of the inhabitants or users. Therefore, when operating such systems, a holistic approach is essential to ensure system efficiency while maintaining indoor environmental quality.
Figure 4. Strategy generation process for source-storage-load collaboration in multi-energy systems
Figure 4 delineates the generation process of the source-storage-load collaboration strategy in multi-energy systems. Through the application of optimization algorithms to the constructed model, the optimal scheduling strategy for each time interval is ascertained, encompassing device outputs, storage statuses, and more. Upon analysing the model's results, strategies for harmonised operation of source-storage-load are deduced. This entails determining the optimal energy sources for specific periods, designating when storage devices should undergo charging or discharging, and identifying which loads require adjustments based on system status. The viability and impact of this strategy can be corroborated using historical datasets or a simulated milieu. Discrepancies between model predictions and real-world situations are critically evaluated, prompting requisite refinements and further optimization. The harmonised source-storage-load strategy is subsequently relayed to the in-situ control system for tangible deployment. Activities, ranging from modulating the output of generative devices, orchestrating the charge/discharge dynamics of storage apparatuses, to executing demand responses for particular loads, are executed in alignment with this strategy. Through this meticulous process, a scientifically robust source-storage-load coordination strategy is devised, promising heightened practicality and reliability in operational environments, thereby amplifying the economic advantages, stability, and dependability of the overarching MES system.
Table 1. Thermoeconomic evaluation of MES subsystems post-exergy reduction coefficient incorporation
|
Subsystem |
Unit Exergy Cost |
Unit Non-Energy Cost |
Unit Thermo-Economic Cost |
|
S1 |
86.23 |
4.68 |
93.21 |
|
S2 |
14.69 |
3.62 |
19.36 |
|
S3 |
22.38 |
11.25 |
32.15 |
|
S4 |
0 |
101.28 |
101.25 |
|
S5 |
0 |
82.36 |
82.36 |
|
S6 |
82.38 |
4.23 |
84.56 |
|
S7 |
3894.12 |
1.36 |
3648.23 |
|
S8 |
4235.02 |
2.85 |
4258.23 |
|
S9 |
81.26 |
1.95 |
83.25 |
|
S10 |
0 |
16.32 |
16.37 |
Table 2. Allocation of thermoeconomic costs for MES's thermal energy following exergy reduction coefficient adoption
|
Heating Method |
Unit Exergy Cost |
Unit Non-Energy Cost |
Unit Thermo-Economic Cost |
|
Coal heating |
88.36 |
4.68 |
91.23 |
|
Geothermal heating |
0 |
101.23 |
101.56 |
|
Gas heating |
3892.23 |
1.36 |
3895.47 |
|
Solar heating |
0 |
16.32 |
16.54 |
|
Electric heating |
12936.88 |
2.98 |
12358.23 |
Table 3. Thermoeconomic cost distribution of MES's gas post-exergy reduction coefficient incorporation
|
Combustion Method |
Unit Exergy Cost |
Unit Non-Energy Cost |
Unit Thermo-Economic Cost |
|
Coal combustion |
16.25 |
3.62 |
19.23 |
|
Gas supply |
82.47 |
4.23 |
84.25 |
An examination of the data in Table 1 provides insights into the thermoeconomic circumstances of each subsystem within the MES. It is evident that Subsystem S8 incurs the maximum unit thermoeconomic expense, amounting to 4258.23, whereas Subsystem S10 registers the minimum at 16.37. Notably, Subsystems S4, S5, and S10 bear a unit exergy expense of zero, signifying their thermoeconomic costs derive exclusively from non-energy related expenses. This could indicate a primary association of these subsystems with managerial tasks, upkeep, or other predetermined costs. The pronounced unit exergy expenditures for Subsystems S7 and S8, overshadowing those of other subsystems, suggest potential elevated heat dissipation or efficiency decrements during energy modulation or conveyance. In the case of a majority of the subsystems, non-energy costs constitute a minor fragment of the aggregate thermoeconomic expense, with the notable exceptions being S4 and S5, where such costs are preeminent.
The information presented in Table 2 facilitates an understanding of the thermoeconomic expenditures associated with distinct heating techniques in the MES. It becomes apparent that electrical heating presents the peak unit thermoeconomic expense, calculated at 12358.23, potentially stemming from pronounced energy utilisation and efficiency detriments during the transmutation of electricity into heat. In contrast, solar heating registers the nadir in unit thermoeconomic expenditure, pegged at 16.54, attributable, perhaps, to sunlight's inherent nature as a gratuitous and inexhaustible energy medium. While geothermal heating manifests a unit exergy expense of nil, its non-energy expenditure is noticeably elevated, approximating 101.23, thereby suggesting that despite the cost-free character of geothermal energy, affiliated infrastructural and maintenance obligations can be substantial. Contrarily, both gas and electric heating depict relatively subdued non-energy costs, but their unit exergy expenditures significantly exceed those of other heating modalities, perhaps due to heightened energy expenses or diminished transmutation efficiencies. For solar heating, non-energy expenditures occupy a sizeable segment of its cumulative thermoeconomic outlay, potentially linked to the inception, regular maintenance, and wear of solar collectors. Conversely, unit exergy expenditures for gas and electric heating form a salient fraction of their aggregate thermoeconomic cost, highlighting elevated costs in energy modulation or accrual. Thus, an evaluation predicated solely on the overt costs of energy might prove inadequate. Non-energy charges, encompassing maintenance, infrastructure, and apparatus degradation, equally influence the composition of heating expenses.
Table 3 elucidates the thermoeconomic costs associated with distinct combustion techniques within the MES. As evident from the data, coal combustion features a modest unit exergy cost of 16.25, with its non-energy costs, positioned at 3.62, making up a lesser segment of the comprehensive thermoeconomic outlay. This observation implies that coal, being a conventional energy medium, typically incurs reduced direct energy expenditures. However, it's crucial to factor in ancillary expenses, such as those related to equipment, logistics, and upkeep. Conversely, the unit exergy cost associated with gas supply stands elevated at 82.47, while its non-energy counterpart, 4.23, is relatively on par with coal combustion. Such a cost structure might stem from either the heightened intrinsic cost of gas or potential inefficiencies in its procurement and distribution phases. When viewed through the prism of thermoeconomics, coal combustion emerges as a more cost-efficient alternative in comparison to gas supply, underscoring its economic viability. Measures to revitalize gas supply, such as bolstering its transmutation efficiency, curtailing inherent energy expenses, or tapping into more economically viable supply conduits, could serve to pare down its thermoeconomic outlay.
A deep dive into Table 4 offers insights into the thermoeconomic costs underpinning diverse electricity generation modalities in the MES. The data underscores that among the methodologies, electric power generation bears the steepest unit thermoeconomic cost at 185.23, whereas solar power generation reflects the lowest, pegged at 32.48. Gas power generation, when juxtaposed against the gamut of methods barring electric power generation, exhibits the peak unit exergy cost, landing at 82.36, although its unit non-energy expenditure remains subdued at 1.78. Intriguingly, both solar and wind power generation register unit exergy costs of zero, indicating their prowess in energy transmutation. However, their corresponding non-energy costs, gauged at 32.12 and 45.36 respectively, likely hint at intrinsic fixed expenditures, potentially tied to equipment deployment, ongoing maintenance, and asset depreciation. In the realm of electric power generation, the method displays the least unit non-energy cost, at 0.81, but its unit exergy cost, towering at 178.26, speaks of either elevated energy-associated costs or diminished conversion efficiency. Drawing from a thermoeconomic vantage point, solar power generation emerges as the standout in terms of cost efficiency, with its costs substantially undercutting the competing methods.
Table 4. Distribution of thermoeconomic costs for MES's electric energy after exergy reduction coefficient application
|
Electricity Production Method |
Unit Exergy Cost |
Unit Non-Energy Cost |
Unit Thermo-Economic Cost |
|
Gas power generation |
82.36 |
1.78 |
83.26 |
|
Solar power generation |
0 |
32.12 |
32.48 |
|
Wind power generation |
0 |
45.36 |
45.86 |
|
Electric power generation |
178.26 |
0.81 |
185.23 |
Table 5. Thermoeconomic cost distribution of MES's cooling post-exergy reduction coefficient incorporation
|
Cooling Method |
Unit Exergy Cost |
Unit Non-Energy Cost |
Unit Thermo-economic Cost |
|
Geothermal cooling |
0 |
82.36 |
82.45 |
|
Gas cooling |
4231.58 |
2.56 |
4268.32 |
|
Electric cooling |
38925.24 |
1.57 |
38956.44 |
Table 6. Technical metrics within the multi-energy system's source-storage-load coordination framework
|
Technical Indicators |
Season |
Optimized Energy Scheduling Strategy |
Virtual Storage Strategy |
Demand Response Strategy |
|
Total energy cost (in thousands) |
Summer |
72354.26 |
97854.23 |
11235.03 |
|
Winter |
139257.69 |
132658.56 |
153645.23 |
|
|
Spring/Autumn |
983265.26 |
112536.48 |
123425.88 |
|
|
Renewable energy proportion |
Summer |
54.32% |
46.36% |
41.23% |
|
Winter |
18.96% |
19.31% |
18.32% |
|
|
Spring/Autumn |
33.86% |
33.86% |
31.42% |
|
|
Grid supply proportion |
Summer |
17.39% |
21.36% |
16.93% |
|
Winter |
17.99% |
19.33% |
25.36% |
|
|
Spring/Autumn |
17.32% |
22.46% |
21.88% |
|
|
CO2 emissions /kg |
Summer |
42356.25 |
55361.25 |
58624.23 |
|
Winter |
89265.46 |
136948.23 |
112456.39 |
|
|
Spring/Autumn |
53236.25 |
62354.28 |
732658.23 |
A scrutiny of Table 5 yields insights into the thermoeconomic costs affiliated with diverse cooling techniques within MES. Electric cooling, with a unit thermoeconomic cost of 38,956.44, stands out as markedly pricier compared to its counterparts—gas cooling at 4,268.32 and geothermal cooling at 82.45. Geothermal cooling, while recording a unit exergy cost of zero, showcases a pronounced non-energy cost at 82.36, likely attributable to inherent fixed expenses tied to the geothermal setup, its upkeep, and depreciation. Gas cooling's elevated unit exergy cost, resting at 4,231.58, juxtaposed against its minimal non-energy expense of 2.56, may allude to potential inefficiencies during energy transformation or heightened gas-related expenditures. Electric cooling, although scoring the most modest unit non-energy cost at 1.57 among the trio, is burdened with an astronomical unit exergy cost of 38,925.24—possibly a reflection of steep electricity costs or diminished cooling efficiency. In light of thermoeconomic considerations, geothermal cooling emerges as the frontrunner in cost-effectiveness. Despite its elevated non-energy expenses, its cumulative cost significantly undercuts the other two methodologies.
Delving into Table 6 unveils the nuances of technical metrics under the multi-energy system's source-storage-load harmonization strategy. On the economic front, the optimized energy orchestration approach garners plaudits across all seasonal variations, shining through with the most economical energy outlays. In the environmental conservation arena, this strategy continues its stellar performance, exemplifying high renewable energy integration and curtailed CO2 emissions. Notably, while the demand response strategy optimizes energy expenditures in summertime, its augmented CO2 output during winter and the transitional seasons could be linked to a predominant reliance on grid energy sources. The virtual storage blueprint delivers a consistent, yet not particularly standout, performance across the spectrum, lacking a decisive edge in any single domain. As a synthesis, the optimized energy scheduling blueprint outperforms in both fiscal prudence and eco-sustainability, positioning it as the favored blueprint for the multi-energy structure. Nonetheless, real-world deployments might necessitate a blend of strategies, contingent on precise circumstances and objectives.
Figure 5 furnishes an in-depth view into the adept electrical power performance within the multi-energy system, steered by the source-storage-load symbiotic approach. Evident from the chart, solar energy (captured by the crimson bar) stands as a chief contributor, illuminating the system between 8 and 20 hours—these timings being symbiotic with sunlight's availability. The electrical flux appears consistent in this stretch, with zeniths gracing the midday interval. Wind energy (depicted by the azure bar) extends its contributions ceaselessly, albeit with intermittent oscillations, highlighting the whimsical nature of wind dynamics. Gas, illustrated through the verdant bar, lends a near-constant voltage across most of the diurnal cycle. Intriguingly, the grid (echoed by the plum-colored bar) predominantly underscores negative contributions, signaling moments when the system diverts power back to the grid. However, during the intervals of 4-8 hours and 12-16 hours, an energy influx from the grid is observed. Battery storage (denoted by the umber bar) exhibits alternating patterns of energy reception and transmission, mirroring its duty of charging during opportune times and discharging during power surges. In sum, this configuration adeptly marries myriad energy streams, aligning them with variegated power demands, capitalizing primarily on solar and wind energies during the sunlit hours. While gas maintains its stature as a reliable power sentinel, the battery storage operates as a versatile mediator, harmonizing the power demand-supply dance.
Figure 6 elucidates the sagacious thermal power orchestration of the multi-energy system when orchestrated by the source-storage-load cooperative blueprint. The portrayal suggests that the gas conduit, embodied by the scarlet bar, reigns supreme as the thermal energy vanguard throughout the clock, with its dominance crescendoing between 12 to 24 hours. The solar thermal channel (represented by the cerulean bar) casts a radiant influence between 4 to 20 hours, harmonizing with daylight's rhythm, and culminating around midday. Electrical heating (mirrored by the emerald bar) pledges allegiance to the system predominantly between the spans of 4-8 hours and 20-24 hours, hinting at strategic utilization of electric influx for thermal augmentation during these hours. An overt surge in thermal demands during 12-24 hours, perhaps a reflection of human routines and escalating building heating mandates, underscores the graph. As such, gas emerges as the linchpin of thermal provision, especially during the later hours, lauded possibly for its steadfastness and economical appeal. Solar thermal provisioning, being both renewable and environmentally congenial, carves its niche during daylight. Electrical heat infusion, acting as the dawn and dusk sentinel, supplements the ensemble when other thermal stalwarts wane or don't match economic feasibility. In its entirety, under the source-storage-load collaborative ethos, the system unfurls an optimized thermal narrative, nimbly navigating the diverse thermic appetites of varying intervals, and melding disparate heat emissaries with finesse.
Figure 7 delineates the nuanced interplay of energy retention and release from the buildings' virtual thermal storage landscapes across distinct thermal network sensing points, harmonized with the ambient variations within. The visual narrative reveals that at sensing point 1 (captured in a serene blue hue), the energy cadence oscillates with vigor throughout the day, most markedly from 08:00 to 20:00, echoing periods of avid energy absorption and dissemination. Sensing point 2, painted in a rich vermilion, traces a rhythm echoing its blue counterpart, albeit with a subdued amplitude in its dance.
Intriguingly, the ambient condition at sensing point 1, charted by the verdant trajectory, awakens at a mellow note, embarking on an ascending sojourn thereafter. Come midday until 16:00, it luxuriates in a plateau of warmth, gradually surrendering to twilight's embrace post that. Sensing point 2, narrated by the regal purple path, mimics its green counterpart, yet flaunts a consistently loftier warmth.
These observations unveil the dexterity of the virtual storage realms within edifices. The palpable diurnal ebbs and surges underscore the system's agility in fine-tuning its energy state—capturing thermal wealth during favorable price spells or satiating the edifice's thermal thirst. Notably, the temperature canvases elucidate that these maneuvers ensure a cocoon of comfort indoors. As the virtual realm bestows warmth (signaled by positive bar crescendos), the interior bathes in warmth, inversely, its energy hoarding moments (marked by negative bar decrescendos) see a mild chill descending. This dance, though performed with subtle variances across the two nodes, culminates in a symphony of optimal thermal equilibria.
Figure 5. Refined electrical power outcomes within the multi-energy system following the source-storage-load symbiotic approach
Figure 6. Honed thermal power outcomes within the multi-energy system following the source-storage-load symbiotic approach
Figure 7. Energy storage/discharge dynamics and ambient conditions in the virtual storage framework of building thermal network sensing points
To encapsulate, under the guidance of the source-storage-load symbiotic philosophy, the virtual thermal sanctuaries within the building's thermal network sensing points masterfully choreograph the edifice's thermal milieu, striking a balance between comfort sanctity and fiscal prudence.
In this comprehensive investigation into the source-storage-load (S-S-L) collaborative strategy of multi-energy systems (MES) within the distribution network, a thorough exploration of the efficiency and economic ramifications of MES subsystems was undertaken. Through the integration of the fundamental laws of thermodynamics, the impact mechanism of thermodynamic efficiency was elucidated. An optimal economic dispatch model for MES, pursuant to the S-S-L collaborative strategy, was subsequently developed, with associated constraints detailed and the construction stages delineated.
Experimental data facilitated an in-depth examination of the thermo-economic implications and the optimisation outcomes related to the electrical, thermal, and cooling facets of the MES. Results indicated that optimal strategies empower MES to assimilate diverse energy sources, catering to electrical and thermal necessities variably, while optimising economic outcomes. It was observed that, within efficacious S-S-L collaborative paradigms, renewable resources, notably solar and wind energy, emerge as integral to the holistic energy provision, maintaining system integrity and operational stability. Furthermore, the application of virtual building storage modalities resulted in efficacious thermal modulation within structures, achieving both comfort parameters and economic energy consumption.
It can thus be deduced that the employment of the S-S-L collaborative strategy for MES within the distribution network, when thermodynamic constraints are heeded, is both viable and potent. By judiciously leveraging an array of energy sources in tandem with sophisticated storage technologies, the system manifests objectives of optimal performance, fiscal prudence, and environmental conservation. Such insights render significant implications for future energy system design endeavours and can substantively contribute to the broader discourse on green energy initiatives and sustainable developmental trajectories.
This paper was supported by Zhejiang Huayun Electric Power Engineering Design & Consultation Co., Ltd. (Grant No.: 2022C1D05P18).
[1] Butturi, M.A., Gamberini, R. (2022). The potential of hydrogen technologies for low-carbon mobility in the urban-industrial symbiosis approach. International Journal of Energy Production and Management, 7(2): 151-163. https://doi.org/10.2495/EQ-V7-N2-151-163
[2] Lamagna, M., Groppi, D., Nezhad, M.M., Piras, G. (2021). A comprehensive review on Digital Twins for smart energy management system. International Journal of Energy Production and Management, 6(4): 323-334. https://doi.org/10.2495/EQ-V6-N4-323-334
[3] Zhang, X.Y., Li, H., Wang, J.K. (2022). Energy storage capacity optimization of non-grid-connected wind-hydrogen systems: From the perspective of hydrogen production features. Power Engineering and Engineering Thermophysics, 1(1): 48-63. https://doi.org/10.56578/peet010106
[4] Tajidan,T., Halil, H., Fernandez, E., Efendy, E., Nabilah, S., Effendy. (2022). A cost-driven method for determining the optimum selling price in tofu production on the household-scale tofu agroindustry: A case study in Mataram, Indonesia. International Journal of Sustainable Development and Planning, 17(3): 1033-1039. https://doi.org/10.18280/ijsdp.170335
[5] Man, D.W., Xu, G.Z., Xu, H. M., Xu, D.H. (2022). Parametric analysis of nonlinear bi-stable piezoelectric energy harvester based on multi-scale method. Power Engineering and Engineering Thermophysics, 1(1): 19-32. https://doi.org/10.56578/peet010104
[6] Liu, X., Luo, Y., Hou, M., Wang, R., Sun, Q. (2023). Energy complementation optimal scheduling strategy of urban multi-energy system with stepped carbon trading. Gaodianya Jishu/High Voltage Engineering, 49(6): 2275-2286. https://doi.org/10.13336/j.1003-6520.hve.20230307
[7] Yang, J., Xu, W., Ma, K., Chen, J., Guo, W. (2023). Integrated demand-side management for multi-energy system based on non-cooperative game and multi-energy pricing. Sustainable Energy, Grids and Networks, 34: 101047.
[8] Zhong, Y., Ji, L., Li, J., Wang, Y., Wang, Z., Zhang, X. (2022). Dynamic economic dispatching of island operation multi-energy complementary multi-energy system for park. In China International Conference on Electricity Distribution, CICED, Changsha, China, pp. 513-518. https://doi.org/10.1109/CICED56215.2022.9929175
[9] Carvallo, C., Jalil-Vega, F., Moreno, R. (2023). A multi-energy multi-microgrid system planning model for decarbonisation and decontamination of isolated systems. Applied Energy, 343: 121143. https://doi.org/10.1016/j.apenergy.2023.121143
[10] Duan, T., Sun, S., Yang, C., Sun, Y., Zhu, X. (2023). Sharded blockchain architecture oriented to multilateral collaboration of source-grid-load-storage. In 2023 IEEE International Conference on Control, Electronics and Computer Technology, ICCECT 2023. Jilin, China, https://doi.org/10.1109/ICCECT57938.2023.10140213
[11] Yue, Y., Ding, J., Chen, D., Fan, R., Fang, Y., Liu, Z. (2022, December). Research on the scenario design and business model analysis of source-grid-load-storage collaboration for zero-carbon big data industrial park. In 2022 12th International Conference on Power and Energy Systems (ICPES), Guangzhou, China, pp. 710-714. https://doi.org/10.1109/ICPES56491.2022.10072622
[12] Fang, Y., Fan, R., Liu, Z. (2023). A study on the energy storage scenarios design and the business model analysis for a zero-carbon big data industrial park from the perspective of source-grid-load-storage collaboration. Energy Reports, 9: 2054-2068. https://doi.org/10.1016/j.egyr.2023.05.202
[13] Liu, S., Sun, K., Xu, H., Chen, Y., Liu, Z., Wang, J., Liu, Z. (2023, June). Distribution network planning method for source-network-storage collaboration. In 2023 International Conference on Applied Intelligence and Sustainable Computing (ICAISC), Dharwad, India, pp. 1-7. https://doi.org/10.1109/ICAISC58445.2023.10199431
[14] Huang, H., Li, Y., Liu, H. (2023). Collaborative optimization strategy of source-grid-load-energy storage based on improved Nash-Q equilibrium transfer algorithm. IET Generation, Transmission & Distribution, 17(18): 4007-4023. https://doi.org/10.1049/gtd2.12862
[15] Ma, N., Cheng, Z., Wang, J., Yang, W., Liu, G. (2022). A multi-objective collaborative planning method of source, network, load and energy storage in distribution network considering adjustable load. In 2022 IEEE/IAS Industrial and Commercial Power System Asia (I&CPS Asia), Shanghai, China, pp. 416-420. https://doi.org/10.1109/ICPSAsia55496.2022.9949793
[16] Wang, Z., Lv, X., Li, D., Wang, W., Li, H., Chen, X. (2023). Research on power balance method of load storage collaborative planning of source network in new power system. In Third International Conference on Mechanical, Electronics, and Electrical and Automation Control (METMS 2023), Hangzhou, China, 12722: 180-187. https://doi.org/10.1117/12.2679663
[17] Zhang, Z., Lei, D., Jiang, C., Luo, J., Xu, Y., Li, J. (2022). Source-network-load-storage bi-level collaborative planning model of active distribution network with sop based on adaptive ε-dominating multi-objective particle swarm optimization algorithm. Dianwang Jishu/Power System Technology, 46(6): 2199-2212.
[18] Xu, P., Chen, J., Li, F., Mao, W. (2022). Digital simulation and automatic test of source network load storage cooperative control. In Proceedings of 2022 IEEE 5th International Electrical and Energy Conference, CIEEC 2022. Nangjing, China, pp. 4922-4927. https://doi.org/10.1109/CIEEC54735.2022.9846853
[19] Wei, X., Liu, D., Gao, F., Liu, L., Wu, Y., Ye, S. (2023). Generation expansion planning of new power system considering collaborative optimal operation of source-grid-load-storage under carbon peaking and carbon neutrality. Dianwang Jishu/Power System Technology, 47(9): 3648-3661. https://doi.org/10.13335/j.1000-3673.pst.2022.1966
[20] Zhang, Z., Lei, D., Jiang, C., Luo, J., Xu, Y., Li, J. (2023). A bi-level planning model and its solution method of AC/DC hybrid distribution network based on second-order cone programming and nnc method. Zhongguo Dianji Gongcheng Xuebao/Proceedings of the Chinese Society of Electrical Engineering, 43(1): 70-84. https://doi.org/10.13334/j.0258-8013.pcsee.212580
[21] Sun, H., Fang, D., Peng, C. (2021). Optimal allocation of wind-energy storage combined system based on extension distance K-means clustering and sine differential evolution algorithm. Dianli Zidonghua Shebei/Electric Power Automation Equipment, 41(10): 20-27. https://doi.org/10.16081/j.epae.202108001
[22] Wang, J. (2022). Application and prospect of source-grid-load-storage coordination enabled by artificial intelligence. Proceedings of the Chinese Society of Electrical Engineering, 42(21): 7667-7682.