Zheng Qi*![]() | Chunling Ren
| Chunling Ren![]()
© 2023 IIETA. This article is published by IIETA and is licensed under the CC BY 4.0 license (http://creativecommons.org/licenses/by/4.0/).
OPEN ACCESS
As urbanisation intensifies, an increased proportion of human activities is observed to be conducted indoors, amplifying the imperative of a superior indoor living environment. Among the various facets influencing indoor environmental quality, thermal comfort emerges as a pivotal factor influencing both physical and mental well-being. While predominant research methodologies predominantly employ empirical evaluations, the nuanced impacts of interior architectural structures on airflow and temperature distribution often remain unaddressed. Furthermore, rigorous simulations based on fluid dynamics are frequently absent from these assessments. In this study, the interplay of heat transfer and ventilation within interior architecture is meticulously examined. A novel research framework is introduced, encapsulating evaluations of human thermal comfort in ventilated interiors, intricate indoor airflow simulations predicated on fluid dynamics, and the pioneering design strategies for optimised hollow and ventilated architectural interior wall systems.
indoor thermal comfort, fluid dynamics, architectural design, hollow and ventilated interior wall, optimization design
In the burgeoning era of urbanisation, an increasing shift towards indoor human engagement has underscored the paramountcy of indoor living environment quality. Society's heightened aspirations for quality of life have transformed indoor thermal comfort from a mere residential necessity to a linchpin in architectural design [1-4]. Estimates suggest approximately 80% of individuals dedicate their time within indoor confines, spanning residences, workplaces, and leisure locales [5]. A conducive indoor environment is hence inferred not just to enrich human experiences but also to confer significant benefits upon physical and mental well-being [6,7]. Consequently, crafting indoor habitats that resonate with human comfort needs, whilst ensuring environmental compatibility and energy efficiency, has been discerned as a pivotal concern in architecture and environmental engineering [8].
Indoor thermal comfort, largely gauged by factors such as ambient temperature, humidity, and air velocity [9,10], bears profound implications, stretching from the quotidian experiences of individuals to overarching paradigms of global energy consumption and environmental conservation [11-16]. Building energy demands are purported to constitute nearly 40% of global energy intake, with the bulk channelled towards building heating, cooling, and ventilation. It is postulated that rigorous research and subsequent optimisation of indoor heat transfer and ventilation can notably augment energy efficiency, potentially serving as a bulwark against escalating climate anomalies [17]. Such an optimised milieu not only heightens work productivity and elevates living standards but is also envisaged to usher in pervasive societal and economic dividends [18].
Though the domain of indoor thermal comfort has garnered extensive scholarly traction, prevailing methodologies are often perceived as incongruent with practical exigencies. Predominantly, conventional approaches manifest an undue reliance on empirical findings, often sidelining precision simulations grounded in fluid dynamics [19-21]. Furthermore, the intricate interplay between convoluted interior architectural fabric and myriad physical processes tends to be rendered cursory treatment, if at all. Pertinently, inquiries into the hollow and ventilated building interior wall system are still nascent, bereft of a cohesive theoretical scaffold or established design paradigms [22, 23].
In the wake of these discernible research lacunae, the present study introduces a rejuvenated research framework, endeavouring to unravel the intricacies of heat transfer and ventilation in interior architectural spaces. Foremost, a meticulous assessment of human thermal comfort within ventilated interiors has been undertaken, culminating in the proposition of an array of novel evaluative parameters. Concomitantly, a numerically astute method, predicated upon fluid dynamics, has been devised to emulate indoor air dynamics faithfully. In culmination, design optimisation of the hollow and ventilated building interior wall system has been pursued, birthing a plethora of avant-garde design stratagems. Encompassed within this exploration lies not merely an academic foray but a repertoire of actionable insights for both architectural design and environmental engineering domains.
Combined with the research purpose of heat transfer and ventilation optimization of interior architecture, this study selected several indexes as human comfort evaluation indexes, such as nonuniformity coefficient of temperature and wind velocity, vertical air temperature difference between head and foot, Predicted Mean Vote (PMV), and Predicted Percentage of Dissatisfied (PPD).
Temperature and wind velocity should be considered when evaluating the human thermal comfort, because they are key factors that affect the thermal comfort in indoor environments. For example, due to climate influence, the positions near windows or doors may result in local differences in temperature or wind velocity, and the local nonuniformity may cause discomfort in the human body. By examining the nonuniformity coefficient of temperature and wind velocity, the degree of such nonuniformity can be quantified, thereby providing more accurate guidance for the heat transfer and ventilation design of buildings. The nonuniformity coefficient mainly measures the temperature or wind velocity differences between various indoor positions. Its numerical calculation is based on the differences between average and true values of those indoor positions, which may be caused by building design, heating, ventilation and air conditioning (HVAC) system, or external environment. A large nonuniformity coefficient implies significant local differences in temperature or wind velocity, which may lead to local discomfort.
Totally b points measuring temperature and wind velocity were set up in the working area of interior architecture. Let yu be the temperature value of the measuring point, and cu be the corresponding velocity value, then the calculation equations for arithmetic mean value were as follows:
$\bar{y}=\frac{\sum y_u}{b}$ (1)
$\bar{c}=\frac{\sum c_u}{b}$ (2)
To calculate the root mean square deviation (RMSD), then there were:
$\delta_y=\sqrt{\frac{\sum\left(y_u-\bar{y}\right)^2}{b}}$ (3)
$\delta_c=\sqrt{\frac{\sum\left(c_u-\bar{c}\right)^2}{b}}$ (4)
Let jc be the nonuniformity coefficient of velocity, and jy be the nonuniformity coefficient of temperature, then there were definition formulas:
$j_y=\frac{\delta_y}{\bar{y}}$ (5)
$j_c=\frac{\delta_c}{\bar{c}}$ (6)
The smaller the values of jc and jy, the better the ventilated environment and air flow distribution uniformity of interior architecture.
The human body’s perception of temperature is not even. The temperature perception differences between head and foot may lead to changes in comfort. As an index, the vertical air temperature difference between head and foot reflects the temperature difference between the upper and lower parts of a person when standing. If this difference is too large, it may lead to discomfort in the human body. Therefore, this index is crucial in evaluating the thermal comfort of indoor environments. Due to the natural phenomenon of rising heat flow and sinking cold flow, the indoor vertical temperature difference usually exists between different heights around the human body (such as the head and feet). This index measures the temperature change experienced by the human body in the vertical direction. If the temperature difference is too large, it may cause inconsistent temperature perception of the upper and lower parts around the human body, thereby leading to discomfort. Let y1.7 be the temperature value at 1.7m, and y0.1 be the temperature value at 0.1m, then the following equation was given:
Head - foot vertical air temperature difference = y1.7 - y0.1 (7)
As an index based on the human thermal balance and perception model, PMV comprehensively considers various indoor factors, such as temperature, humidity, wind velocity, radiation temperature, human clothing and activity level. The PMV value usually ranges from -3 to +3, with a negative value representing a sense of coldness, a positive value representing a sense of warmth, and 0 representing neutrality. This index is used to predict the average evaluation of most people for the current environment. Let Os be the partial pressure of water vapor around the human body, ya be the temperature of surrounding air, d1v be the area coefficient of clothing, yv1 be the outside surface temperature of clothing, and gv be the convective heat transfer coefficient. The PMV value was calculated according to the following equation:
$P M V=\left(0.3 r^{-0.036}+0.03\right)\left\{\begin{array}{l}(L-Q)-3.1 \times 10^{-3} \\ \times[5700-7 \times(L-Q)-Q s] \\ -0.39 \times[(L-Q)-58] \\ -1.7 \times 10^{-5} L\left(5800-O_s\right) \\ -0.0015 M\left(35-y_s\right)- \\ 3.84 \times 10^{-8} d_{1 v} \times\left[\begin{array}{l}\left(y_{v 1}+273\right)^4 \\ -\left(\bar{y}_e+273\right)^4\end{array}\right] \\ -d_{1 v} g_v\left(y_{v 1}-y_s\right)\end{array}\right\}$ (8)
As a derived index based on PMV, PPD predicts the percentage of people who may feel uncomfortable under given environmental conditions. There is a clear mathematical relationship between PPD and PMV. Generally speaking, the larger the absolute value of PMV, the higher the PPD. PPD provides a quantitative method to evaluate the range of indoor environmental comfort, and predicts the percentage of people who may be dissatisfied. The following equation provided the quantitative relationship between PMV and PPD:
$P D D=100-95 \times e^{-\left(0.034 \times P M V^4+0.22 \times P M V^4\right)}$ (9)
Based on the study of heat transfer and ventilation optimization of interior architecture, the indoor flow and distribution of air fluid are crucial for ensuring thermal comfort. To accurately describe and predict this flow behavior, this study constructed a governing equation based on mass, momentum and energy conservation laws.
The law of mass conservation indicates that no matter how matter changes or moves in a closed system, its total mass remains unchanged. In indoor fluid dynamics, the law of mass conservation can be transformed into a continuity equation, which means that the quality difference in air entering and leaving a specific space is equal to the change rate of air quality within that space. Let ϑ be the air fluid density of interior architecture, and I be the air velocity vector Iz,t,x. The mass conservation equation was given as follows:
$\frac{\partial \vartheta}{\partial y}+\nabla \cdot(\vartheta I)=0$ (10)
If air was regarded as an incompressible Newtonian fluid, there was a simplified expression for the continuity equation:
$\nabla I=0$ (11)
The law of momentum conservation indicates that the total momentum remains constant in a closed system without external forces. This can be understood as the Navier-Stokes equation in the scenario of indoor air flow, which describes the relationship between velocity, pressure, and density in a fluid. Using this equation, the indoor geometry, wind resistance, and other factors can be considered to predict the flow path and velocity of air. Let i, c and q be the velocity components of I in the z, t, and x coordinate directions, respectively; y be the time; c be the fluid motion viscosity; ϑ be the fluid density; and o be the pressure. The expressions of momentum conservation equation for different velocity directions were given as follows:
$\frac{\partial i}{\partial y}+D I V(i I)=D I V(V G)-\frac{1}{\vartheta} \frac{\partial o}{\partial z}$ (12)
$\frac{\partial c}{\partial y}+D I V(c I)=D I V(V G)-\frac{1}{\vartheta} \frac{\partial o}{\partial t}$ (13)
$\frac{\partial q}{\partial y}+D I V(q I)=D I V(V G)-\frac{1}{\vartheta} \frac{\partial o}{\partial x}$ (14)
The law of energy conservation indicates that energy is neither created nor destroyed in a closed system, but is only transformed from one form to another. This is usually expressed as an energy equation in indoor temperature and air flow, which describes the relationship between temperature, heat conduction, convection, and radiation in the air. This equation helps understand and predict the indoor temperature distribution, and provides important information for optimizing the thermal comfort. Let Y be the temperature, η be the heat conduction coefficient of the fluid, vo be the constant-pressure specific heat, and AY be the source term. The energy conservation equation was given as follows:
$\frac{\partial Y}{\partial y}+D I V(I Y)=D I V\left(\frac{\eta}{\vartheta v_0} G R A D(Y)\right)-\frac{A_Y}{\vartheta}$ (15)
As a dimensionless fluid dynamics parameter, Reynolds Number is used to describe the properties of fluid flow, and is defined by flow velocity, characteristic length, and dynamic properties of the fluid. Reynolds Number plays a crucial role in simulating indoor air flow, helping determine whether fluid flow belongs to laminar flow (low Reynolds Number) or turbulent flow (high Reynolds Number). Laminar flow is an orderly flow with a smooth velocity distribution. While turbulent flow is a disordered flow, and the velocity distribution is random. The flow state of indoor air has a direct impact on temperature distribution, air mixing, and comfort. Therefore, the key step in simulating indoor air flow is to correctly determine the flow state. Moreover, by calculating Reynolds Number in the ventilation design of interior architecture, designers have a clearer understanding of the characteristics of air flow, thereby making decisions about the positions and sizes of air vents, or the fan output. Let ϑ be the fluid density, i be the flow rate, M be the characteristic length, and ω be the dynamic viscosity, then there was a calculation equation:
$R E=\frac{\vartheta_{i M}}{\omega}$ (16)
In the research on heat transfer and ventilation optimization of interior architecture, it is crucial to choose an appropriate turbulence model for simulating turbulent flow. The model selection should be based on the specific characteristics of the flow, calculation purposes, available resources, and required accuracy. When selecting a turbulence model in this study, the first consideration was whether it was an eddy, and whether separation, reconnection and other phenomena existed. For example, the flow with high Reynolds Number, especially in case of flow separation, may require a more complex turbulence model. For certain applications, such as indoor air quality research, high simulation accuracy may be required, which may require the use of a more advanced turbulence model. Based on research needs, this study selected Large Eddy Simulation (LES) suitable for solving complex and strongly turbulent flows, which solved the unfiltered Navier-Stokes equation, and only simulated larger eddies. Although LES required more computing resources, it provided more accurate results for complex indoor flows.
Based on the evaluation results of human thermal comfort and the solution results of the constructed indoor air fluid flow governing equation, the following information was clarified:
(1) Position and intensity adjustment of heating/cooling sources: The evaluation results helped determine the comfort differences between different indoor areas, thereby determining to increase or decrease heating/cooling in which areas.
(2) Ventilation system configuration optimization: Based on the simulation results of fluid flow, the positions, sizes, and directions of air vents were adjusted to improve the distribution and flow of indoor air.
(3) Adjustment requirements for indoor layout: Furniture or other obstacles were reconfigured based on human thermal comfort and air flow to better promote air circulation and heat distribution.
Figure 1. Optimization principle of heat transfer and ventilation of interior architecture
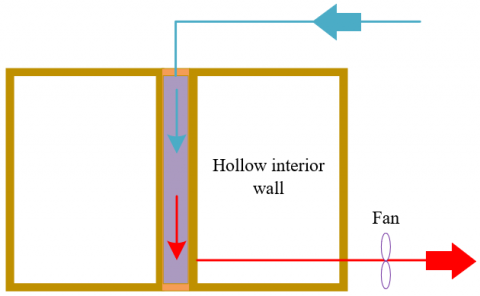
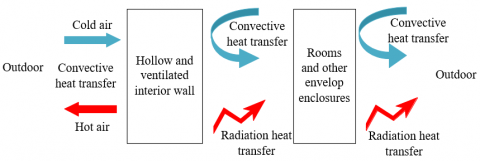
Figure 1 shows the optimization principle of heat transfer and ventilation of interior architecture. Based on the evaluation of human thermal comfort and the simulation results of air flow, heat transfer and ventilation of interior architecture can be optimized from multiple aspects. To better improve the indoor thermal environment and ventilation, and make residents feel more comfortable, this study chose to use a hollow and ventilated interior wall system as a thermal buffer, thereby reducing the impact of external temperature on the indoor environment. At the same time, natural ventilation was guided and enhanced to provide better air circulation. This system can be designed and adjusted according to specific architectural and geographical conditions, providing greater design flexibility. Figure 2 shows the schematic diagram of the hollow and ventilated interior wall system.
Figure 2. Schematic diagram of hollow and ventilated interior wall system
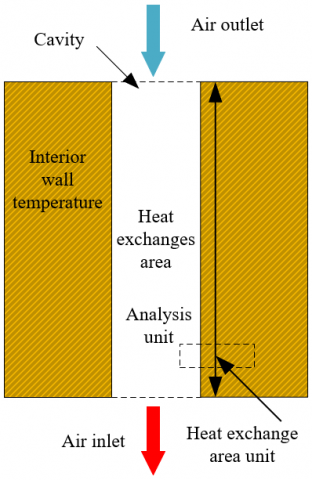
The hollow and ventilated interior wall system has complex heat flow and storage characteristics. A dynamic heat network model captured the transient process of heat flow, which fully utilized the changes in indoor and external environmental conditions (e.g. sunlight, wind velocity, indoor heat source, etc.), and dynamic changes in the thermal performance of the hollow and ventilated interior wall, thereby more accurately predicting the wall’s response. A heat transfer unit number model provided detailed temperature distribution inside the hollow wall. As a simplified model, it effectively described the main heat conduction paths of the wall, thereby reducing computational complexity. The coupling model based on the dynamic heat network model and the heat transfer unit number model provided a powerful tool to describe and predict the thermal performance of the hollow and ventilated interior wall system. Figure 3 shows a cross-sectional view of the system.
Figure 3. Cross section of the hollow and ventilated interior wall system
According to the energy balance theorem, the heat transfer mechanism in each cavity unit was fully considered, i.e. convection, heat conduction, and radiation. The convection from the cavity air to the wall, the radiation heat transfer between the walls, and the heat conduction inside the wall all needed to be carefully considered. Let Ys be the air temperature inside the cavity, J be the convective heat transfer coefficient between internal surface of the interior wall and the circulating air, Ya be the internal surface temperature of the interior wall, and S be the heat transfer area between the cavity air and internal surface of the interior wall. Based on the fluidity and turbulence effect of air, the heat lost by the cavity air was equal in quantity to the heat transferred by the air to the internal surface of the interior wall by default, then there was a formula:
$d W=v_o \cdot l \cdot f Y_s=J \cdot d S \cdot\left(Y_a-Y_s\right)$ (17)
The variable separation method was further used to solve the above formula. The multidimensional problem was first transformed into multiple one-dimensional problems, and the problem of each dimension was solved using a standard solution. Let Ys1 be the air inlet temperature in the cavity, and Ys2 be the air outlet temperature in the cavity. The following formulas provided the boundary conditions corresponding to temperature, humidity, velocity and other parameters at the inlet, as well as the calculation formula for integrating the entire cavity:
$\left\{\begin{array}{l}m=0, S(m)=0, Y_a(m)=Y_a(0) \\ m=M, S(m)=S, Y_a(m)=Y_a(M)\end{array}\right\}$ (18)
$\int_{Y_{s 1}}^{Y_{s 2}} \frac{d Y_s}{Y_a-Y_s}=\int_0^A \frac{J \cdot d S}{V_o \cdot l}$ (19)
Under the assumption that the cavity air is in a stable flow state, an appropriate integration method was used to calculate the temperature and the heat flow distribution inside the cavity. Any possible nonuniformity should be considered, such as flow changes caused by obstacles or cavity geometry. By ignoring the changes in heat capacity caused by temperature changes, the following formula was derived:
$-\ln \frac{Y_a-Y_{s 1}}{Y_a-Y_{s 2}}=\frac{J S}{V_o l}$ (20)
where, on the right side of the above formula is the number of heat transfer units for the hollow and ventilated interior wall, i.e.,
$B Y I=\frac{J S}{V_o l}$ (21)
The average wall temperature was obtained by integrating the temperature of each point on the cavity wall. The air temperature at the cavity outlet was estimated using the heat transfer unit number method, combined with the average wall temperature and the inlet air temperature:
$Y_{s 2}=Y_a+\left(Y_{s 1}-Y_a\right) r^{-B Y I}$ (22)
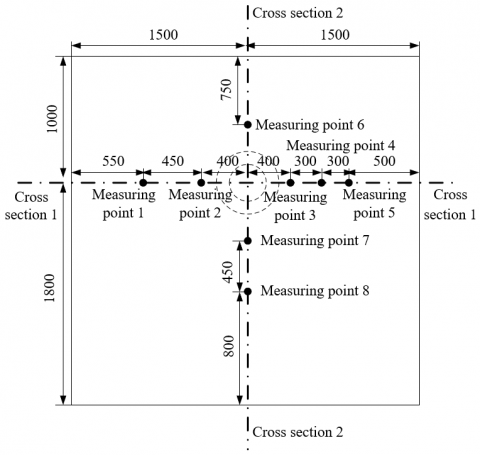
The distribution of temperature measuring points is crucial for the heat transfer and ventilation optimization experiment of interior architecture, because it directly affects the experimental accuracy and the reliability of experimental results. The measuring points should be evenly distributed throughout the entire indoor space, ensuring to fully represent the temperature distribution of the entire environment. Special attention should be paid to areas with temperature anomalies or significant temperature differences, such as the areas near windows and doors, or other large external structures. Due to the increase of heat, the indoor temperature varies with height. Therefore, measuring points should be set up at different heights to capture the temperature distribution in the vertical direction. They should not be set up in positions exposed to direct sunlight and heat sources of equipment, or with other obvious external interference. At the same time, the temperature sensor should not be blocked by furniture or other obstructions to affect its normal operation. Figure 4 shows a schematic diagram of temperature measuring point distribution plane. A correct distribution principle of temperature measuring points ensured that accurate and reliable data were obtained for research, providing strong support for subsequent heat transfer and ventilation optimization.
Figure 4. Schematic diagram of temperature measuring point distribution plane
Table 1. Steady state experimental conditions
|
Operating Condition Number |
Air Inlet Velocity (m/s) |
Inlet Temperature (℃) |
Experimental Outlet Temperature (℃) |
Model Outlet Temperature (℃) |
Outlet Temperature Error (℃) |
Temperature Difference Error Rate (%) |
|
1 |
1.32 |
36 |
21.5 |
21.3 |
-0.2 |
1.2 |
|
2 |
1.6 |
36 |
21.3 |
20.9 |
-0.4 |
2.8 |
|
3 |
1.6 |
41 |
21.5 |
21.2 |
-0.3 |
1.6 |
|
4 |
1.6 |
46 |
21.6 |
21.2 |
-0.4 |
1.7 |
|
5 |
1.6 |
51 |
21.4 |
21.3 |
-0.1 |
0.3 |
|
6 |
2.1 |
36 |
22.5 |
22.6 |
0.1 |
0.7 |
|
7 |
2.1 |
41 |
22.1 |
22.4 |
0.3 |
1.5 |
|
8 |
2.1 |
46 |
23.6 |
23.8 |
0.2 |
0.8 |
|
9 |
2.89 |
36 |
23.1 |
23.5 |
0.4 |
3.2 |
|
10 |
2.89 |
41 |
23.7 |
24.3 |
0.6 |
3.3 |
|
11 |
2.89 |
46 |
24.5 |
24.9 |
0.4 |
1.9 |
Based on Table 1, the steady state experimental condition data of the hollow and ventilated interior wall system can be analyzed. The table provides operating condition number, air inlet velocity, inlet temperature, experimental outlet temperature, model outlet temperature, outlet temperature error, and temperature difference error rate. As shown in the table, when the air inlet velocity increases from 1.32m/s to 2.89m/s, the maximum error rate between the model outlet temperature and the experimental outlet temperature increases from 1.2% to 3.3%, which means that the accuracy predicted by the model decreases as the air inlet velocity increases. At the same air inlet velocity (e.g. 1.6m/s), as the inlet temperature increases from 36°C to 51°C, the temperature difference error rate varies between 0.3% and 2.8%, which indicates that the impact of inlet temperature on model prediction is not particularly significant. In most cases, the model outlet temperature is slightly lower than the experimental outlet temperature, which means that the model has some shortcomings in certain aspects, such as insufficient estimation of heat transfer characteristics or turbulence effect of the interior wall. The maximum value of temperature difference error rate is 3.3%, while the minimum value is 0.3%, which indicates that the model predictions are very close to the experimental results under certain operating conditions. But in other cases, the model should be further calibrated and optimized. In summary, although the model has some errors, its predictions are within an acceptable error range in most operating conditions, indicating that the constructed model is an effective tool for predicting and analyzing the heat transfer and ventilation behavior of interior architecture.
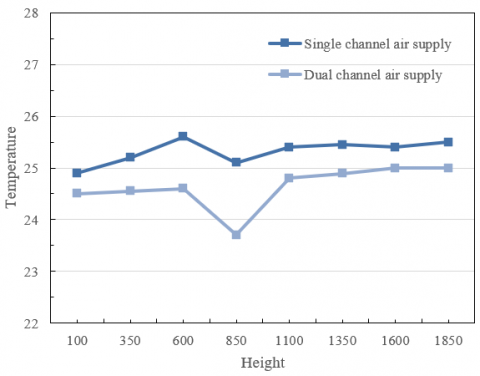
Figure 5. Average temperature changes at different heights in single and dual channel air supply
Based on Figure 5, the indoor temperature changes at different heights can be analyzed when single and dual channel air supply is used for the hollow and ventilated interior wall system. As shown in the figure, single and dual channel air supply exhibits different temperature distribution characteristics at different indoor heights. The temperature changes of single channel air supply is relatively smooth, while significant temperature changes at certain heights occur in dual channel air supply. The temperature drops at the middle heights (especially 850mm) in dual channel air supply, which is caused by changes in air flow rate, certain design features in the dual channel structure, or dynamic factors of other fluids. At the lower heights, the temperature of single channel air supply is higher than that of dual channel air supply, because the single channel has high wind velocity or air mixing is insufficient. At the higher heights, the temperatures of both tend to be consistent, which means that both single and dual channel air supply has similar temperature control and distribution effect at these heights. Overall, dual channel air supply provides a more even temperature distribution, especially in the middle and high regions. However, considering the specific applications and objectives of single and dual channel air supply, the use of which method still needs to be further evaluated based on specific needs and experimental conditions.
Table 2. Temperature nonuniformity coefficient of single and dual channel air supply
|
Temperature Nonuniformity Coefficient |
Single Channel Air Supply |
Dual Channel Air Supply |
|
Measuring point 1 |
0.025 |
0.021 |
|
Measuring point 2 |
0.024 |
0.016 |
|
Measuring point 3 |
0.019 |
0.021 |
|
Measuring point 4 |
0.011 |
0.024 |
|
Measuring point 5 |
0.014 |
0.016 |
|
Cross section 1 |
0.023 |
0.022 |
|
Measuring point 6 |
0.009 |
0.011 |
|
Measuring point 7 |
0.006 |
0.015 |
|
Measuring point 8 |
0.003 |
0.004 |
|
Cross section 2 |
0.009 |
0.012 |
Based on Table 2, the temperature nonuniformity coefficient at different measuring points and cross-sections can be analyzed when single and dual channel air supply is used for the hollow and ventilated interior wall system. It can be seen from the table that dual channel air supply provides a more even temperature distribution at most measuring points, especially Measuring points 1-3, because the dual channel system disperses and mixes air more evenly. The temperature nonuniformity coefficient of the dual channel is relatively high at certain measuring points (e.g. Measuring points 4, 6-8) and Cross section 2, because certain structural or flow characteristics cause local temperature changes. Overall, dual channel air supply performs more evenly than single channel air supply at most measuring points. But the dual channel has slightly higher nonuniformity in some places, which is caused by factors, such as air flow velocity, flow mode, or channel design and layout. For the use of single or dual channel air supply systems, the nonuniformity coefficient and other related factors (e.g. installation costs, maintenance difficulty, etc.) should be comprehensively considered, combined with practical application and engineering requirements.
Table 3. Comparison of head and foot temperatures and vertical temperature differences around the human body in single and dual channel air supply
|
|
|
Measuring Point 2 (℃) |
Measuring Point 3 (℃) |
Measuring Point 6 (℃) |
Measuring Point 7 (℃) |
Overall (℃) |
|
Single channel air supply |
Head temperature |
23.15 |
25.18 |
25.88 |
25.49 |
25.84 |
|
Foot temperature |
23.12 |
26.42 |
26.08 |
25.81 |
26.25 |
|
|
Vertical temperature difference |
-0.03 |
1.24 |
0.2 |
0.32 |
0.41 |
|
|
Dual channel air supply |
Head temperature |
25.13 |
25.36 |
25.31 |
25.39 |
25.69 |
|
Foot temperature |
25.31 |
25.76 |
25.83 |
25.57 |
26 |
|
|
Vertical temperature difference |
0.18 |
0.4 |
0.52 |
0.18 |
0.31 |
Based on Table 3, the head and foot temperatures and the vertical temperature differences around the human body at different measuring points can be analyzed when single and dual channel air supply is used for the hollow and ventilated interior wall system. It can be seen from the table that there are significant vertical temperature differences between head and foot at certain measuring points (e.g. Measuring point 3) in single channel air supply, which causes discomfort for indoor personnel. Dual channel air supply provides a relatively even temperature distribution at most measuring points, and the vertical temperature differences between head and foot are relatively small, because the dual channel structure is more conducive to even air mixing and flow. Overall, dual channel air supply provides a relatively good vertical temperature distribution, which is more conducive to the thermal comfort around the human body. When designing and optimizing the heat transfer and ventilation system of interior architecture, a dual channel air supply structure can be considered, especially in situations where human comfort needs to be ensured.
Table 4. PMV/PPD values of single and dual channel air supply
|
|
PMV Values |
PPD Values |
|
Single channel air supply |
0.3 |
7% |
|
Dual channel air supply |
0.29 |
7% |
According to the data in Table 4, the PMV value of single channel air supply is 0.3, while that of dual channel air supply is 0.29. The PMV values of both are very close, and are within a relatively comfortable range, which means that both air supply methods provide a relatively comfortable indoor environment. Both single and dual channel air supply has a PPD value of 7%, which means that approximately 7% of people are predicted to feel uncomfortable using both air supply methods.
From the perspective of thermal comfort, single and dual channel air supply provides similar indoor environments in the hollow and ventilated interior wall system. Both air supply methods provide a relatively comfortable thermal environment for indoor personnel, and the predicted dissatisfaction is low. Considering other factors, such as installation costs, maintenance, energy efficiency, etc., further study is needed to determine which air supply method to choose. But both air supply methods have similar performance in terms of thermal comfort.
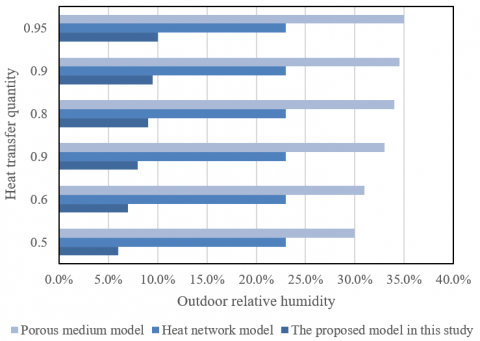
(a) Single channel air supply
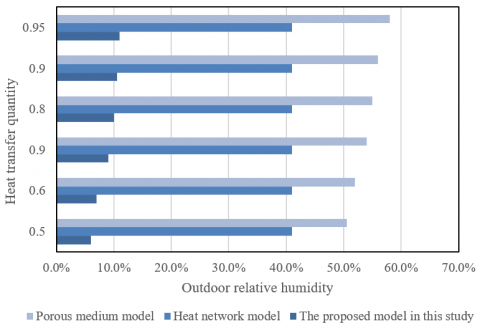
(b) Dual channel air supply
Figure 6. Heat transfer quantity calculation differences of different heat transfer models under different outdoor relative humidity
Based on Figure 6, an in-depth examination of heat transfer quantity disparities across various models under differing outdoor relative humidity levels has been conducted, particularly when the hollow and ventilated interior wall system employs either single or dual-channel air supply. As depicted in the figure, a surge in outdoor relative humidity is concomitant with a progressive increase in the heat transfer quantity for the model introduced in this research, irrespective of whether a single or dual-channel air supply is utilised. This suggests that the model presented herein exhibits pronounced sensitivity to humidity variations, with its heat transfer quantity amplifying in tandem with rising humidity levels. In contrast, the heat transfer quantity for the heat network model remains invariant across all examined relative humidity levels, implying that this model either overlooks the ramifications of fluctuating humidity or presupposes its influence on the heat transfer mechanism to be negligible.
Interestingly, the heat transfer quantity associated with the porous medium model also elevates with ascending outdoor relative humidity levels. Although this trend mirrors that of the model delineated in this study, their respective growth trajectories exhibit discernible nuances. Such variations insinuate underlying disparities in their internal physical processes or foundational assumptions. Consequently, while both the model presented in this study and the porous medium model acknowledge the influence of humidity on heat transfer dynamics, the heat network model seemingly does not. Given these observations, the model proposed herein appears to more adeptly replicate heat transfer behaviours under varying humidity conditions.
In this study, the heat transfer and ventilation optimisation within interior architecture was rigorously investigated. To achieve a profound understanding of this system, a coupled model—integrating the dynamic heat network model with the heat transfer unit number model—was employed to simulate the heat transfer within the hollow and ventilated interior wall system. Comprehensive delineation of the calculation procedure for cavity heat transfer in this wall was subsequently provided. This entailed the construction of the cavity unit heat equation, solutions derived via the separation variable method, the attainment of boundary conditions, integration of the cavity segment, and the extraction of the stable flow state heat transfer of the cavity air.
Performance evaluation of the hollow and ventilated interior wall system under varied experimental conditions was undertaken, using both experimental data and simulation comparisons. Distinctive differences between single and dual channel air supplies, in terms of their performance under varying conditions such as height, temperature non-uniformity coefficients, vertical temperature disparities around the human body, and PMV/PPD values, were identified and contrasted. Notably, the study also discerned the contrasting calculation outputs among three heat transfer models—specifically, the model proposed herein, the heat network model, and the porous medium model—under fluctuating outdoor relative humidity conditions.
The steady-state experimental data for the hollow and ventilated interior wall system revealed that the temperature predicted by the model closely paralleled the actual measurements, with discrepancies remaining minimal. Evidence was garnered that dual channel air supplies tend to offer a more uniform temperature distribution across various altitudes. Particularly noteworthy was the observation that dual channel air supply introduced minimal vertical temperature disparities around the human body, especially when assessing differences from head to foot. PMV/PPD evaluations demonstrated comparable thermal comfort levels in both single and dual channel air supplies. Upon scrutiny of diverse humidity contexts, the proposed model and the porous medium model were found to be humidity-responsive, whereas the heat network model displayed indifference to humidity variations.
In essence, the hollow and ventilated interior wall system plays a pivotal role in enhancing heat transfer and ventilation optimisation in interior architectures. The coupled model presented in this investigation exhibits commendable efficacy in capturing the intricate heat transfer dynamics of this system, aligning robustly with experimental observations. Dual channel air supplies, as opposed to their single channel counterparts, proffer enhanced uniformity in indoor temperature distributions, and effectively curtail vertical temperature variations around the human form. It stands to reason that model selection should be judiciously informed by specific application contexts and precision requirements, given that distinct heat transfer models exhibit markedly different performance metrics under varied humidity conditions.
[1] He, Y., Wong, N.H., Kvan, T., Liu, M., Tong, S. (2022). How green building rating systems affect indoor thermal comfort environments design. Building and Environment, 224: 109514. https://doi.org/10.1016/j.buildenv.2022.109514
[2] Xiao, L., Qin, L.L., Wu, S.Y. (2023). Effect of PV-Trombe wall in the multi-storey building on standard effective temperature (SET)-based indoor thermal comfort. Energy, 263: 125702. https://doi.org/10.1016/j.energy.2022.125702
[3] Amaripadath, D., Rahif, R., Velickovic, M., Attia, S. (2023). A systematic review on role of humidity as an indoor thermal comfort parameter in humid climates. Journal of Building Engineering, 68: 106039. https://doi.org/10.1016/j.jobe.2023.106039
[4] Wang, Z., Calautit, J., Tien, P.W., Wei, S., Zhang, W., Wu, Y., Xia, L. (2023). An occupant-centric control strategy for indoor thermal comfort, air quality and energy management. Energy and Buildings, 285: 112899. https://doi.org/10.1016/j.enbuild.2023.112899
[5] Ni, S., Zhu, N., Hou, Y., Zhang, Z. (2023). Research on indoor thermal comfort and energy consumption of zero energy wooden structure buildings in severe cold zone. Journal of Building Engineering, 67: 105965. https://doi.org/10.1016/j.jobe.2023.105965
[6] Dai, J., Wang, J., Bart, D., Gao, W. (2023). The impact of building enclosure type and building orientation on indoor thermal comfort---A case study of Kashgar in China. Case Studies in Thermal Engineering, 49: 103291. https://doi.org/10.1016/j.csite.2023.103291
[7] Amoatey, P., Al-Jabri, K., Al-Saadi, S. (2022). Influence of phase change materials on thermal comfort, greenhouse gas emissions, and potential indoor air quality issues across different climatic regions: A critical review. International Journal of Energy Research, 46(15): 22386-22420. https://doi.org/10.1002/er.8734
[8] Brik, B., Esseghir, M., Merghem-Boulahia, L., Hentati, A. (2022). Providing convenient indoor thermal comfort in real-time based on energy-efficiency IoT network. Energies, 15(3): 808. https://doi.org/10.3390/en15030808
[9] Elsaid, A.M., Mohamed, H.A., Abdelaziz, G.B., Ahmed, M.S. (2021). A critical review of heating, ventilation, and air conditioning (HVAC) systems within the context of a global SARS-CoV-2 epidemic. Process Safety and Environmental Protection, 155: 230-261. https://doi.org/10.1016/j.psep.2021.09.021
[10] Enteria, N., Cuartero-Enteria, O., Sawachi, T. (2020). Review of the advances and applications of variable refrigerant flow heating, ventilating, and air-conditioning systems for improving indoor thermal comfort and air quality. International Journal of Energy and Environmental Engineering, 11(4): 459-483. https://doi.org/10.1007/s40095-020-00346-0
[11] Yu, J., Qian, C., Yang, Q., Xu, T., Zhao, J., Xu, X. (2023). The energy saving potential of a new ventilation roof with stabilized phase change material in hot summer region. Renewable Energy, 212: 111-127. https://doi.org/10.1016/j.renene.2023.05.012
[12] Cao, S., Li, X., Yang, B. (2021). Heat and moisture transfer of building envelopes under dynamic and steady-state operation mode of indoor air conditioning. Journal of Building Engineering, 44: 102683. https://doi.org/10.1016/j.jobe.2021.102683
[13] Camci, M., Karakoyun, Y., Acikgoz, O., Dalkilic, A.S. (2021). A comparative study on convective heat transfer in indoor applications. Energy and Buildings, 242: 110985. https://doi.org/10.1016/j.enbuild.2021.110985
[14] Kong, X., Wang, Z., Fan, M., Li, H. (2023). Analysis on the energy efficiency, thermal performance and infection intervention characteristics of interactive cascade ventilation (ICV). Journal of Building Engineering, 68: 106045. https://doi.org/10.1016/j.jobe.2023.106045
[15] Liu, P., Mathisen, H.M., Skaten, M., Alonso, M.J. (2022). Use of membrane energy exchanger in ventilation: Odour sensory measurement. Building and Environment, 222: 109430. https://doi.org/10.1016/j.buildenv.2022.109430
[16] Camci, M., Karakoyun, Y., Acikgoz, O., Dalkilic, A.S. (2022). An experimental study on the heat transfer characteristics over a radiant cooled wall exposed to mixed and forced convection driven by displacement ventilation. International Communications in Heat and Mass Transfer, 135: 106122. https://doi.org/10.1016/j.icheatmasstransfer.2022.106122
[17] Krawczyk, D.A., Żukowski, M. (2020). Experimental verification of the CO2 and temperature model. International Journal of Ventilation, 19(2): 127-140. https://doi.org/10.1080/14733315.2019.1592333
[18] Liu, G., Liu, D., Zhang, H., Xu, Z., Dong, X. (2020). Inverse identification of gaseous pollutant sources in a mixed ventilation room with downwind scheme-based backward modeling. In IOP Conference Series: Earth and Environmental Science, 569(1): 012020. https://doi.org/10.1088/1755-1315/569/1/012020
[19] Xu, L.W., Zou, A.X. (2017). A fast computational fluid dynamics model for the flow and heat transfer characteristics analysis of indoor substation rooms. In IOP Conference Series: Materials Science and Engineering, 199(1): 012076. https://doi.org/10.1088/1757-899X/199/1/012076
[20] Ascione, F., De Masi, R.F., Mastellone, M., Vanoli, G.P. (2021). The design of safe classrooms of educational buildings for facing contagions and transmission of diseases: A novel approach combining audits, calibrated energy models, building performance (BPS) and computational fluid dynamic (CFD) simulations. Energy and Buildings, 230: 110533. https://doi.org/10.1016/j.enbuild.2020.110533
[21] Jiang, F., Li, Z., Zhao, Q., Tao, Q., Yuan, Y., Lu, S. (2019). Flow field around a surface-mounted cubic building with louver blinds. In Building Simulation, 12: 141-151. https://doi.org/10.1007/s12273-018-0493-1
[22] Huang, J., Yu, J., Yang, H. (2018). Effects of key factors on the heat insulation performance of a hollow block ventilated wall. Applied Energy, 232: 409-423. https://doi.org/10.1016/j.apenergy.2018.09.215
[23] Yu, J., Ye, H., Xu, X., Huang, J., Liu, Y., Wang, J. (2018). Experimental study on the thermal performance of a hollow block ventilation wall. Renewable Energy, 122: 619-631. https://doi.org/10.1016/j.renene.2018.01.126