Hayder Mohsin Ali![]() | Saif Ali Kadhim*
| Saif Ali Kadhim*![]() | Osama Abd Al-Munaf Ibrahim
| Osama Abd Al-Munaf Ibrahim![]()
© 2023 IIETA. This article is published by IIETA and is licensed under the CC BY 4.0 license (http://creativecommons.org/licenses/by/4.0/).
OPEN ACCESS
This study embarks on a comprehensive exploration of the influence exerted by refrigerant purity characteristics on vapor-compression refrigeration systems performance. The investigation particularly delves into the effects on domestic applications, such as chest freezers. Deviations from the ideal refrigerant characteristics, as stipulated by the AHRI-700 standard, can provoke detrimental repercussions, including augmented power consumption and diminished coefficient of performance. In this empirical analysis, three R134a refrigerant samples, each with varying degrees of conformity to the AHRI-700 standard, were scrutinized. Sample 1 with superior characteristics, sample 2 with medium characteristics, while sample 3 with substandard characteristics. The samples were subjected to identical ambient conditions within a 145-liter chest freezer operating at a temperature of 32℃. The findings unequivocally underscored a correlation between refrigerant purity and system performance. Sample 1, with optimal characteristics, demonstrated superior performance, consuming less power (120.7 W) and delivering a higher coefficient of performance (2.33) in comparison to sample 2 (138 W, 2.07) and sample 3 (147 W, 1.93). These results emphatically emphasize the necessity of stringent refrigerant selection, predicated on purity characteristics, to best performance of vapor-compression refrigeration systems.
refrigerant purity characteristics, vapor compression refrigeration system, R134a, chest freezer, power consumption, COP
The Vapor-Compression Refrigeration System (VCRS) is ubiquitously employed for a range of applications including refrigerators, air-conditioning systems, and heat pumps [1]. Integral components of this system comprise the compressor, the condenser, the expansion valve (or capillary tube), and the evaporator where the refrigerant, serving as the working fluid, undergoes multiple phase changes [2]. Under ideal conditions, the VCRS operates via isentropic compression, where the refrigerant gas shifts from a low-pressure to a high-pressure zone within the compressor. Subsequently, the gas arrives at the condenser, transitioning to a liquid phase under constant pressure while rejecting heat to the surrounding environment. The refrigerant liquid then undergoes throttling within the expansion device, before entering the evaporator. Here, it reverts to a gaseous phase under constant pressure, extracting heat from the enclosed space. However, in reality, the VCRS performance deviates significantly from the ideal model. Pressure drops can be observed throughout the system, barring the compression process, and heat transfer occurs between the refrigerant and its environment across all components. Moreover, the actual compression process diverges substantially from the isentropic model, and the working fluid is a refrigerant-oil mixture, as opposed to a pure substance. These deviations induce several irreversibilities within the system, necessitating additional power input for the compressor [3]. Extensive research is therefore dedicated to the reduction of power consumption in VCRS [4-8], although energy efficiency alone does not dictate the performance of these systems. The system's capacity to extract heat from the space is equally crucial, an aspect captured by the Coefficient of Performance (COP). COP is defined as the ratio of the heat removal rate by the evaporator (the refrigeration effect) to the power consumed by the compressor [9].
The choice, purity, and type of refrigerant used in VCRS directly influence the COP [10-13]. Refrigerants exhibit varying chemical and thermophysical properties, and their environmental impact also differs significantly. Refrigerant purity, characterized by factors such as water content, high boiling residue, acidity, and non-condensable gas content, affects the system's performance. Numerous studies have compared different refrigerant types according to their effects on VCRS performance.
Much of the existing research has concentrated on identifying efficient refrigerants to replace those with high ozone depletion potential or global warming potential (or both) [14-18]. Chen et al. [19] compared the heat transfer properties of two refrigerants, R22 and R134a, using spray cooling. They concluded that refrigerant R134a could replace R22 in the phase change heat transfer region. Choudhari and Sapali [20] considered R290 as a potential substitute for R22, concluding that R290, given its superior environmental and thermophysical properties, could be an effective replacement in real-world applications. De Paula et al. [21] evaluated the performance of VCRS using R290, R1234yf, and R744 as alternatives to R134a, finding that the system operating with R290 proved optimal. Shen and Ally [22] compared the performance of lower-GWP alternative refrigerants (R-32, R-452B, R-454B, and R-466A) with conventional R-410A in a regular 2-speed heat pump. They deduced that R-452B and R-454B exhibited superior efficiency and performance characteristics compared with R-410A, making all four alternative refrigerants viable replacements. Sánchez et al. [23] evaluated the performance of a commercial beverage cooler using six alternatives to R134a, discovering significant power reductions with all but one of the alternatives. Khatoon and Karimi [24] presented a theoretical study of two-evaporator vapor pressure refrigeration systems in automobiles, concluding that HFO1336mzz(Z) displayed optimal performance, while R452A exhibited the worst thermodynamic performance.
However, while the refrigerant's thermal properties significantly affect the thermal performance of all applications, no studies have empirically examined the effects of refrigerant purity on application performance. This study aims to fill this knowledge gap by experimentally investigating the impact of refrigerant purity on VCRS performance. A model of R134a from three different companies will be evaluated against the AHRI standard 700 [25] in a chest freezer.
Refrigerants are inherently subject to leakage, necessitating frequent recharging of the Vapor Compression Refrigeration System (VCRS). A vast array of products with varied origins and characteristics proliferate the market, with quality often correlating with the selling price and the reputation of the manufacturing or issuing entity. This diversity, coupled with factors such as cost and consumer apathy, often leads to indiscriminate purchasing decisions, especially in domestic applications such as refrigeration and air conditioning. This phenomenon necessitates a thorough examination of the potential damage incurred by the system when substandard refrigerants are employed. The primary objective of this study is to elucidate these potential repercussions and inform the relevant stakeholders.
It should be underscored that the refrigerant R134a was selected as the subject of this study solely due to its compatibility with our VCRS compressor. The future use of this particular refrigerant is, however, not advocated due to its categorisation as a Hydrofluorocarbon (HFC) with a high Global Warming Potential (GWP). The discontinuation of high GWP refrigerants is recommended as per the stipulations of the Kyoto Protocol [26].
2.1 Description of the vapor-compression refrigeration system rig
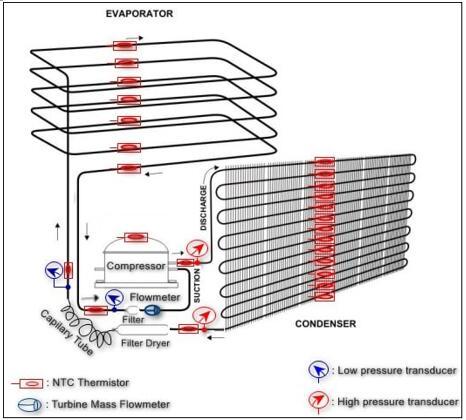
The vapor-compression refrigeration system rig used in this study can be illustrated in Figure 1, it is a chest freezer of 145 liters collected from a compressor, condenser, capillary tube, evaporator, filters, and measuring devices. The compressor used is reciprocating of 1/6 hp type Konor GQR60AA lubricated by ester oil and covers a cooling capacity of 140 watts. The compressor is connected to the condenser by a discharge line. The condenser wire is a copper tube with a length of 10.5 m and a diameter of 6.35 mm and is connected to cylindrical fins with a diameter of 1.2 mm. The capillary tube with a length of 2.6 m and a diameter of 0.62 mm connects the condenser and the evaporator. The evaporator box is wrapped inside it the evaporator wire from copper with a length of 15 m and a diameter of 7.937 mm. The evaporator is connected to the compressor via a suction line. Two filters were used in the rig, a filter dryer located between the condenser and the capillary tube which contains silica gel to absorb moisture from the refrigerant, and a filter located between the evaporator and the compressor, it works as a block of impurities as well as regulating refrigerant flow.
The measuring devices were installed in the rig to conduct the investigation and energy analysis as follows: To measure the temperatures, fourteen thermocouples of NTC Thermistors type were used in the condenser, one at the inlet and one at the outlet, and twelve in the condenser wire. In the evaporator, seven thermocouples of NTC Thermistors type were used, one at the inlet and one at the outlet, and five in the evaporator wire. The distance between one thermocouple and another is 0.72 m in the condenser and 2.5 m in the evaporator. Also, two thermocouples of NTC were used, one to measure the surface temperature of the compressor and the other to measure the ambient temperature. To measure the pressures, four pressure transducers were used, two in the high-pressure zone, one at the inlet of the condenser and one at the outlet of the condenser, and two in the low-pressure zone, one at the inlet of the evaporator and one at the outlet of the evaporator. To measure the refrigerant mass flow rate and its weight, a turbine mass flow meter, and an electronic refrigerant scale value (DSZH) were used, respectively. The voltage and current are monitored via a power meter. All measuring devices are connected to an Arduino MEGA 2560 and a computer to record and store data. Table 1 shows the specifications of the measuring devices.
Table 1. The range and uncertainty of the measuring devices
|
No. |
Device Type |
Unit |
Range |
Uncertainty |
|
1 |
Thermocouples (NTC Thermistor) |
℃ |
-50 - 110 |
±1 |
|
2 |
Pressure transducer |
bar |
0-10 |
±0.2% - ±0.5% |
|
3 |
Turbine mass flow meter |
kg/hr |
0.1-5 |
±0.1 |
|
4 |
Power meter |
A |
0 -100 |
±2% |
|
V |
80 - 260 |
±1.2% |
||
|
kW |
0 - 22000 |
±3% |
||
|
5 |
Electronic scale |
Kg |
0.005 -150 |
±0.02% |
Table 2. Comparison of the three samples' purity characteristics and AHRI standard 700
|
Specification |
AHRI-700 Standard for R134a [25] |
Sample 1 |
Sample 2 |
Sample 3 |
|
Chemical name |
Tetrafluoroethan |
Tetrafluoroethan |
Tetrafluoroethan |
Tetrafluoroethan |
|
Boiling Point |
-26.1℃ |
-26.5℃ |
-26.5℃ |
-26.5°C |
|
Water content |
Max 10 ppm w. |
Max 8 ppm w. |
Max 20 ppm w. |
Max 50 ppm w. |
|
High boiling residue |
Max 0.01% w. |
Max 0.01 %w. |
Max 0.01 %w. |
Max 0.01 % w. |
|
Acidity |
1 ppm by w. |
1 ppm by w. |
1 ppm by w. |
1 ppm by w. |
|
Non-condensable gas |
Max 1.5 % vol. |
Max 1 % vol. |
Max 3% vol. |
Max 4 % vol. |
|
Refrigerant charge |
- |
100 grams |
100 grams |
100 grams |
Figure 1. The schematic diagram of the experimental rig
2.2 Refrigerant purity characteristics
After completing the installation of measuring devices in the chest freezer, the rig is placed in a room without forced air currents (fans or air inlets) to stabilize the ambient temperature and obtain accurate and stable data. It is charged with refrigerant gas R134a (Sample 1) then it is run and the data is recorded when a steady state is reached. The process is repeated by charging the system with the same refrigerant but with different purity characteristics (Sample 2) and (Sample 3) as shown in Table 2. From where the water content and non-condensable gas are, sample 1 has superior characteristics that exceed the standard characteristics, while the characteristics of sample 2 are less than the standard properties, and sample 3 has poor characteristics relative to the standard characteristics. These samples were selected with different purity characteristics as possible to obtain more clear and understandable results. The refrigerant gas charge is constant (100 grams) in the chest freezer rig for all samples.
Applying the first and second laws of thermodynamics on the chest freezer components to determine the components' mass and energy balances and their irreversibility. Figure 2 represents an actual vapor-compression refrigeration cycle with neglect of a pressure drop between the outlet of the evaporator and the inlet of the compressor, as well as between the outlet of the compressor and the inlet of the condenser, where few pressure drops in these sections and that do not significantly affect the results of the analysis. This cycle can be applied to the chest freezer.
The compressor work, the heat rejected from the condenser, and the heat removed from the evaporator can be calculated by Eqs. (1), (2), and (3), respectively [3]:
$W_{\text {comp }}\,\,=\,\,m_{r e f}^{\cdot}\,\,\left(h_1\,\,-\,\,h_2\right)$ (1)
$Q_{\text {cond }}\,\,=\,\,m_{r e f}^{\cdot}\,\,\left(h_2-h_3\right)$ (2)
$Q_{\text {evap }}\,\,=\,\,m_{\text {ref }}^{\cdot}\,\,\left(h_1\,\,-\,\,h_4\right)$ (3)
where, Wcomp is the compressor work (W), Qcond is the heat rejected from the condenser (W), Qevap is heat removed from the evaporator (W), $m_{r e f}^{\cdot}$ is the mass flow rate of refrigerant (kg/s), h2&h3 are the inlet and outlet enthalpy of the condenser (J/kg), h4&h1 are the inlet and outlet enthalpy of the evaporator (J/kg).
Figure 2. P-h diagram of an actual vapor-compression refrigeration cycle [27]
The coefficient of performance (COP) is calculated using Eq. (4) [9]:
$C O P\,\,=\,\,\frac{Q_{\text {evap }}}{W_{\text {comp }}}$ (4)
Another indicator of performance is the calculation of the isentropic efficiency of the compressor, which represents the ideal work to the actual work done by the compressor. That efficiency can be expressed in Eq. (5) [28]:
$\eta_{i s}\,\,=(1)\frac{h_1\,\,-\,\,h_{2 s}}{h_1\,\,-\,\,h_2}$ (5)
where, ηis is the isentropic efficiency (%), h2s is the outlet enthalpy of the compressor at constant entropy (J/kg).
The power consumed in the chest freezer is greater than the power given to the compressor, where the rest of the power goes as the heat losses. It is possible to express the power consumption using Eq. (6) [29]:
$power\,\, consumption =I V \cos \emptyset$ (6)
where, I is the current (A), V is the voltage (V), $\cos \emptyset$ is the power factor.
In this section, the obtained results are presented and discussed. The results were obtained after testing the chest freezer using the three samples of R134a as working fluids and under a similar ambient temperature of 32℃, and the data were recorded after reaching the steady state.
4.1 Steady-state time
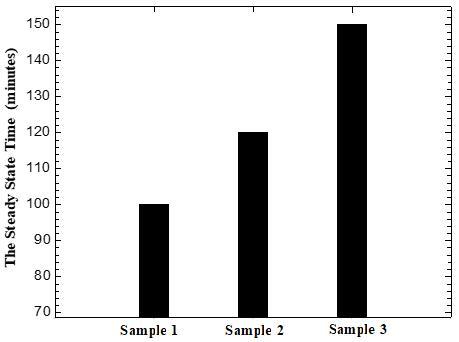
A steady state means that the temperatures and pressures of the system have reached stability with time, which leads to the implementation of the system's desired purpose. Figure 3 shows the time of arrival of the chest freezer to the steady state using the three samples. The chest freezer took 100 min to reach a steady state when using sample 1, 120 min when using sample 2, and 150 min when using sample 3. The reason for this is due to the difference in the ability to reject and remove heat between the three samples.
Figure 3. Steady state time of the chest freezer using the three samples
4.2 Consumed power
The power is consumed mainly in the compressor, but there are heat losses in the compressor and the rest of the system, which makes the power consumption greater than the power required for the work of the compressor. Figure 4 shows the work of the chest freezer compressor using the three samples and can be noted that using sample 1, the compressor work is decreased to 92 W which leads to reduced power expenditures. Not only did the compressor work, but the power consumption in the chest freezer also decreased to 120.7 W when using sample 1, as shown in Figure 5.
Figure 4. Compressor work of the chest freezer using the three samples
4.3 Surface temperature of the compressor
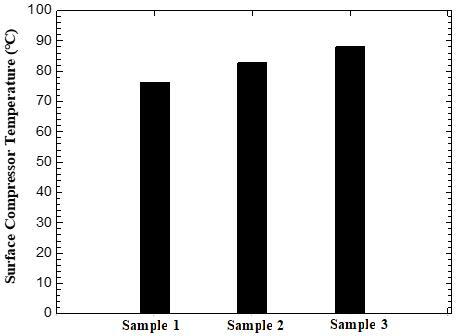
As a representation of the heat losses, the surface temperature of the compressor is observed as shown in Figure 6, where the compressor releases heat by convection and radiation. Due to the upward direction of the buoyancy force, a thermocouple was placed on the upper surface [30]. Surface compressor temperature was recorded as follows: 76.3, 82.7, and 88℃, at the use of the 1, 2, and 3 samples, respectively.
Figure 5. Power consumption in the chest freezer using the three samples
Figure 6. Surface compressor temperature using the three samples
4.4 Refrigerant mass flow rate
The power consumption of the chest freezer is lower when using sample 1, due to the excellent purity characteristics of that sample, this can be illustrated by Figure 7 which shows the refrigerant mass flow rate for the three samples, where the refrigerant mass flow rate stabilized at 5.54, 6.2, and 7.63 kg/h at use the 1, 2, and 3 samples, respectively. The decrease in the refrigerant mass flow rate leads to a decrease in the compressor work according to Eq. (1), and thus a reduction in power consumption. Moreover, dropping in the refrigerant mass flow rate leads to a decrease in the fluid velocity inside the pipes, which leads to a decrease in the heat transfer coefficient [31], thus the heat losses to the ambient are reduced. This dropping may affect the rates of heat rejection in the condenser and heat removal in the evaporator according to Eqs. (2) and (3), but there is an improvement in the temperatures of the evaporator and condenser, which will be explained in the next subsections. It is worth mentioning that the reason for the difference in the refrigerant mass flow rate is due to the difference in density, viscosity, and homogeneity of the refrigerant mixture for the three samples.
Figure 7. Refrigerant mass flow rate using the three samples
4.5 Isentropic efficiency
The isentropic efficiency of the compressor is calculated when using the three samples, it was found as follows: 74, 69, and 64% at the use of the 1, 2, and 3 samples, respectively as shown in Figure 8. This efficiency arises due to the irreversibility of the compression process, and it is also an indicator of compressor performance.
Figure 8. Isentropic efficiency of the compressor using the three samples
4.6 Condenser temperatures
The condenser temperature mainly affects the processes of heat rejection to the ambient. The increase in the condenser temperature increases the rate of heat rejection, but this increase must be within a specific design range estimated at 40-45℃ [32]. Exceeding this design range leads to adverse results, including an increase in compressor work and an increase in heat losses, and thus a general decrease in the performance of the system.
The temperature is not constant along the condenser as mentioned previously, so Figure 9 shows the distribution of temperatures along the condenser when using the three samples. The behavior is very similar for the three samples, the condenser temperature drops significantly at the entrance of the condenser up to approximately 220 cm. A sensible cooling of the refrigerant gas occurs in this zone. After that, it is observed that the temperature is almost constant from 220 cm to 850 cm. In this zone, the process of converting the refrigerant phase from gas to liquid (latent cooling) was completed. From 850 cm to the outlet of the condenser, a decrease in temperature was observed, and this is where the sub-cooling occurs. Despite the similar behavior, the difference between the condenser temperatures when using the three samples is very clear and can be evaluated through Figure 10, where the average condenser temperature was calculated for each case, neglecting the condenser temperature of the entrance zone, it turns out that the average condenser temperature when using sample 1 is 45℃, it is the closest to the standard temperature while the average condenser temperature was 48.4℃ and 53.24℃, at use the 2 and 3 samples, respectively.
Figure 9. Temperatures distribution along the condenser of the chest freezer using the three samples
Figure 10. Average condenser temperature of the chest freezer using the three samples
4.7 Evaporator temperatures
The temperature of the evaporator indicates the ability of the evaporator to secure the required temperature of space or load. The increase of the loads leads to the increase in the temperature of the evaporator, thus greater power being done on the system to return to the standard temperature. Therefore, obtaining a low standard temperature for the evaporator is considered a priority when designing and analyzing the system.
Figure 11 shows the distribution of temperatures along the evaporator when using the three samples. The behavior is very similar for the three samples, and the temperature rise can be seen along the evaporator. The phase change of the refrigerant from liquid to gas occurs approximately in the zone that lies between 50 cm to 1300 cm (latent heating) and the slight rise in the temperature of this zone is due to the high pressure of the evaporator. A sharp rise in the temperature after 1300 cm is an indication of the occurrence of superheating. Despite the similar behavior, the difference between the evaporator temperatures when using the three samples is very clear and can be evaluated through Figure 12, where the average evaporator temperature was calculated. The average evaporator temperature is -23.64, -21.2, and -19.6℃, at use the 1, 2, and 3 samples, respectively. In addition, Figure 13 shows the dryness fraction of the refrigerant at the entrance of the evaporator using the three samples. Reducing the dryness fraction means an increase in the refrigeration effect, and this was obtained when using sample 1 where the dryness fraction was 0.39, while the dryness fraction was 0.41 and 0.44 at the use of the 2 and 3 samples, respectively.
Figure 11. Temperatures distribution along the evaporator of the chest freezer using the three samples
Figure 12. Average evaporator temperature of the chest freezer using the three samples
Figure 13. Dryness fraction of the refrigerant at the entrance of the evaporator
4.8 Coefficient of performance
COP value is the most important parameter for evaluating the performance of the vapor-compression refrigeration system because indicates the refrigeration effect and power consumption together. Figure 14 shows COP values when using the three samples. It can be seen that the use of sample 1 gives the highest COP of 2.33 while samples 2 and 3 give COP of 2.07, and 1.93, respectively. This result proves that using sample 1 gives the chest freezer the best performance.
After revealing and discussing the results, it becomes clear that the use of a refrigerant charge in the VCRS with poor purity characteristics leads to a clear deterioration in performance, whether it is in power consumption or providing the required temperatures, or even in the stability of the system to perform the required purpose correctly. The stability of the system was delayed by 50 minutes, the percent of the increase in power consumption reached 17.89%, the average evaporator temperature increased by 4.04℃, and the coefficient of performance decreased by 17.16% when charging sample 3 instead of sample 1.
Figure 14. COP of the chest freezer using the three samples
This study contributed to giving performance parameters using 3 samples of the same refrigerant but different in purity characteristics as working fluids in the vapor-compression refrigeration system through experimental tests carried out on a chest freezer under the same conditions. It is concluded that the refrigerant purity characteristics significantly affect the performance of the vapor-compression refrigeration system, where the results of the tests showed varying parameters between the best sample 1 with superior characteristics, sample 2 with medium characteristics, and sample 3 with poor characteristics. The results of the use of samples 1, 2, and 3, respectively can be summarized, as follows: Steady-state time is 100, 120, and 150 min. Compressor work is 92, 116, and 132 W. Power consumption is 120.7, 138, and 147 W. The surface compressor temperature is 76.3, 82.7, and 88℃. The refrigerant mass flow rate is 5.54, 6.2, and 7.63 kg/h. Isentropic efficiency is 74, 69, and 64%. The average condenser temperature is 45, 48.4, and 53.24℃. The average evaporator temperature is -23.64, -21.2, and -19.6℃. The dryness fraction at the entrance of the evaporator is 0.39, 0.41, and 0.44. The coefficient of performance is 2.33, 2.07, and 1.93.
The disparity in the results may differ when using charges of another refrigerant such as R290 or using other systems that use refrigerants, so this field is expandable and requires more investigations.
[1] Cengel, Y.A., Boles, M.A. (2006). Thermodynamics: An Engineering Approach. 5th edition, New York: McGraw-hill.
[2] ASHRAE. (2020). Update on new refrigerants designations and safety classifications. ANSI/ASHRAE Standard 34-2019, April, 1-4. https://www.ashrae.org/technical-resources/standards-and-guidelines/ashrae-refrigerant-designations, accessed on January 2023.
[3] ASHRAE. (2017). ASHRAE Fundamentals (SI). https://www.ashrae.org/technical-resources/ashrae-handbook.
[4] Tarawneh, M. (2019). Experimental investigation of the effect of using porous internal sub-cooler on the performance of refrigeration system: R422A case study. International Journal of Heat and Technology, 37(4): 1127-1132. https://doi.org/10.18280/ijht.370422
[5] Almogbel, A., Alkasmoul, F., Aldawsari, Z., Alsulami, J., Alsuwailem, A. (2020). Comparison of energy consumption between non-inverter and inverter-type air conditioner in Saudi Arabia. Energy Transitions, 4: 191-197. https://doi.org/10.1007/s41825-020-00033-y
[6] Senthilkumar, A., Abhishek, P.V., Adithyan, M., Arjun, A. (2021). Experimental investigation of CuO/SiO2 hybrid nano-lubricant in R600a vapour compression refrigeration system. Materials Today: Proceedings, 45: 6083-6086. https://doi.org/10.1016/j.matpr.2020.10.178
[7] Barghash, S., Bahman, A., Ibrahim, A. (2021). Solar-Powered mechanical subcooling refrigeration system for hot climates. International Refrigeration and Air Conditioning Conference, Paper 2129. https://docs.lib.purdue.edu/iracc/2129.
[8] Subhedar, D.G., Patel, J.Z., Ramani, B.M. (2022). Experimental studies on vapour compression refrigeration system using Al2O3/mineral oil nano-lubricant. Australian Journal of Mechanical Engineering, 20(4): 1136-1141. https://doi.org/10.1080/14484846.2020.1784558
[9] Al-Hassani, A.H., Al-Badri, A.R. (2021). Effects of evaporator and condenser temperatures on the performance of a chiller system with a variable speed compressor. Engineering and Technology Journal, 39(1A): 45-55. http://dx.doi.org/10.30684/etj.v39i1A.1647
[10] Cecchinato, L., Dell'Eva, M., Fornasieri, E., Marcer, M., Monego, O., Zilio, C. (2007). The effects of non-condensable gases in domestic appliances. International Journal of Refrigeration, 30(1): 19-27. https://doi.org/10.1016/j.ijrefrig.2006.04.002
[11] Hamad, A.J. (2014). Experimental investigation of vapor compression refrigeration system performance using Nano-refrigerant. Wasit Journal of Engineering Sciences, 2(2): 12-27. http://dx.doi.org/10.31185/ejuow.Vol2.Iss2.26
[12] Qian, S., Nasuta, D., Rhoads, A., Wang, Y., Geng, Y., Hwang, Y., Takeuchi, I. (2016). Not-in-kind cooling technologies: A quantitative comparison of refrigerants and system performance. International Journal of Refrigeration, 62: 177-192. https://doi.org/10.1016/j.ijrefrig.2015.10.019
[13] Al-Nadawi, A.K. (2021). Irreversibility analysis of R407C, R404A, and R134A as an alternatives of R22 in vapor compression chiller under cycling conditions. International Journal of Thermodynamics, 24(1): 24-29. https://doi.org/10.5541/ijot.797614
[14] Mohammad, W.S., Jassim, A.O. (2014). Experimental and theoretical investigation of propane/butane and propane/isobutane mixtures as an alternative to R134a in a domestic refrigerator. Engineering and Technology Journal, 32(5): 1266-1286. http://dx.doi.org/10.30684/etj.32.5A.15
[15] Hamza, A., Khan, T.A. (2020). Comparative performance of low-GWP refrigerants as substitutes for R134a in a vapor compression refrigeration system. Arabian Journal for Science and Engineering, 45(7): 5697-5712. https://doi.org/10.1007/s13369-020-04525-3
[16] Tsvetkov, O.B., Laptev, Y.A., Sharkov, A.V., Mitropov, V.V., Fedorov, A.V. (2020). Alternative refrigerants with low global warming potential for refrigeration and air-conditioning industries. IOP Conference Series: Materials Science and Engineering, 905(1): 012070. https://doi.org/10.1088/1757-899X/905/1/012070
[17] Boumaraf, L., Khadraoui, R. (2020). Investigation on the performance of a solar hybrid refrigeration system using environmentally friendly fluids. International Journal of Heat and Technology, 38(4): 960-966. https://doi.org/10.18280/ijht.380423
[18] Yang, Z., Feng, B., Ma, H., Zhang, L., Duan, C., Liu, B., Yang, Z. (2021). Analysis of lower GWP and flammable alternative refrigerants. International Journal of Refrigeration, 126: 12-22. https://doi.org/10.1016/j.ijrefrig.2021.01.022
[19] Chen, S., Liu, J., Liu, X., Hou, Y. (2015). An experimental comparison of heat transfer characteristic between R134-a and R22 in spray cooling. Experimental Thermal and Fluid Science, 66: 206-212. https://doi.org/10.1016/j.expthermflusci.2015.03.015
[20] Choudhari, C.S., Sapali, S.N. (2017). Performance investigation of natural refrigerant R290 as a substitute to R22 in refrigeration systems. Energy Procedia, 109: 346-352. https://doi.org/10.1016/j.egypro.2017.03.084
[21] De Paula, C.H., Duarte, W.M., Rocha, T.T.M., de Oliveira, R.N., Maia, A.A.T. (2020). Optimal design and environmental, energy and exergy analysis of a vapor compression refrigeration system using R290, R1234yf, and R744 as alternatives to replace R134a. International Journal of Refrigeration, 113: 10-20. https://doi.org/10.1016/j.ijrefrig.2020.01.012
[22] Shen, B., Ally, M.R. (2021). Comparative performance of low global warming potential (GWP) refrigerants as replacement for R-410A in a regular 2-speed heat pump for sustainable cooling. Sustainability, 13(15): 8199. https://doi.org/10.3390/su13158199
[23] Sánchez, D., Andreu-Nácher, A., Calleja-Anta, D., Llopis, R., Cabello, R. (2022). Energy impact evaluation of different low-GWP alternatives to replace R134a in a beverage cooler. Experimental analysis and optimization for the pure refrigerants R152a, R1234yf, R290, R1270, R600a and R744. Energy Conversion and Management, 256: 115388. https://doi.org/10.1016/j.enconman.2022.115388
[24] Khatoon, S., Karimi, M.N. (2023). Thermodynamic analysis of two evaporator vapor compression refrigeration system with low GWP refrigerants in automobiles. International Journal of Air-Conditioning and Refrigeration, 31(1): 2. https://doi.org/10.1007/s44189-022-00017-1
[25] AHRI. (2019). AHRI Standard 700 - 2019 Standard for Specifications for Refrigerants. 00(M).
[26] Protocol, K. (1997). Kyoto protocol. UNFCCC Website. http://unfccc.int/kyoto_protocol/items/2830.php, accessed on 1 January 2011.
[27] Gill, J., Singh, J., Ohunakin, O.S., Adelekan, D.S. (2019). ANN approach for irreversibility analysis of vapor compression refrigeration system using R134a/LPG blend as replacement of R134a. Journal of Thermal Analysis and Calorimetry, 135: 2495-2511. https://doi.org/10.1007/s10973-018-7437-y
[28] İşkan, Ü., Direk, M. (2022). Evaluation of the effects of entrainment ratios on the performance parameters of a refrigeration machine having dual evaporator ejector system with R134a and R456A. Thermal Science and Engineering Progress, 33: 101345. https://doi.org/10.1016/j.tsep.2022.101345
[29] Askar, A.H., Kadhim, S.A., Mshehid, S.H. (2020). The surfactants effect on the heat transfer enhancement and stability of nanofluid at constant wall temperature. Heliyon, 6(7): e04419. https://doi.org/10.1016/j.heliyon.2020.e04419
[30] Bassiouny, R. (2009). Evaluating the effect of the space surrounding the condenser of a household refrigerator. International Journal of Refrigeration, 32(7): 1645-1656. https://doi.org/10.1016/j.ijrefrig.2009.03.011
[31] Kadhim, S.A., Ibrahim, O.A.A.M. (2022). The effect of holes number in cylindrical samples on the forced convection heat flow. International Journal of Mechanical Engineering and Robotics Research, 11(6): 429-436. https://doi.org/10.18178/ijmerr.11.6.429-436
[32] Bansal, P.K., Chin, T.C. (2003). Modelling and optimisation of wire-and-tube condenser. International Journal of Refrigeration, 26(5): 601-613. https://doi.org/10.1016/S0140-7007(02)00044-0