Xin Zheng![]()
© 2023 IIETA. This article is published by IIETA and is licensed under the CC BY 4.0 license (http://creativecommons.org/licenses/by/4.0/).
OPEN ACCESS
If the cooling system equipped with prime motor is not reasonably structured or lubricated sufficiently, the friction heat generated by decelerator during operation could not be dissipated effectively. To solve the problem with prime motor that its performance and efficiency both decline greatly due to the too high temperature of heat balance, it is necessary to study the temperature field and heat balance of the decelerator system, and this work is meaningful for improving the design of target system and ensuring its operation stability and reliability. To find answers of the said matter, this paper studied the heat balance features of decelerator system with its real-time reliability taken into consideration. At first, this paper analyzed the possible thermal failure modes, influence and fatality of the decelerator system, and elaborated on the method and steps of its real-time reliability analysis. Then, the decelerator system was modeled, its steady state temperature field was simulated in ANSYS Workbench, and the boundary conditions were built. At last, analysis results of the heat balance features of target system were given, which had verified the effectiveness of the proposed research method.
system reliability, decelerator, heat balance, heat conduction
Decelerators are widely used in modern machinery as they could match the rotation speed and transfer torque between prime motors and work machines or actuators [1-5]. If the cooling system equipped with prime motor is not reasonably structured or lubricated sufficiently, the friction heat generated by decelerator during operation could not be dissipated effectively [6-12], and a too high temperature of heat balance will not only sap the performance and efficiency of prime motor, but also adversely affect the sustainability of the operation of various components, in severer cases, dramatic temperature rise could even cause thermal damage to the prime motor and shorten its service life [13-20]. To find answers of the said matter, it is necessary to study the temperature field and heat balance of the decelerator system, and this work is meaningful for improving the design of target system and ensuring its operation stability and reliability.
Yang et al. [21] used the compressible Reynolds averaged Navier-Stokes equations to perform numerical simulations on hypersonic inflatable aerodynamic decelerator, and analyzed the pressure, eddy viscosity, and heat flux under three Reynolds numbers (6.89E+6, 9.94E+6, 12.73E+6), and their results suggest slight difference in surface pressure distributions and significant difference in surface heating distributions; moreover, the authors believe that compared with one equation turbulence model, two-equation turbulence models maybe more suitable for hypersonic heating predictions. Scholar Hollis [22] carried out wind-tunnel tests to study the aerothermodynamic environment of a hypersonic inflatable aerodynamic decelerator with a flexible thermal protection system. The author measured the boundary-layer transition onset locations and surface heating distributions using global phosphor thermography on deflected, solid-surface models representative of a hypersonic inflatable aerodynamic decelerator aeroshell with a flexible surface. His work offers an approach for estimating flexible thermal protection system deflection effects for future flight tests as well as an experimental database for use in the development and validation of computational methods for simulations of hypersonic inflatable aerodynamic decelerator in aerothermodynamic environments. Zhao et al. [23] pointed out in their paper that the inevitable boundary-layer transition and severe heating argumentation of Hypersonic Inflatable Aerodynamic Decelerator (HIAD) are posing challenges for survivability of Thermal Protection System (TPS), the authors minutely demonstrated the effects of sphere-cone angle on hypersonic heating and boundary-layer transition of stacked tori HIADs with 60°, 65° and 70° sphere-cone, and they discovered that transition and heating augmentation triggered on the leeward where the shape deformation causes crossflows and local flow separations are sensitive to cone angle, and smaller cone angle could withstand severer heating flux.
After reviewing relevant literatures, it’s found that domestic research on the heat balance features of decelerators is quite insufficient, existing works are mostly calculations or theoretical researches of similar equipment systems based on thermal network method, few of them have simulated the temperature field of decelerator system based on finite element analysis with the real-time reliability of the equipment and the specific operating conditions taken into consideration. To solve these matters, we carried out relevant research, in the second chapter, this paper analyzed the possible thermal failure modes, influence and fatality of the decelerator system, and elaborated on the method and steps of its real-time reliability analysis. In the third chapter, the decelerator system was modeled, its steady state temperature field was simulated in ANSYS Workbench, and the boundary conditions were built. At last, analysis results of the heat balance features of the target system were given, which had verified the effectiveness of the proposed research method.
The failure mode and influence analysis method for modern machinery is a commonly used qualitative analysis method for system qualitative analysis (Figure 1). To analyze the possible thermal failure modes, influence, and fatality of decelerator system, based on the said failure mode and influence analysis method, this paper adopted a “top-down” logical induction idea of drawing effects from causes, evaluations were made on heat dissipation design of the decelerator system from the bottom layer to the system level, then reviews and modifications were made to the design in a timely manner to figure out the influence of each thermal failure mode on the performance of the decelerator system.
Figure 1. Real-time reliability analysis of decelerator system
This paper classified the thermal failure modes of decelerator system into several types:
Type A (major failure): failures that can endanger personal safety or damage the decelerator system.
Type B (serious failure): failures that can result in personal injury and irreversible thermal failure of the decelerator system.
Type C (general failure): failures that can result in minor personal injury or minor damage to the decelerator system.
Type D (minor failure): consequences of this type of failure are not significant enough to affect the prime motor’s requirement for decelerator system, but a non-scheduled maintenance of the system is required.
This paper chose to assess thermal failure modes based on the calculation results of the probabilities of thermal failure modes of the decelerator system, at first, the probabilities of thermal failure modes of the decelerator system were divided into five levels:
Level I (high frequent): the decelerator system has a high probability of thermal failure under actual working conditions, that is, the probability of a thermal failure mode is greater than 20% of the total thermal failure probability;
Level Ⅱ (frequent): the decelerator system has a medium probability of thermal failure under actual working conditions, the probability of a thermal failure mode is about 10%-20% of the total thermal failure probability;
Level Ⅲ (occasional): the decelerator system occasionally occurs thermal failure under actual working conditions, the probability of a thermal failure mode is about 1%-10% of the total thermal failure probability;
Level IV (low frequent): the decelerator system has a small probability of thermal failure under actual working conditions, the probability of a thermal failure mode is about 0.1%-1% of the total thermal failure probability;
Level V (very low frequent): the probability of thermal failure in the decelerator system under actual working conditions is close to zero, that is, the probability of a thermal failure mode is less than 0.1% of the total thermal failure probability.
In this paper, the thermal failure severity of the decelerator system was estimated based on analytic estimation method. Under the severity degree of thermal failure modes, the maximum severity of a thermal failure mode in the multi-failure mode of the decelerator system is set as Dij; assuming: βij represents the frequency ratio of a thermal failure mode in actuator unit i, which is the ratio of the number of occurrences of thermal failure mode j in actuator unit i to the number of occurrences of all thermal failure modes in actuator unit i; γij represents the conditional probability of actuator unit i to lose a specified function when its thermal failure mode is j, μi represents the thermal failure rate of actuator unit i, p represents the duration of actual operating condition; then for a given severity degree of thermal failure modes and the actual operating conditions, the severity degree of the i-th thermal failure mode in the decelerator system can be calculated by the following formula:
${{D}_{ij}}={{\beta }_{ij}}{{\gamma }_{ij}}{{\mu }_{i}}p$ (1)
The γij in above formula is used to describe the severity degree of system failure when the j-th thermal failure mode occurs in actuator unit i.
For a certain severity degree of thermal failure modes and the actual operating conditions, D (the severity degree of failure of actuator unit i) is the sum of Dij (the severity of thermal failure modes of actuator unit i under this severity degree of thermal failure modes), assuming: m represents the number of thermal failure modes of decelerator system under the corresponding severity degree of thermal failure modes, then there is:
${{D}_{i}}=\sum\limits_{j=1}^{m}{{{D}_{ij}}}=\sum\limits_{j=1}^{m}{{{\beta }_{ij}}{{\gamma }_{ij}}{{\mu }_{i}}p}$ (2)
In order to attain the real-time reliability of the decelerator system, this paper built a failure tree model to give real-time qualitative evaluations, and the results of qualitative evaluations contain three aspects: the minimum cut set of the failure tree, the qualitative importance degree of actuator units, and the sensitivity of common cause (or common mode) thermal failure, then we can get three main qualitative results of system reliability.
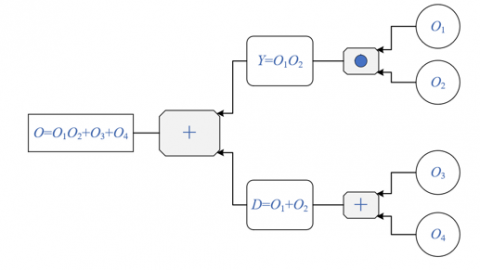
Figure 2. Failure tree model of decelerator system
The minimum cut set of failure tree is a combination of all actuator unit thermal failures that may cause system thermal failure. Figure 2 gives the structure of the constructed thermal failure tree model, the occurrence of events represents the occurrence of factors affecting the thermal failure of the system.
According to the figure, an intermediate event Y will occur only when two basic events O1 and O2 occur simultaneously; an intermediate event D will occur only when at least one event between two basic events O1 and O2 occurs; a top event P will occur only when at least one event between events Y and D occurs, therefore, it can be inferred that, O1O2, O3, O4, O1O2O3, O1O2O4, and O1O2O3O4 are cut sets of events, and only O1O2, O3, and O4 are the minimum cut sets.
The qualitative importance degree of actuator units describes the contribution of each actuator unit to the thermal failure of decelerator system. After attaining the minimum cut sets of the failure tree, by arranging them in ascending order according to the number of basic events that constitute the minimum cut sets, the qualitative importance degree of actuator units could be attained.
In terms of sensitivity to common-cause (or common-mode) thermal faults, for a minimum cut set with a small number of basic events but a high sensitivity of each actuator unit to common-cause thermal failures, its contribution to the thermal failure of the decelerator system is not necessarily less than the contribution of minimum cut sets with more basic events.
The OR gate of failure tree can be considered as a series connection in the reliability of the decelerator system. Assuming: the OR gate of failure tree whose reliability conforms to exponential distribution has m input events; μi represents failure rate, wherein i=1,2,3,...,m, then the reliability Sr(p) of the output events of OR gate can be calculated by the following formula:
${{S}_{r}}\left( p \right)=\prod\limits_{i=1}^{m}{{{S}_{i}}\left( p \right)}=\prod\limits_{i=1}^{m}{{{o}^{-{{\mu }_{i}}p}}}={{o}^{-\left( \sum\limits_{i=1}^{m}{{{\mu }_{p}}} \right)p}}$ (3)
The formula for calculating the failure rate of OR gate is:
${{\mu }_{r}}\left( p \right)=-\frac{1}{{{S}_{r}}\left( p \right)}\frac{d{{S}_{r}}\left( p \right)}{dp}=\sum\limits_{i=1}^{m}{{{\mu }_{i}}={{\mu }_{r}}}$ (4)
The AND gate of failure tree can be considered as a parallel connection in the reliability of the decelerator system. Assuming: the AND gate of failure tree whose reliability conforms to exponential distribution has n input events; μi represents failure rate, wherein i=1,2,3,...,m, then the reliability Sr(p) of the output events of AND gate can be calculated by the following formula:
${{S}_{t}}\left( p \right)=1-\prod\limits_{i=1}^{m}{\left( 1-{{S}_{j}} \right)}=1-\prod\limits_{i=1}^{m}{\left( 1-{{o}^{-{{\mu }_{j}}p}} \right)}$ (5)
The formula for calculating the failure rate of AND gate is:
${{\mu }_{t}}\left( p \right)=-\frac{1}{{{S}_{t}}\left( p \right)}\frac{d{{S}_{t}}\left( p \right)}{dp}=\left[ \sum\limits_{j=1}^{n}{{{\mu }_{j}}\left( {{C}_{j}}-1 \right)} \right]{{\left( \sum\limits_{j=1}^{n}{{{C}_{j}}-1} \right)}^{-1}}$ (6)
where, Cj=1/1-o-μjp, j=1, 2, 3, ..., n.
If the failure rates of each basic event that characterizes factors affecting the thermal failure of the system are equal, that is, μ1=μ2=...=μn=μ, then above formula can be transformed to:
${{\mu }_{t}}\left( p \right)=n\mu \left( C-1 \right){{\left( {{C}^{n}}-1 \right)}^{-1}}$ (7)
Then, based on the premise that the simplification won’t affect the thermal analysis structure, this paper modeled the decelerator system and simulated its steady state temperature field in ANSYS Workbench, that is, numerical calculations were performed based on the real-time reliability analysis results of decelerator system and conventional thermal analysis method, and the attained results were imported into the boundary conditions of each actuator unit. The grid cell type and the contact of each actuator unit were correctly set in the software to ensure normal heat conduction between each unit of the decelerator system.
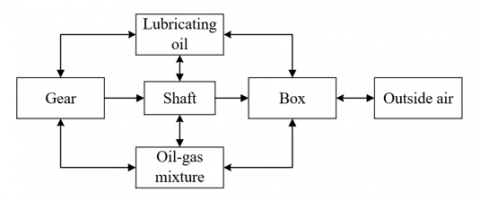
Figure 3. Heat exchange in decelerator system
There are two modes of heat exchange in a decelerator system: heat conduction between gear and shaft, and heat convection between gear and lubricating oil. The heat convection coefficient of gear is also composed of two parts: the heat conduction coefficient of the contact between gear and shaft, and the heat convection coefficient of the contact between gear and lubricating oil (Figure 3). Assuming: f represents the heat convection coefficient, T represents the density of lubricating oil, c represents the number of gear teeth, dt represents the specific heat capacity of lubricating oil, l represents the heat conduction coefficient of lubricating oil, u represents the viscosity of lubricating oil, GF represents the Prandtl number, θ represents the angular speed of gear rotation, then the heat conduction coefficient of the contact between gear and shaft can be calculated by the following formula:
${{f}_{1}}=1.395{{\left( \frac{\sigma {{d}_{t}}u}{lc} \right)}^{1/4}}\frac{\sqrt{l{{d}_{t}}\sigma }}{2\pi }$ (8)
The heat conduction coefficient of the contact between gear and lubricating oil is given by the following formula:
${{f}_{2}}=2{{\left[ \frac{1.07\left( 2+3.99 \right)GF}{57} \right]}^{1/3}}\cdot l\sqrt{\frac{\theta }{u}}$ (9)
In the decelerator system, the contact between shaft and gear, between shaft and bearing, and between shaft and lubricating oil, can perform heat conduction and heat convection. Assuming: c represents the diameter of shaft, NO represents the Reynolds number, GF represents the Prandtl number, θ represents the angular speed of shaft rotation, u represents the kinematic viscosity of lubricating oil, l represents the heat conduction coefficient of lubricating oil, then the calculation formula of heat convection coefficient between shaft and lubricating oil is:
$\left\{ \begin{align} & {{f}_{3}}=0.14\frac{l}{c}{{\left[ 0.487N{{O}^{2}}GF \right]}^{1/3}} \\ & NO=\frac{\pi \theta {{c}^{2}}}{u} \\\end{align} \right.$ (10)
After the constructed gear and shaft model was loaded in ANSYS Workbench, the model was then meshed based on the Hex dominant method. Then specific data of gear-shaft heat conduction coefficient, heat convection coefficients of ambient temperature and other actuator units, and the power of friction heat were loaded in the software model and boundary conditions, after the loading was completed, the Temperature in Solution was clicked to attain the solution of gear and shaft temperature field of the decelerator system.
In the decelerator system, the contact between bearings and shaft, between bearings and box body, and between bearings and lubricating oil also perform heat conduction and heat convection. Assuming: m represents the rotation speed of the shaft, “+” represents the outer circle rotation of bearings, c0 represents the diameter of bearing roller, γ0 represents the contact angle of bearings, “-” represents the inner circle rotation of bearings, cv represents the bearing pitch diameter, l represents the heat conduction coefficient of lubricating oil, GF represents the Prandtl number, u represents the kinematic viscosity of lubricating oil, then the calculation formula of heat convection coefficient between bearings and lubricating oil is:
${{f}_{4}}=0.0972{{\left\{ \frac{m}{v}\left[ 1\pm \frac{{{c}_{0}}\cos \left( {{\gamma }_{0}} \right)}{{{c}_{u}}} \right] \right\}}^{1/2}}\cdot lG{{F}^{\frac{1}{3}}}$ (11)
After the constructed bearing model was loaded in ANSYS Workbench, it was also meshed based on the Hex dominant method. Again, the specific data of heat convection coefficient of each bearing group, heat convection coefficients of ambient temperature and other actuator units, and the power of friction heat were loaded in the software model and boundary conditions, after the loading was completed, the Temperature in Solution was clicked to attain the solution of bearing temperature field of the decelerator system.
The box body of the decelerator system performs heat convection with the oil-gas mixture inside the box and the outside air. Assuming: NO represents the Reynolds number of the lubricating oil, GF1 represents the Prandtl number of the lubricating oil, k1 represents the length of the wall inside the box, u represents kinematic viscosity of the lubricating oil, v represents the flow rate of gear oil, then the following formula calculates the heat exchange coefficient between the box body of decelerator system and the oil-gas mixture inside the box:
$\left\{ \begin{align} & {{f}_{5}}=0.721NO_{1}^{1/2}GF_{1}^{1/3}\left( {{\mu }_{1}}/{{k}_{1}} \right) \\ & N{{O}_{1}}=\frac{{{v}_{1}}{{k}_{1}}}{u} \\\end{align} \right.$ (12)
The formula for calculating the heat exchange coefficient between the box body of decelerator system and the outside air is:
$\left\{ \begin{align} & {{f}_{6}}=0.324NO_{2}^{0.675}GF_{2}^{0.4}\left( {{\mu }_{2}}/{{k}_{2}} \right) \\ & N{{O}_{2}}=\frac{{{v}_{2}}{{k}_{2}}}{s} \\\end{align} \right.$ (13)
The operating environment of the prime motor system is usually complex, and it’s hard to determine the flow speed of air around the box body of the decelerator system, so in this paper, it’s assumed that L represents the heat conduction coefficient of the box, ε represents the average wall thickness of the transmission case, μ represents the heat conduction coefficient of the transmission case, then the formula for calculating the heat convection coefficient between the outer surface of the box body of decelerator system and the ambient air is:
$L=\frac{1}{\frac{1}{{{f}_{5}}}+\frac{\varepsilon }{\mu }+\frac{1}{{{f}_{6}}}}$ (14)
Once more, the constructed decelerator system box body model was loaded in ANSYS Workbench, and was also meshed based on the Hex dominant method. The specific data of heat conduction coefficient of box body, the ambient temperature, and the heat convection coefficients between other actuator units, lubricating oil, and the air were loaded in the software model and boundary conditions, after the loading was completed, the Temperature in Solution was clicked to attain the solution of box body temperature field of the decelerator system.
This paper took ordinary decelerators as subjects to analyze the reliability of decelerator system and make predictions of non-scheduled system maintenance, thereby formulating effective and preventive decisions of maintenance cycle and plan. Calculations were made based on the analysis method proposed in the second chapter to count the severity of different failure modes of the decelerator system and give real-time evaluations of system reliability. By summarizing the evaluation results, it’s determined that the average maintenance time and afterwards maintenance time of scheduled preventive maintenance are 1.5 hours and 2.5 hours, respectively. Table 1 shows the test results of general maintenance time distribution of the target decelerator system, then it can be known that the distribution of total service life (from rarely fail, to frequently fail, until the system is scrapped) of the target decelerator system conforms to the Weibull distribution.
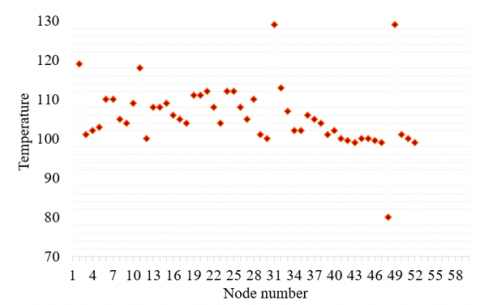
Figure 4 shows the node temperature field distribution of the decelerator system. According to the figure, the surface of sun gear in the target system reached the highest temperature of about 130℃, the driving bevel gears with large heat generation and some bearings also reached a high temperature of around 110℃. According to the results of entire node temperature distribution, it’s known that compared with measuring nodes with no generated heat, the temperature of measuring nodes with larger heat generation or closer to the heat source was obviously higher. The surface of sun gear teeth and the inner surface of sun gear shaft perform heat conduction through metals, for measuring nodes set at these positions, the measured temperature values were close. Most of the heat of the decelerator box came from the convective heat exchange with lubricating oil, and the temperature of surface measuring nodes was relatively low.
Table 1. Distribution of service life
|
Distribution type |
X2 test |
K-S test |
||||
|
Sampling statistics |
Critical value |
Accept or not |
Sampling statistics |
Critical value |
Accept or not |
|
|
Normal distribution |
1522.465 |
5.879 |
No |
0.915 |
0.254 |
No |
|
Logarithmic normal distribution |
18.674 |
5.879 |
No |
0.954 |
0.254 |
No |
|
Weibull distribution |
3.724 |
5.879 |
Yes |
0.218 |
0.254 |
Yes |
Table 2. Heat balance features of heat-generating nodes
|
Node name |
Amount of generated heat |
Feature size |
Rotation speed |
Temperature |
|
Driving bevel gear |
1350.4 |
57.8 |
6000 |
119.23 |
|
Driven bevel gear |
1350.4 |
221 |
1675 |
102.84 |
|
Planet gear |
460.8 |
94 |
789.6 |
112.54 |
|
Sun gear |
1361.5 |
84 |
1674 |
128.64 |
|
Gear ring |
588.4 |
257 |
0 |
105.56 |
|
Bearing 1 |
849.3 |
97 |
6000 |
108.24 |
|
Bearing 2 |
16.5 |
44 |
6000 |
101.24 |
|
Bearing 3 |
195.5 |
52.6 |
6000 |
107.21 |
|
Bearing 4 |
1687.5 |
197 |
1684 |
109.75 |
|
Bearing 5 |
1348.5 |
197 |
1684 |
109.58 |
|
Bearing 6 |
43.5 |
52.6 |
785.6 |
104.68 |
|
Bearing 7 |
196.4 |
146 |
405 |
101.54 |
|
Bearing 8 |
42.3 |
117 |
405 |
100.3 |
Figure 4. Node temperature field distribution of the decelerator system
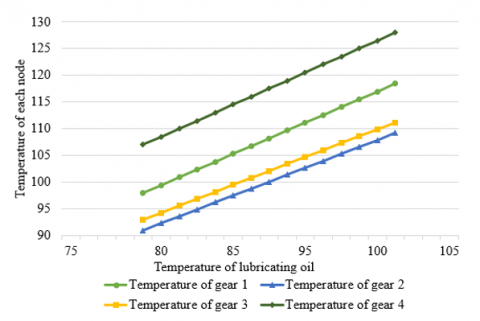
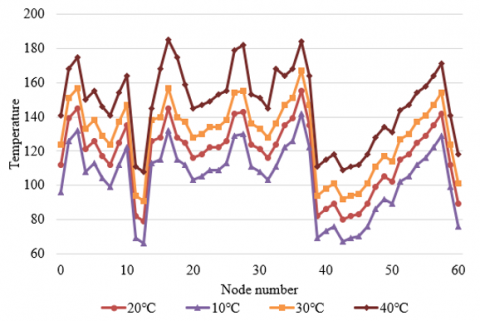
Figure 5. Influence of lubricating oil temperature on the temperature of each measuring node
Table 2 shows the heat balance features of heat-generating nodes in the target system. According to the table, the temperature of heat-generating nodes in the target system was greatly affected by the heat amount, feature size, and rotation speed of corresponding components, specifically, it was proportional to the amount of generated heat, and inversely proportional to feature size and rotation speed. In case of systems with small amount of generated heat, large size, and high rotation speed, the heat is less likely to accumulate, and the probability of thermal failure is lower.
To analyze the influence of lubricating oil temperature on the temperature of each measuring node, this paper selected four measuring nodes for temperature measurement, including the driving bevel gear(P1), driven bevel gear(P2), sun gear(P3) and planet gear(P4). By changing the temperature of lubricating oil, the temperature values of these measuring nodes were attained, and the results are given in Figure 5. As can be seen in the figure, with increase of lubricating oil temperature, the temperature values of the four measuring nodes increased linearly with it, which had verified that decreasing the lubricating oil temperature can improve the cooling effect of the target system, and reduce the operating temperature of important measuring nodes.
The ambient temperature was set to 10℃, 20℃, 30℃, and 40℃ respectively to measure the steady-state temperature field distribution of the target system, and the distribution results are shown in Figure 6.
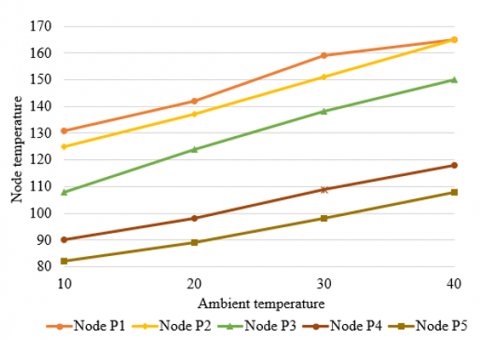
To further figure out the law of temperature changes of the four measuring nodes (P1-P4) and the decelerator box (P5) under different ambient temperatures. Figure 7 shows the changes in temperature of each measuring node of the target system under different ambient temperatures.
According to the figure, measuring nodes with greater amount of generated heat or closer to the heat source were greatly affected by ambient temperature, compared with measuring nodes without heat generation, the trend of their temperature rise was faster. As the temperature rose, the decelerator box and the lubricating oil as a whole showed a linear upward trend. When the ambient temperature exceeded 40℃, the operating temperature of each actuator unit in the target system was higher, the real-time reliability of the system was poor, and the probability of thermal failure was high.
Figure 6. Steady-state temperature field distribution of the target system under different ambient temperatures
Figure 7. Changes in temperature of each measuring node of the target system under different ambient temperatures
Figure 8. Temperature field distribution of target system under different input rotation speeds
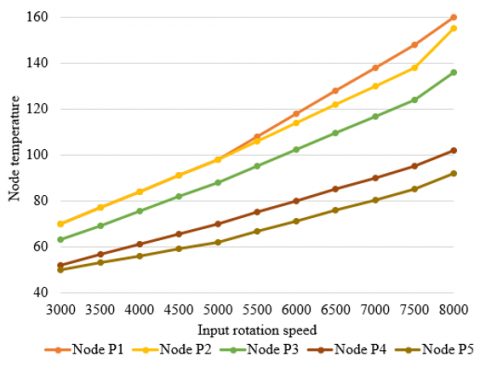
Figure 9. Temperature variation of each measuring node of target system under different input rotation speeds
Figure 8 and Figure 9 show the temperature field distribution and the temperature of each measuring node of the target system under different input rotation speeds. According to Figure 8, the temperature of the target system was greatly affected by the input rotation speed, the thermal damage of the target system got worse as the input rotation speed grew higher, and more heat generated by the thermal failure could not be effectively dissipated. Compared with the temperature rise of measuring nodes on gears, the temperature rise of measuring nodes on bearings was greater, and the main reason is that compared with the influence of rotation speed on the temperature field of gears, the influence of rotation speed on the temperature field of bearings was greater.
According to Figure 9, the temperature of each key measuring node showed a trend of linear slow rise at and below the rated rotation speed. If the rotation speed of the target system exceeds the rated rotation speed, the overall system temperature will rise faster, the real-time reliability of the system will get worse, and the probability of thermal failure will be higher. Therefore, measures should be taken to prevent the rotation speed of the system from exceeding the rated rotation speed so as to avoid thermal failure and prevent the target system from overheating.
This paper explored the heat balance features of decelerator system with its real-time reliability taken into consideration. At first, this paper analyzed the possible thermal failure modes, influence, and fatality of decelerator system, and elaborated on the method and steps of its real-time reliability analysis. Then, the decelerator system was modeled, its steady state temperature field was simulated in ANSYS Workbench, and the boundary conditions were built. Calculations were made based on the analysis method proposed in the second chapter to count the severity of different failure modes of the decelerator system and give real-time evaluations of system reliability. After that, this paper gave the test results of general maintenance time distribution of the target decelerator system, and found that the distribution of total service life (from rarely fail, to frequently fail, until the system is scrapped) of the target decelerator system conforms to the Weibull distribution. Moreover, this paper figured out the heat balance features of the heat-generating nodes of the target system, analyzed the influence of lubricating oil temperature on the temperature of each measuring node of the target system, and verified that decreasing the lubricating oil temperature can improve the cooling effect of the target system. At last, this paper also gave the steady-state temperature field distribution and the temperature variation of each measuring node of the target system under different ambient temperatures and under different input rotation speeds, and gave the corresponding analysis results.
[1] Yu, Z., Xu, P., Li, H., Zhang, Y. (2023). The decelerator tester twisting distortion caused angular measurement error calibration, based on the IBSCF-SGDPSO-RBF method. Measurement, 207: 112374. https://doi.org/10.1016/j.measurement.2022.112374
[2] Jain, P., Sirohi, J., Cameron, C. (2022). Design, analysis, and testing of a passively deployable autorotative decelerator. Journal of Aircraft, 59(1): 272-277. https://doi.org/10.2514/1.C036509
[3] Narevicius, J., Narevicius, E. (2022). Multichannel high peak power tunable duration pulse generation for the moving magnetic trap decelerator. Review of Scientific Instruments, 93(1): 013202. https://doi.org/10.1063/5.0077604
[4] Thonet, P.A. (2022). Design and manufacturing of two high gradient quadrupoles based on permanent magnets for the cern antiproton decelerator. IEEE Transactions on Applied Superconductivity, 32(6): 1-5. https://doi.org/10.1109/TASC.2022.3156899
[5] He, Q., Wang, G., Wang, Q., Zhang, Z., Wang, L., Jia, H. (2022). Effects of air properties on flow filed characteristics of inflatable reentry decelerator. Journal of Northwestern Polytechnical University, 40(1): 158-166.
[6] Zhao, Y., Yan, C., Liu, H., Qin, Y. (2019). Assessment of laminar-turbulent transition models for Hypersonic Inflatable Aerodynamic Decelerator aeroshell in convection heat transfer. International Journal of Heat and Mass Transfer, 132: 825-836. https://doi.org/10.1016/j.ijheatmasstransfer.2018.11.025
[7] Lees, A., Koettig, T., Fernandes, M., Tan, J. (2017). Design and optimisation of low heat load liquid helium cryostat to house cryogenic current comparator in antiproton decelerator at CERN. IOP Conference Series: Materials Science and Engineering, 171: 012033. https://doi.org/10.1088/1757-899X/171/1/012033
[8] Lees, A., Koettig, T., Fernandes, M., Tan, J. (2017). Cryogenic upgrade of the low heat load liquid helium cryostat used to house the Cryogenic Current Comparator in the Antiproton Decelerator at CERN. IOP Conference Series: Materials Science and Engineering, 278: 012193. https://doi.org/10.1088/1757-899X/278/1/012193
[9] Clark, I.G., O'Farrell, C., Sackier, C.V., Karlgaard, C., Zumwalt, C.H., Way, D.W. (2022). Reconstructed performance of the mars 2020 parachute decelerator system. In 2022 IEEE Aerospace Conference (AERO), Sky, MT, USA, pp. 1-20. https://doi.org/10.1109/AERO53065.2022.9843441
[10] Saxena, C., Prakash, L.S. (2021). Design and mathematical modelling of pressurisation system for inflatable aerodynamic decelerator. International Journal of Fluid Machinery and Systems, 14(2): 161-167. https://doi.org/10.5293/IJFMS.2021.14.2.161
[11] Müller, J.A., Elhashash, M.Y.M.K., Gollnick, V. (2022). Electrical launch catapult and landing decelerator for fixed-wing airborne wind energy systems. Energies, 15(7): 2502. https://doi.org/10.3390/en15072502
[12] Shi, S.H., Zhu, X.M., Yang, L.H. (2019). Development of hydraulic braking system for decelerator. In 2019 IEEE 8th International Conference on Fluid Power and Mechatronics (FPM), Wuhan, China, pp. 355-359. https://doi.org/10.1109/FPM45753.2019.9035800
[13] Brune, A.J., Hosder, S., Edquist, K.T., Tobin, S.A. (2017). Thermal protection system response uncertainty of a hypersonic inflatable aerodynamic decelerator. Journal of Spacecraft and Rockets, 54(1): 141-154. https://doi.org/10.2514/1.A33732
[14] Brune, A.J., Hosder, S., Edquist, K.T., Tobin, S. (2016). Uncertainty analysis of thermal protection system response of a hypersonic inflatable aerodynamic decelerator. In 46th AIAA Thermophysics Conference, Washington. https://doi.org/10.2514/6.2016-3535
[15] Goldman, B.D., Dowell, E.H., Scott, R.C. (2015). Aeroelastic stability of thermal protection system for inflatable aerodynamic decelerator. Journal of Spacecraft and Rockets, 52(1): 144-156. https://doi.org/10.2514/1.A33001
[16] Kersevan, R. (2015). The vacuum system of the extra-low energy antiproton decelerator ELENA at CERN. In 6th International Particle Accelerator Conference, Richmond, VA, USA, pp. WEPHA010.
[17] Clark, I.G., Gallon, J.C., Witkowski, A. (2015). Parachute decelerator system performance during the low density supersonic decelerator program’s first supersonic flight dynamics test. In 23rd AIAA Aerodynamic Decelerator Systems Technology Conference, Daytona Beach. https://doi.org/10.2514/6.2015-2130
[18] Marco-Hernandez, R., Angoletta, M.E., Ludwig, M. (2016). A new orbit system for the CERN antiproton decelerator. In International Beam Instrumentation Conference, Melbourne, Australia, pp. TUPB058. http://dx.doi.org/10.18429/JACoW-IBIC2015-TUPB058
[19] Tobin, S.A., Dec, J.A. (2015). Probabilistic design demonstration of a flexible thermal protection system for a hypersonic inflatable aerodynamic decelerator. In 53rd AIAA Aerospace Sciences Meeting, Kissimmee, Florida. https://doi.org/10.2514/6.2015-1895
[20] Gallon, J., Witkowski, A., Clark, I.G., Rivellini, T., Adams, D.S. (2013). Low density supersonic decelerator parachute decelerator system. In AIAA Aerodynamic Decelerator Systems (ADS) Conference, Daytona Beach, Florida. https://doi.org/10.2514/6.2013-1329
[21] Yang, H., Ji, Y. M., Lin, J., Chen, S.S., Gao, Z.H. (2022). Investigation into the influences of turbulence models on heating prediction of hypersonic inflatable aerodynamic decelerator. Journal of Physics: Conference Series, 2235: 012015. https://doi.org/10.1088/1742-6596/2235/1/012015
[22] Hollis, B.R. (2018). Surface heating and boundary-layer transition on a hypersonic inflatable aerodynamic decelerator. Journal of Spacecraft and Rockets, 55(4): 856-876. https://doi.org/10.2514/1.A34046
[23] Zhao, Y., Liu, H., Liu, Z., Yan, C. (2020). Numerical study of the cone angle effects on transition and convection heat transfer for hypersonic inflatable aerodynamic decelerator aeroshell. International Communications in Heat and Mass Transfer, 110: 104406. https://doi.org/10.1016/j.icheatmasstransfer.2019.104406