Saif Ali Kadhim*![]() | Moafaq K.S. Al-Ghezi
| Moafaq K.S. Al-Ghezi![]() | Waleed Yousif Shehab
| Waleed Yousif Shehab![]()
© 2023 IIETA. This article is published by IIETA and is licensed under the CC BY 4.0 license (http://creativecommons.org/licenses/by/4.0/).
OPEN ACCESS
This study presents a solution to the selection of the optimum orientation for non-tracking solar photovoltaic panels and non-tracking solar thermal collectors with a new methodology in Baghdad city. The optimum tilt angle of solar application was determined monthly, seasonal and yearly based on the largest monthly average daily total solar radiation incident on the surface in Baghdad. The solar radiation and tilt angle were calculated theoretically with the help of MATLAB R2016b and the theoretical data of solar radiation were validated via comparison with experimental data. The optimum tilt angle results of months have been ranging as follows: from 3.77˚ for June to 62.88˚ for December, moreover the optimum tilt angle results for the seasons and year have been as follows: 60.41˚, 38.88˚, 5.26˚, 31.34˚ and 33.97˚ for winter, spring, summer, autumn and annual respectively, and best directing the fixed solar applications toward the south. The results were compared with previous studies and showed an increase in monthly average daily total solar radiation for all months except for April and September.
solar energy, tilt angle, orientation, solar photovoltaic panels, solar thermal collectors
Solar energy is considered the prominent type of renewable energies, which is very available in Baghdad city due to the clear weather on most days of the year. Solar energy is a very large, inexhaustible source of energy, moreover, using solar energy instead of fossil fuels reduces CO2 emissions and thus reduces global warming [1]. Solar energy can be transformed into electricity by a solar photovoltaic panel or to thermal energy by a solar collector to use for many purposes [2-9].
Solar radiation is the source of solar energy, which reaches the earth in three types: beam solar radiation or direct radiation, which constitutes about 80% of the total solar radiation, and diffuse solar radiation, which constitutes about 18% and the rest ground solar radiation [10]. The performance of solar applications increases as the polarization of solar radiation is greater [11, 12]. Because of the movement of the sun through the whole day, the optimum strategy to collect the utmost amount of solar radiation (energy) is by using a tracking system [13]. However, tracking devices are expensive and require energy to operate, and they cannot always be used in solar applications. As a result, it is often more practical to situate both solar photovoltaic panel and solar collector at a perfect tilt angle and to adjust the angle occasionally if possible.
There are several methods to calculate the ideal tilt angle, such as increasing the extraterrestrial solar radiation [14], enlarge the direct solar radiation incident on the surface [15], increasing the total solar radiation incident on the surface [16], and maximizing the total incident solar radiation in different regions [17, 18].
Many researchers presented suggestions about the optimum tilt angle, whether it is daily, monthly, seasonal or yearly and for any location or for specific regions.
Some of them utilized the latitude in order to identify the perfect tilt angle. For instance, Lunde et al. [19-21] they suggested that the ideal tilt is ±15˚ from latitude, Heywood [22] reported that the optimum tilt angle equal latitude is - 10˚, Löf and Tybout [23] they revealed that the best tilt angle equals to latitude + 10˚....30˚, and Kalogirou [24] found that the optimum tilt angle equals to latitude ± 10˚....15˚. The minus and plus signs refer to summer and winter seasons, respectively.
Some researchers identified the best tilt angle in specific areas to get better results. Ibrahim [25] found that the best tilt angle equals to (latitude + 13˚) & (latitude - 21˚) for Cyprus. For Tehran city, Asl-Soleimani et al. [26] they found that the yearly optimum tilt angle is 30˚, which is a bit less than the local latitude. For Izmir city, Gunerhan and Hepbasli [14] they revealed that the annual best tilt angle is 30˚, which is roughly equals to the local latitude. In addition, in the United States, Lave and Kleissl [27] they determined that the yearly best tilt angles for several regions ranges latitude - 1˚.... 10˚. Ben Eke [28] determined the optimum tilt angle for Zaria city monthly and annually. It was found that the annual optimal tilt angle is 22.5˚. Sultan et al. [29] they measured the monthly, seasonal, and yearly best tilt angle for three Iraqi cities. It was found that the yearly optimum tilt angles are 35˚, 33˚, and 31˚ in Kirkuk, Baghdad, and Nasiriyah, respectively and revealed that these angles are similar to the latitude of those cities. For Abu Dhabi City, Jafarkazemi and Saadabadi [30] they concluded that the yearly optimum tilt angle is 22˚, which is nearly equals to the latitude of the city. Khadim et al. [31] they determine the optimum tilt angle for most of the cities of Iraq monthly and annually, and they found that the annual optimum tilt angles are approximately equal to the latitude for each city. Khasawneh et al. [32] they found the optimum annual tilt angle in northern Jordan of 30˚, which is close to the latitude of this the areas. Abood [33] concluded that for Baghdad city, a yearly optimum tilt angle of 33˚ equals to the city latitude. Zang et al. [34] they measured the monthly, seasonally and annually optimal tilt angle for six cities in China. It was found that the annual optimum tilt angle for a south-facing 15˚, 24.2˚, 27.4˚, 39.0˚, 47.1˚, and 27.5˚ in Sanya, Shanghai, Zhengzhou, Harbin, Mohe, and Lhasa, respectively. Moreover, the cities latitude is similar to the tilt angles. Berisha et al. [35] they determined the optimum tilt angle for Pristina city monthly, seasonal and annual, and found that the annual optimum tilt angle 34.7˚. Uzair et al. [36] they presented a new methodology for determining the optimum tilt angle in Cyprus, and found that the annual optimum tilt angle 30.3˚ which maximizes the rate of solar radiation by 3.3% compared to previously publish.
After the literature review, it becomes clear that the annual optimum tilt angle for a specific region is often equal to the latitude of that region and most of these researches depend on one model to determine the optimum tilt angle, which gives the best solar radiation gain depending only on the time of noon.
The current study aims to make the biggest gain of the solar radiation energy falling on the various non-tracking solar applications of the Baghdad city, the most important of which are photovoltaic panels and solar collectors. This is done by determining the optimum tilt angle for all months of the year and for each season, as well as determining them annually.
In the current study, an innovative methodology will be used to determine the optimum orientation for different non-tracking solar applications by formulating three mathematical models, each model gives an optimum monthly tilt angle different from the other. These angles will be compared on the basis of maximizing the incident solar radiation.
The purpose of determining the optimum tilt angle, monthly, seasonally, annually, as follows:
1. Monthly: This can be used for solar applications whose tilt angle can be easily corrected, such as solar photovoltaic panels.
2. Seasonally: This can be used in seasonal solar applications like solar air heater collectors.
3. Yearly: This can be used in fixed solar applications like solar inclined box cookers.
2.1 Solar angles
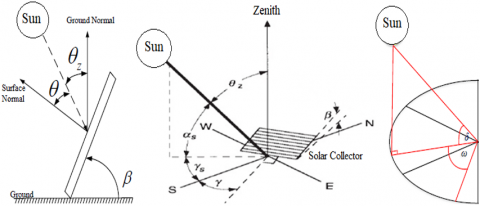
The situation of solar collector with respect to sun can be represented in terms of various angles, as depicted in Figure 1. The Latitude angle (φ) represents the angular position north or south of the equator. Tilt angle (β) is the angle between the collector plane and the horizontal ground which ranges (0˚ ≤ β ≤ 180˚). Declination angle (δ) can be defined as the angle between the projection sun-earth central line on the equatorial plane and the sun-earth center line. It is varied from -23.45˚ to 23.45˚. Azimuth angle (γ) represents the deviation of the projection on a horizontal plane of the normal to the surface from the local meridian. This angle is set to zero in the south, negative in the east, while west was considered positive, and ranges (-180˚ ≤ γ ≤ 180˚). Solar azimuth angle (γs): this angle is the angular displacement from south of the projection of beam radiation on the horizontal plane. Hour angle (ω): represents the angular displacement of the sun east or west of the local meridian because of the earth rotation around its axis, which is about 15˚ per hour. Morning hours are considered negative while afternoon hours are considered positive, and at noon 0˚. Zenith angle (θz): it represents the angle between the sun and the ground perpendicular line. Solar altitude angle (αs): it depicts the angle between the sun ground horizontal plane (the complement of the zenith angle). Incidence angle (θ): it is the angle between direct solar radiation on a surface and the surface perpendicular line (the zenith angle equals incidence angle on a horizontal surface).
Declination angle, hour angle, zenith angle, solar altitude angle, and incidence angle can be found using Eqns. (1)-(5) [10, 37]:
$\delta=23.45 \sin \left[\frac{360}{365}(284+n)\right]$ (1)
$\omega=15(A S T-12.00)$ (2)
$\cos \theta_z=\cos \delta \cos \varphi \cos \omega+\sin \varphi \sin \delta$ (3)
$\alpha_s=90-\theta_z$ (4)
$\begin{gathered}\cos \theta=\cos \beta \sin \delta \sin \varphi-\sin \beta \cos \gamma \sin \delta \\ \cos \varphi+\cos \beta \cos \delta \cos \varphi \cos \omega+\sin \beta \sin \gamma \\ \cos \delta \sin \omega+\sin \beta \cos \gamma \cos \delta \sin \varphi \cos \omega\end{gathered}$ (5)
where: n: number of day in the year (starts n=1 in 1 January), AST: the apparent solar time (AST = 12.00 at noon).
Figure 1. Solar angles [9, 38]
2.2 Solar radiation calculations
The total solar radiation angle of incidence on the surface can be determined using Eq. (6) [10]:
$G_T=G_b+G_d+G_r$ (6)
where, $G_T, G_b, G_d$ and $G_r:$ total solar radiation, which is the sum of the beam radiation $G_b$, diffuse radiation $G_d$, and the ground-reflected radiation $G_r$, respectively in $\left(\mathrm{W} / \mathrm{m}^2\right)$.
The on surface solar beam radiation ($G_b$) can be found using Eq. (7) [39]:
$G_b=G_{D N} . \cos \theta$ (7)
where, $G_{D N}$ represents the direct perpendicular solar radiation (W/m2).
The ($G_{D N}$) can be determined using Eq. (8) [40]:
$G_{D N}=A \exp \left(\frac{-B}{\sin \alpha_s}\right)$ (8)
$A=G_{s c}\left(1+0.033 \cos \frac{360 . n}{365}\right)$ (9)
$B=0.1745-0.0325 \cos \frac{360 . (n-21)}{365}$ (10)
where, A is the apparent solar radiation (W/m2) (at air mass=0), and B represents the atmospheric extinction coefficient, Gsc depicts the solar radiation constant (W/m2) which is 1367 W/m2 [10].
Eq. (8) gives GDN values for days with clear sky with ideal atmosphere values of 15% higher. This Eq. overestimates the GDN values compared to the measured ones. Thus, a correction factor (Ko) can be used to get the practical values for Baghdad city. This factor can be found using Eq. (11) [41].
$K_o=1+M_o \sin \alpha_s$ (11)
where, Mo represents a numerical variable that has certain value for each month, as shown in Table 1.
Table 1. Values of the variable (Mo) [41]
|
Month |
Mo |
|
JAN. |
2.15 |
|
FEB. |
2.05 |
|
MAR. |
1.925 |
|
APR. |
1.75 |
|
MAY. |
1.6 |
|
JUN. |
1.512 |
|
JUL. |
1.462 |
|
AUG. |
1.487 |
|
SEP. |
1.58 |
|
OCT. |
1.736 |
|
NOV. |
1.975 |
|
DEC. |
2.050 |
The corrected values of the GDN can be obtained by introducing the correction factor Ko into Eq. (8):
$G_{D N}=A \exp \left(\frac{-K_o . B}{\sin \alpha_s}\right)$ (12)
The (Gd) value is determined using Eqns. (13) and (14) [40]:
For horizontal surface:
$G_d=C G_{D N}$ (13)
For vertical or tilt surface:
$G_d=Y C G_{D N}$ (14)
where, Y is the ratio of sky diffuses radiation on vertical surface to that on horizontal surface, C represents a dimensionless average ratio of diffuse to normal beam radiation.
Both (Y) and (C) values can be calculated from Eqns. (15) and (16) [42, 43]:
$Y=0.55+0.437 \cos \theta+0.313 \cos ^2 \theta$ (15)
$C=0.0965\left[1-0.42 \cos \left(\frac{360 n}{370}\right)\right]-0.0075[1-\cos (1.95 n)]$ (16)
The (Gr) can be determined using Eq. (17) [40]:
$G_r=\frac{1}{2} \rho_g G_{D N}\left(C+\sin \alpha_s\right)(1-\cos \beta)$ (17)
where, ρg is the ground reflectivity, can be considered 0.22 [44].
Using the values of Eq. (8), the daily total solar radiation incident on the surface is calculated using the trapezium method [45], Eq (18):
$G_{T d}=b\left[\frac{G_{T 1}}{2}+G_{T 2}+G_{T 3}+\cdots+\frac{G_{T n}}{2}\right]$ (18)
where, GTd is the total daily solar radiation in (J/m2), while b depicts the time increments (sec).
On the other hand, the daily averaged total solar radiation in a month normal on the surface $\left(\overline{H_T}\right)$ can be found by determining the daily total solar radiation in the average day of month (that is, $\overline{H_T}=G_{T d}$ in average day of month). The average day of month is illustrated in Table 2 .
Table 2. The values of monthly average day [10]
|
Month |
Average day of month |
|
JAN. |
17 |
|
FEB. |
16 |
|
MAR. |
16 |
|
APR. |
15 |
|
MAY. |
15 |
|
JUN. |
11 |
|
JUL. |
17 |
|
AUG. |
16 |
|
SEP. |
15 |
|
OCT. |
15 |
|
NOV. |
14 |
|
DEC. |
10 |
2.3 Finding the optimum tilt angle
In the previous section, it was found that the incidence angle directly affects the value of beam solar radiation incident on the surface. Since beam solar radiation represents 80% or more of the total solar radiation, the incidence angle can be considered as the most important factor that affects the amount of solar radiation. Therefore, when the incidence angle is zero (max.cos θ=1) or close to zero, maximum solar radiation can be obtained.
The incidence angle is calculated from Eq. (5) and given the parameters of that equation, only the azimuth and tilt angles can be controlled. The optimum azimuth angle when facing south is (γ=0) [46-48]. Therefore, the parameter that gives (max. cos θ) represents the optimum tilt angle.
The ideal tilt angle can be found through deriving Eq. (5), where that $\left(\frac{d \cos \theta}{d \beta}=0, \frac{d^2 \cos \theta}{d \beta^2}<0\right)$ give $\beta_{o p t}$.
First derivative:
$\frac{d \cos \theta}{d \beta}=-\sin \beta \sin \delta \sin \varphi-\cos \beta \cos \gamma \sin \delta \cos \varphi-\sin \beta \cos \delta \cos \varphi \cos \omega$
$+\cos \beta \sin \gamma \cos \delta \sin \omega+\cos \beta \cos \gamma \cos \delta \sin \varphi \cos \omega=0$
$\sin \beta(-\sin \delta \sin \varphi-\cos \delta \cos \varphi \cos \omega)=\cos \beta(\cos \gamma \sin \delta \cos \varphi-\sin \gamma \cos \delta \sin \omega-\cos \gamma \cos \delta \sin \varphi \cos \omega)$
$\tan \beta_{o p t}=\frac{(\cos \gamma \sin \delta \cos \varphi-\sin \gamma \cos \delta \sin \omega-\cos \gamma \cos \delta \sin \varphi \cos \omega)}{(-\sin \delta \sin \varphi-\cos \delta \cos \varphi \cos \omega)}$ (19)
Second derivative
$\frac{d^2 \cos \theta}{d \beta^2}=-\cos \beta \sin \delta \sin \varphi+\sin \beta \cos \gamma \sin \delta \cos \varphi-\cos \beta \cos \delta \cos \varphi \cos \omega$
$-\sin \beta \sin \gamma \cos \delta \sin \omega-\sin \beta \cos \gamma \cos \delta \sin \varphi \cos \omega$
$\frac{d^2 \cos \theta}{d \beta^2}=\sin \beta_{o p t}(\cos \gamma \sin \delta \cos \varphi-\sin \gamma \cos \delta \sin \omega-\cos \gamma \cos \delta \sin \varphi \cos \omega)-\cos \beta_{o p t}(\sin \delta \sin \varphi+\cos \delta \cos \varphi \cos \omega)<0$ (20)
Parameters of Eq. (19) include: the declination angle, which is constant per day, the latitude, which is constant per location, the azimuth angle, which is zero toward south, and the hour angle, which changes during the day. Due to the presence of the hour angle, obtaining constant optimum tilt angle during the day is difficult.
During this study, three mathematical models were formulated to calculate the optimum angle of inclination, through which it is possible to obtain the maximum value of the total solar radiation, as follows:
- Model 1, Depending on the noon (ω=0).
- Model 2, Depending on the active solar time (average of the optimum tilt angle from 8:00am to 4:00pm).
- Model 3, Depending on the time from sunrise to sunset (average of the optimum tilt angle from sunrise to sunset).
The tilt angles that give the largest monthly averaged daily total solar radiation incident on the surface are chosen of the three models.
Mathematical equations are analyzed and results obtained with the help of MATLAB R2016b software after the following assumption and condition are applied:
- Neglecting the difference of minutes at sunrise and sunset, meaning that sunrise and sunset was considered to occur at correct hours.
- Calculation of solar radiation at each hour i.e., that time increments equals 3600 sec.
- The ground-reflected solar radiation is considered reflected from concrete ground.
- The azimuth angle is fixed when calculating the tilt angle and vice versa.
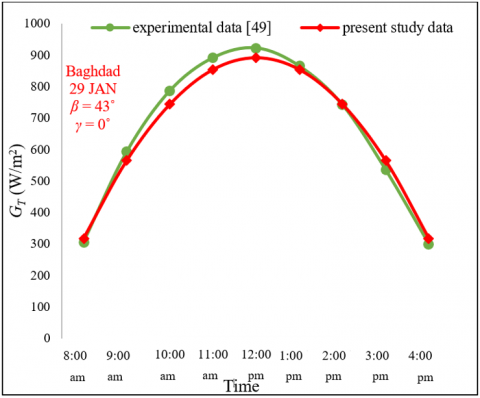
Theoretical results that were computed from the previous equations were validated with the practical ones reported in [49]. The comparison showed a high correlation between the theoretical and experimental data, as shown in Figure 2. It can be observed the solar radiation increases with the passage of sunrise, reaching its peak at noon, and then begins to decrease until sunset.
Figure 2. Validation of solar radiation calculation equations
In this section, the results are presented in three parts. The first part discusses the optimum azimuth angle that is facing south. The second part includes the results of the optimum tilt angle, which was obtained according to the methodology described in section 2.3. In the final part, the results of the proposed methodology are compared with the published literature.
4.1 The optimum azimuth angle
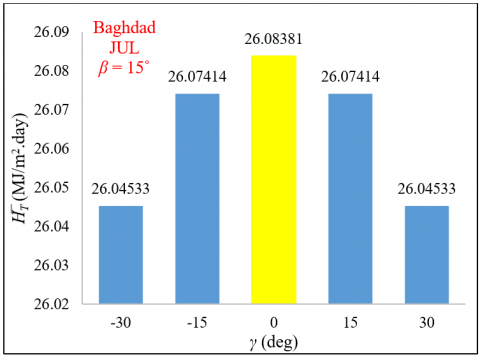
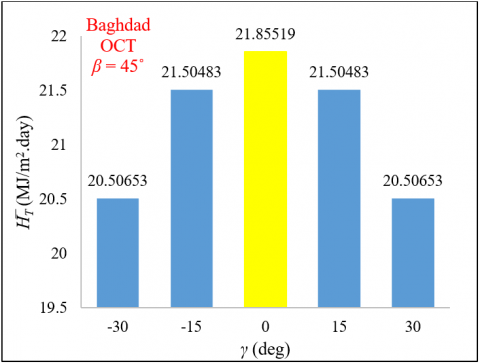
As previously mentioned, the angles that can be controlled are the azimuth and tilt angles, so when determining one of them, the other must be fixed. The test was carried out in January, April, July and October samples, respectively. The tilt angle was fixed (β=45˚) except July (β=15˚) to determine the monthly averaged daily total solar radiation incident on the surface ($\overline{H_T}$) for five azimuth angles (γ): two southeast (-30˚, -15˚) and one south (0˚) and two southwest (15˚, 30˚).
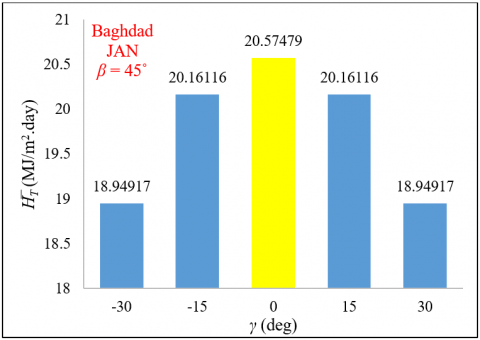
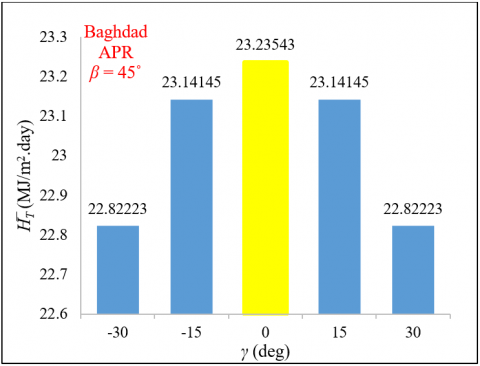
The results showed that the largest monthly averaged daily total solar radiation is obtained when the azimuth angle is 0˚, i.e., facing south, as shown in Figures. 3, 4, 5 and 6, this is consistent with the studies previously reported. The results also showed that the turn away from the south lead to the greater energy loss. The energy losses in January were 413.63 kJ/m2.day and 1625.62 kJ/m2.day when moved away by 15˚ and by 30˚, respectively.
Figure 3. The monthly average daily total solar radiation at different azimuth angles in JAN.
Figure 4. The monthly average daily total solar radiation at different azimuth angles in APR.
Symmetry between the monthly average daily total solar radiation for azimuth angles (-15˚ and 15˚), (-30˚ and 30˚) in Figures 3, 4, 5 and 6 because the azimuth angle represents the guidance angle of the solar collector, is considered zero towards the south, negative towards the southeast, and positive towards the southwest. Ignoring the few minutes' difference between sunrise and sunset hours, the number of daylight hours before noon is equal to the number of daylight hours after noon. Accordingly, for the same degree of guidance, the monthly average daily total solar radiation will be equal, regardless of whether it is southeast or southwest. The difference lies only in the hourly or instantaneous solar radiation, when guidance towards the southeast, the solar energy gain is high in the before noon hours, while when guidance towards the southwest, the solar energy gain is high in the afternoon hours.
For July, as the tilt angle during summer months must be less than the declination angle, the tilt angle was fixed at 15˚ to obtain reliable results.
Figure 5. The monthly average daily total solar radiation at different azimuth angles in JUL.
Figure 6. The monthly average daily total solar radiation at different azimuth angles in OCT.
4.2 The optimum tilt angle
The monthly optimum tilt angle was calculated at three different times. The first one (Model 1) is at noon, the second one (Model 2) was on the active solar time, and the third (Model 3) is the time from sunrise to sunset. After that, the tilt optimum, which gives the largest monthly average daily total solar radiation, is chosen as shown in Table 3.
The results showed (shaded green) that the optimum tilt angle calculated depending on the noon gives the largest $\bar{H}_T$ for both April and September. On the other hand, the optimum tilt angle that is based on the time from sunrise to sunset gives the largest $\bar{H}_T$ in February, March and October. Finally, the optimum tilt angle that is based on the active solar time gives the largest $\bar{H}_T$ for the rest of months.
Based on Table 3, Table 4 is built, which includes:
1. The optimum tilt angle for each month.
2. The optimum tilt angle for winter (averaged of the first the last two months of the year), for spring (averages of the second, third, and fourth month of the year), for summer (averaged the fifth, sixth, and seventh month of the year) and for autumn (average of eighth, ninth, and the tenth month of the year).
3. The optimum tilt angle for the year (averaged of all months).
The yearly optimum tilt angle is approximately the same as the latitude angle and this is consistent with most of the literature.
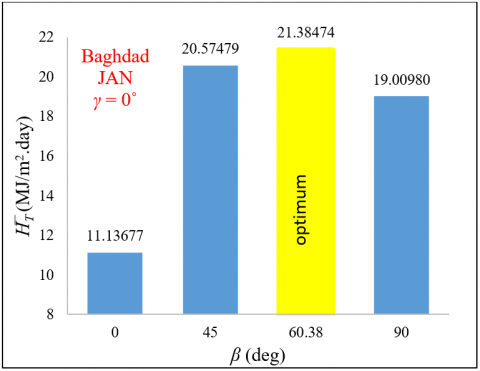
Figure 7 shows the effect of selecting the tilt angle in January (sample), where incorrect tilt angle selection leads to energy losses. It can be seen from the Figure 7 that if the tilt angle is selected 0˚, this will lead to energy losses of up to more 10 MJ/m2.day compared to the case of the angle 60.38˚.
Table 3. Selection the optimum tilt angle for every month
|
Month |
Model 1 $\beta_{o p t}$ Depending on the noon |
Model 2 $\beta_{o p t}$ Depending on the active solar time (8:00am - 4:00pm) |
Model 3 $\beta_{o p t}$ Depending on the time from sunrise to sunset |
|
$\bar{H}_T$ (MJ/m2.day) |
$\bar{H}_T$ (MJ/m2.day) |
$\bar{H}_T$ (MJ/m2.day) |
|
|
JAN |
54.26˚ |
60.38˚ |
65.63˚ |
|
21.23052 |
21.38474 |
21.33800 |
|
|
FEB |
46.30˚ |
50.56˚ |
55.00˚ |
|
22.85995 |
22.99084 |
23.00492 |
|
|
MAR |
35.76˚ |
36.62˚ |
37.71˚ |
|
23.88138 |
23.90259 |
23.92264 |
|
|
APR |
23.93˚ |
20.72˚ |
5.37˚ |
|
24.85785 |
24.85642 |
23.93481 |
|
|
MAY |
14.55˚ |
6.03˚ |
0.00˚ |
|
26.19723 |
26.38028 |
26.11389 |
|
|
JUN |
10.26˚ |
3.77˚ |
0.00˚ |
|
26.91861 |
27.21200 |
27.07228 |
|
|
JUL |
12.16˚ |
6.00˚ |
0.00˚ |
|
26.27406 |
26.50260 |
26.32002 |
|
|
AUG |
19.89˚ |
13.00˚ |
0.56˚ |
|
24.64759 |
24.66300 |
23.93675 |
|
|
SEP |
31.13˚ |
29.79˚ |
16.11˚ |
|
23.07192 |
23.04694 |
22.17468 |
|
|
OCT |
42.94˚ |
46.22˚ |
49.91˚ |
|
21.79035 |
21.88169 |
21.90791 |
|
|
NOV |
52.26˚ |
57.98˚ |
63.12˚ |
|
20.34708 |
20.48494 |
20.44941 |
|
|
DEC |
56.39˚ |
62.88˚ |
62.88˚ |
|
20.27816 |
20.42804 |
20.42804 |
Table 4. The optimum tilt angle in Baghdad
|
Facing South (γ=0˚) |
|||
|
Month |
$\beta_{o p t}$ |
Season |
$\beta_{o p t}$ |
|
JAN |
60.38˚ |
Winter |
60.41˚ |
|
FEB |
55.00˚ |
||
|
MAR |
37.71˚ |
Spring |
38.88˚ |
|
APR |
23.93˚ |
||
|
MAY |
6.03˚ |
Summer |
5.26˚ |
|
JUN |
3.77˚ |
||
|
JUL |
6.00˚ |
Autumn |
31.34˚ |
|
AUG |
13.00˚ |
||
|
SEP |
31.13˚ |
|
|
|
OCT |
49.91˚ |
Yearly |
$\beta_{o p t}$ |
|
NOV |
57.98˚ |
33.97˚ |
|
|
DEC |
62.88˚ |
|
|
Figure 7. The monthly average daily total solar radiation for various tilt angles
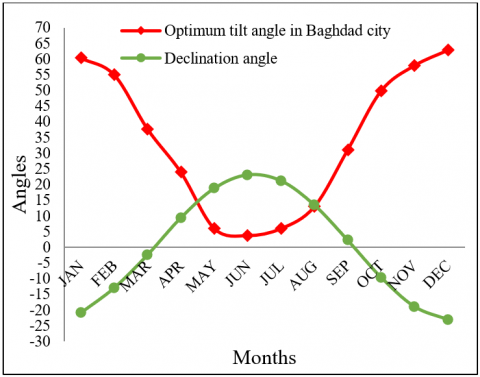
Figure 8. The relationship between the optimum tilt and the declination angles
The largest parameter affecting the optimum tilt angle is the declination angle, as illustrated in Figure 8, where it shows that the relationship between these two angles is almost inversely proportional. The declination angle does not depend on the geographical location, it depends on the number of the day in the year as shown in Eq. (1), and so this relationship is valid for any location or region.
4.3 Comparing results with results of previous studies
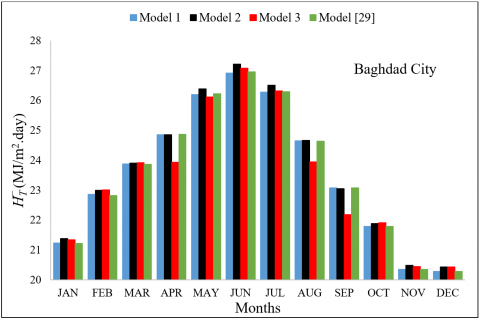
A comparison was made between the results of the proposed models in the current study with the results of previous studies. Figure 9 shows a comparison between the results of monthly average daily total solar radiation of the three models with model in reference [29]. It can be seen that Model 2 is suitable for most months of the year, and Model 1 is close to the Model used in the previous study.
Figure 9. Comparing the three models with the model [29]
Table 5. Energy gain proposed methodology
|
Month |
Proposed methodology |
Previous study [29] |
Comparison |
|||
|
$\beta_{\text {opt }}$ |
$\bar{H}_T$ (MJ/m2.day) |
$\beta_{\text {opt }}$ |
$\bar{H}_T$ (MJ/m2.day) |
Energy gain (kJ/m2.day) |
Energy gain (%) |
|
|
January |
60.38˚ |
21.38474 |
53.90˚ |
21.21448 |
170.26 |
0.80 |
|
February |
55.00˚ |
23.00492 |
45.50˚ |
22.82260 |
182.32 |
0.79 |
|
March |
37.71˚ |
23.92264 |
35.20˚ |
23.86503 |
57.61 |
0.24 |
|
April |
23.93˚ |
24.85785 |
23.20˚ |
24.86339 |
-5.54 |
0.00 |
|
May |
6.03˚ |
26.38028 |
14.00˚ |
26.22375 |
156.53 |
0.59 |
|
June |
3.77˚ |
27.21200 |
9.80˚ |
26.94889 |
263.11 |
0.97 |
|
July |
6.00˚ |
26.50260 |
12.00˚ |
26.28319 |
219.41 |
0.83 |
|
August |
13.00˚ |
24.66300 |
20.20˚ |
24.63985 |
23.15 |
0.09 |
|
September |
31.13˚ |
23.07192 |
31.60˚ |
23.07810 |
-6.18 |
0.00 |
|
October |
49.91˚ |
21.90791 |
43.00˚ |
21.79260 |
115.31 |
0.53 |
|
November |
57.98˚ |
20.48494 |
52.20˚ |
20.34465 |
140.29 |
0.68 |
|
December |
62.88˚ |
20.42804 |
56.50˚ |
20.28272 |
145.32 |
0.71 |
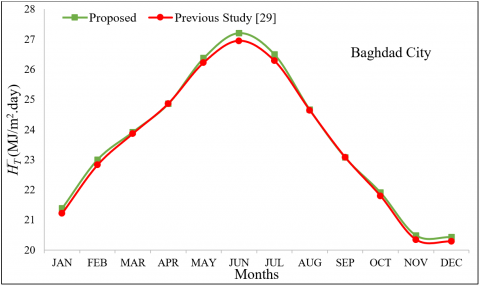
Figure 10. The monthly averaged daily total solar radiation of the proposed and previous study
Figure 10 shows a comparison between results of monthly average daily total solar radiation for the proposed optimum tilt angles and the optimum tilt angles at reference [29], it can see the increase in monthly averaged daily total solar radiation in this study compared to previous study, especially in the summer months.
Table 5 illustrates a detailed comparison between the current study results with the available results in the open literature. The tilt angles in the proposed methodology showed an energy gain in all months except April and September. The reason for this is that the best optimum tilt angle in April and September was chosen based on Model 2 which is similar to Model [29], thus the current method can be considered as the best possible methodology.
The methods of tracking Including the maximum power point tracking (MPPT) technology is somewhat expensive, especially in simple applications of solar energy systems such as panels, collectors, etc. With the possibility of manually correcting the tilt angle monthly and seasonally for many of these applications, dispensing with the tracking device is considered a cheap and acceptable solution to some extent, so it is necessary to know the optimal angles that attract the largest amount of solar energy before installing these applications that do not contain tracking technologies. In this study, the optimum orientation of solar photovoltaic panels, flat plate solar collectors, and other solar applications that depend on orientation in Baghdad city was investigated. It was concluded that the optimum azimuth angle is zero (facing south) that gave the biggest amount of energy. The optimum tilt angle was found monthly, seasonally and yearly, where it was concluded that this optimum angle is affected by several factors. The most prominent factor is the declination angle. In addition, it found that the yearly optimum tilt angle (33.97˚) is close to the latitude. Finally, it was found that incorrect orientation for non-tracking solar applications leads to a large energy loss may up to 10 MJ/m2.day or more.
[1] Shahsavari, A., Akbari, M. (2018). Potential of solar energy in developing countries for reducing energy-related emissions. Renewable and Sustainable Energy Reviews, 90: 275-291. https://doi.org/10.1016/j.rser.2018.03.065
[2] Kosyachenko, L.A. (Ed.). (2015). Solar Cells: New Approaches and Reviews. BoD–Books on Demand.
[3] Al-Ghezi, M.K., Ahmed, R.T., Chaichan, M.T. (2022). The influence of temperature and irradiance on performance of the photovoltaic panel in the middle of Iraq. International Journal of Renewable Energy Development, 11(2): 501. https://doi.org/10.14710/ijred.2022.43713
[4] Kadhim, S.A., Ibrahim, O.A.A.M. (2021). Improving the thermal efficiency of flat plate solar collector using nano-fluids as a working fluids: A review. Iraqi Journal of Industrial Research, 8(3): 49-60. https://doi.org/10.53523/ijoirVol8I3ID86
[5] Priyam, A., Chand, P. (2017). Heat transfer and pressure drop characteristics of wavy fin solar air heater. International Journal of Heat and Technology, 35(4): 1015-1022. https://doi.org/10.18280/ijht.350438
[6] Dawood, N.I., Jalil, J.M., Ahmed, M.K. (2022). Numerical investigation of a window solar air collector with moveable absorber plates. Engineering and Technology Journal, 40(7): 942-950. http://dx.doi.org/10.30684/etj.v40i7.2270
[7] Elsheikh, A.H., Shanmugan, S., Sathyamurthy, R., Thakur, A.K., Issa, M., Panchal, H., Muthuramalingam, T., Sharifpur, M. (2022). Low-cost bilayered structure for improving the performance of solar stills: Performance/cost analysis and water yield prediction using machine learning. Sustainable Energy Technologies and Assessments, 49: 101783. https://doi.org/10.1016/j.seta.2021.101783
[8] Kadhim, S.A., Askar, A.H. (2018). Evaluation performance of a solar box cooker in Baghdad. Journal of University of Babylon for Engineering Sciences, 26(10): 208-216.
[9] Gilago, M.C., Chandramohan, V.P. (2022). Performance evaluation of natural and forced convection indirect type solar dryers during drying ivy gourd: An experimental study. Renewable Energy, 182: 934-945. https://doi.org/10.1016/j.renene.2021.11.038
[10] Duffie, J.A., Beckman, W.A., Blair, N. (2020). Solar Engineering of Thermal Processes, Photovoltaics and Wind. John Wiley & Sons.
[11] Mohammed, M.F., Daud, H.A., Ekaab, N.S. (2021). Numerical study of cooling system for photovoltaic thermal collector. Journal of Engineering Science and Technology, 16(6): 4817-4832.
[12] Al-Ghezi, M.K., Mahmoud, B.K., Alnasser, T., Chaichan, M.T. (2022). A comparative study of regression models and meteorological parameters to estimate the global solar radiation on a horizontal surface for Baghdad City, Iraq. International Journal of Renewable Energy Development, 11(1): 71-81. https://doi.org/10.14710/ijred.2022.38493
[13] Racharla, S., Rajan, K. (2017). Solar tracking system–a review. International Journal of Sustainable Engineering, 10(2): 72-81. https://doi.org/10.1080/19397038.2016.1267816
[14] Gunerhan, H., Hepbasli, A. (2007). Determination of the optimum tilt angle of solar collectors for building applications. Building and Environment, 42(2): 779-783. https://doi.org/10.1016/j.buildenv.2005.09.012
[15] Kern, J., Harris, I. (1975). On the optimum tilt of a solar collector. Solar Energy, 17(2): 97-102. https://doi.org/10.1016/0038-092X(75)90064-X
[16] Stanciu, C., Stanciu, D. (2014). Optimum tilt angle for flat plate collectors all over the World–A declination dependence formula and comparisons of three solar radiation models. Energy Conversion and Management, 81: 133-143. https://doi.org/10.1016/j.enconman.2014.02.016
[17] Hartley, L.E., Martínez-Lozano, J.A., Utrillas, M.P., Tena, F., Pedrós, R. (1999). The optimisation of the angle of inclination of a solar collector to maximise the incident solar radiation. Renewable Energy, 17(3): 291-309. https://doi.org/10.1016/S0960-1481(98)00763-0
[18] Yakup, M.A.B.H.M., Malik, A.Q. (2001). Optimum tilt angle and orientation for solar collector in Brunei Darussalam. Renewable Energy, 24(2): 223-234. https://doi.org/10.1016/S0960-1481(00)00168-3
[19] Lunde, P.J. (1980). Solar Thermal Engineering: Space Heating and Hot Water Systems. John Wiley & Sons, Inc.: New York, NY, USA.
[20] Erbs, D.G., Klein, S.A., Duffie, J.A. (1982). Estimation of the diffuse radiation fraction for hourly, daily and monthly-average global radiation. Solar Energy, 28(4): 293-302. https://doi.org/10.1016/0038-092X(82)90302-4
[21] Garg, H.P. (1982). Treatise on Solar Energy. John Wiley & Sons, Inc.: New York, NY, USA.
[22] Heywood, H. (1971). Operating experiences with solar water heating. IHVE J., 39.
[23] Löf, G.O., Tybout, R.A. (1973). Cost of house heating with solar energy. Solar Energy, 14(3): 253-278. https://doi.org/10.1016/0038-092X(73)90094-7
[24] Kalogirou, S.A. (2004). Solar thermal collectors and applications. Progress in Energy and Combustion Science, 30(3): 231-295. https://doi.org/10.1016/j.pecs.2004.02.001
[25] Ibrahim, D. (1995). Optimum tilt angle for solar collectors used in Cyprus. Renewable Energy, 6(7): 813-819. https://doi.org/10.1016/0960-1481(95)00070-Z
[26] Asl-Soleimani, E., Farhangi, S., Zabihi, M.S. (2001). The effect of tilt angle, air pollution on performance of photovoltaic systems in Tehran. Renewable Energy, 24(3-4): 459-468. https://doi.org/10.1016/S0960-1481(01)00029-5
[27] Lave, M., Kleissl, J. (2011). Optimum fixed orientations and benefits of tracking for capturing solar radiation in the continental United States. Renewable Energy, 36(3): 1145-1152. https://doi.org/10.1016/j.renene.2010.07.032
[28] Eke, A.B. (2011). Prediction of optimum angle of inclination for flat plate solar collector in Zaria, Nigeria. Agricultural Engineering International: CIGR Journal, 13(4): 1-7.
[29] Sultan, F., Ali, F.A., Razaq, T.K.A. (2012). Tilt angle optimization of solar collectors for maximum radiation in three Iraqi cities. International Journal of Engineering and Industries (IJEI), 3(4): 99-107. https://doi.org/10.4156/IJEI.vol3.issue4.11
[30] Jafarkazemi, F., Saadabadi, S.A. (2013). Optimum tilt angle and orientation of solar surfaces in Abu Dhabi, UAE. Renewable Energy, 56: 44-49.
https://doi.org/10.1016/j.renene.2012.10.036
[31] Khadim, I.J., Mahdi, E.J., Ubaid, A.H. (2014). Determining tilt angle for fixed solar panel tosites of Iraq’s provinces by using the programs on NASA and google earth websites. Engineering and Technology Journal, 32(3): 498-506.
[32] Khasawneh, Q.A., Damra, Q.A., Bany Salman, O.H. (2015). Determining the optimum tilt angle for solar applications in Northern Jordan. Jordan Journal of Mechanical & Industrial Engineering, 9(3).
[33] Abood, A.A. (2015). A comprehensive solar angles simulation and calculation using matlab. International Journal of Energy and Environment, 6(4): 367-367.
[34] Zang, H., Guo, M., Wei, Z., Sun, G. (2016). Determination of the optimal tilt angle of solar collectors for different climates of China. Sustainability, 8(7): 654. https://doi.org/10.3390/su8070654
[35] Berisha, X., Zeqiri, A., Meha, D. (2018). Determining the optimum tilt angles to maximize the incident solar radiation-case of study Pristina. International Journal of Renewable Energy Development, 7(2): 123-130. https://doi.org/10.14710/ijred.7.2.123-130
[36] Uzair, M., Rehman, N., Siddiqui, M., Kazmi, S.U.H. (2022). Improved Methodology for Determining Seasonal and Fixed Optimum Tilt Angles for Solar Collectors. GMSARN Int. J., 16: 325-330.
[37] Saleh, A.A.M., Jasim, M.A. (2014). Experimental study of the performance of the dual purpose solar collector. Engineering and Technology Journal, 32(11): 2673-2683.
[38] Kurniawan, A., Shintaku, E. (2020). Determining the optimal inclination and orientation angles of solar panels installed on ship. International Journal of Renewable Energy Research (IJRER), 10(1): 45-53.
[39] ASHRAE, A.H. (2017). Fundamentals, SI ed. Am. Soc. Heating, Refrig. Air-Conditioning Eng. Atlanta, GA.
[40] Jasim, M.A. (2013). Utilization of air-water solar collector system for space heating. M.S. thesis, Mechanical Engineering Department, University of Technology, Baghdad, Iraq.
[41] Al-Joboory, A.N. (2012). Analytical appraisal and experimental verification of the ASHRAE cooling load calculations methods for a hot arid climate. Ph. D. thesis, Mechanical Engineering Department, Baghdad University, Baghdad, Iraq.
[42] Stephenson, D.G. (1965). Equations for solar heat gain through windows. Solar Energy, 9(2): 81-86. https://doi.org/10.1016/0038-092X(65)90207-0
[43] Wong, L.T., Chow, W.K. (2001). Solar radiation model. Applied Energy, 69(3): 191-224. https://doi.org/10.1016/S0306-2619(01)00012-5
[44] Thevenard, D., Haddad, K. (2006). Ground reflectivity in the context of building energy simulation. Energy and buildings, 38(8): 972-980. https://doi.org/10.1016/j.enbuild.2005.11.007
[45] Mohammed, M.F. (2015). Study to enhance thermal performance of the risers in flat plate solar water collectors. Ph. D. thesis, Mechanical Engineering Department, Baghdad University, Baghdad, Iraq.
[46] Sahab, S.A., Mosli, A.H. (2011). Optimum orientation of solar panels in Baghdad city. Journal of Basrah Researches (Sciences), 37(3).
[47] Norozi, M. (2017). Experimental investigation of improving received radiation by an hourly sun tracking on a weir-type cascade solar still. International Journal of Heat and Technology, 35(4): 737-746. https://doi.org/10.18280/ijht.350407
[48] Mohammed, M.F., Eleiwi, M.A., Kamil, K.T. (2021). Experimental investigation of thermal performance of improvement a solar air heater with metallic fiber. Energy Sources, Part A: Recovery, Utilization, and Environmental Effects, 43(18): 2319-2338. https://doi.org/10.1080/15567036.2020.1833110
[49] Abdul-Ghafou, Q.J., Mohammed, A.A., Kadhim, S.A. (2016). Evaluation of the effect of dusty weather on the performance of flat plate solar collector. Advances in Natural and Applied Sciences, 10(13): 125-131.