Abdulkhodor Kathum Nassir* | Haroun A.K. Shahad
© 2022 IIETA. This article is published by IIETA and is licensed under the CC BY 4.0 license (http://creativecommons.org/licenses/by/4.0/).
OPEN ACCESS
The main challenge of using Kalina cycle system (KCS) is to make use of waste heat to produce electrical power or cooling effect. Thus reducing fossil fuel consumption and pollutants emission. This study is concerned with a theoretical performance analysis of different configures of Kalina cycle. Three configurations are studied which are a simple Kalina cycle and two modifications of the simple cycle (MKCS1) and (MKCS2). A binary fluid of ammonia and water (NH3-H2O) is used as the working fluid. The varying operating parameters include ammonia mass fraction at turbine inlet and maximum cycle pressure. The dryness fraction at separator inlet is assumed constant and equal 0.3 and the minimum cycle is also assumed constant at 3bar. The results show that the maximum thermal efficiency for KCS, MKCS1 and MKCS2 are 8.64%, 12.7% and 18.85% respectively at the same conditions maximum pressure (Pmax)=35bar, minimum pressure (Pmin)=3bar, dryness fraction (DF)=0.3, ammonia mass fraction (x)=0.85 and the temperature at turbine inlet is 160℃. The maximum exergy efficiency for KCS, MKCS1 and MKCS2 are 34.21%, 51.92% and 75.34% respectively at the conditions Pmax=40bar, x=0.85, DF=0.3 and Pmin=3bar. The maximum net output power for KCS is 0.21kW at Pmax=15bar and x=0.85, the maximum net output power for MKCS1 and MKCS2 0.28kW and 0.41kW respectively at Pmax=30bar and x=0.89. This is equivalent to a reduction in the diesel fuel consumption by about 9.1*10-5 kgf/kWelec. Also it reduction the pollution especially CO2 about 2.91*10-4 kgCO2/kWelec.
waste heat, modified Kalina cycle system, aqua-ammonia, exhaust heat recovery
The demand of energy is increasing worldwide which requires large fossil fuel consumption. This means more pollutants emission. Therefore, the need for new clean and sustainable energy resources become urgent. These resources includes, solar energy, wind energy, bioenergy, waste heat, geothermal … etc. However, these resources are of low grade type since it is available at low temperatures. Therefore, new technologies are needed to make use of these resources. One of these technologies is Kalina cycle system. Hossain et al. [1] improved Kalina Cycle System-12 (KCS-12) by adding a multi-phase expander in two positions. The first position of the multi-phase expander is after the separator and this cycle is named KC-12A. The second position of the multi-phase expander is before the separator and this named KCS-12B. The results show that the net power and efficiency of KC-12Aas compared with KCS-12 increased by 3.23% and 3.68% respectively, while it was 3.94% and 4.04% respectively for KC-12B. It was found the maximum power output for KC-12B is obtained at 15.217MPa and 0.8 ammonia mass fraction. Kaczmarczyk et al. [2] studied and compared between Kalina cycle and Organic used geothermal resources. The flow rate of geothermal water is assumed from 120 m3/h to 550 m3/h and the temperature of water is not exceed 86℃. The results showed that the gross power obtain from Kalina cycle is larger than power obtained from ORC about 40%, but both of them have same thermal efficiency around 6.49%. Cruz and Manuel [3] studied the improvement of Kalina Technology and potential of using for the global electricity productions. When the maximum temperature is (116°C) for the heat source, the working fluid leaves the HRVG at wet vapor. (KCS 1-2) consists of eight heat exchangers, two pumps, separator, expansion valve and turbine. It used the waste heat (exhaust gases) in the factory of cement. ORC and KCS cogeneration cycle is operated on exhaust gases and cinder cooler exhaust gasses in cement factory. Kaczmarczyk et al. [4] studied and analyzed two cycles (Organic Rankine and Kalina Technology) to produce electricity from geothermal resources. The temperature of the water of geothermal is 82℃ and a peak flow rate of 51.22kg/s. The results show that, when ORC was used the total power and total energy are about 0.24 MW and 940 MWh respectively. When KCS was used the total power and total energy increase to 0.43MW and 1730 MWh respectively. Özahi and Toziu [5] studied and analyzed KCS which is operated by waste heat from power plant in Turkey. It used to recover the heat from the power plant to generate 0.9546MW with thermal efficiency of 24.15%. Meng et al. [6] studied and investigated organic Rankine cycle ORC. It is found that the ORC operates with low temperature and heat sources, as low as 80℃. The steam is a working fluid with normal RC, it needs high temperature of the heat sources above 360℃. Li and Dai [7] studied the use of working fluid pair which consists of 86% NH3 and 14% H2O and obtained better performance (thermal efficiency and output power) plants as compare as to normal RC. Dhahad et al. [8] presented a new cycle which consists of Kalina Cycle and the absorption refrigeration cycle. The system works with low-temperature and the source of the heat was waste heat source. The results showed that the system is suitable for cooling rather than for electricity generation. The cycle efficiency and the second law efficiency and the output power of new cycle got were 41.33%, 27.47%, and 158.3 kW respectively. The total unit cost of the produced cooling, power, and total system are respectively evaluated 148.5 \$/GJ, 97.16 \$/GJ, and 19.44 \$/GJ. Cao et al. [9] used a new layout for cogeneration of power and distilled water using thermal heat stored at the lower convective zone. The proposed system consists of a Kalina cycle (KC), a humidification-dehumidification unit, and two thermo- electric generators. It was seen the improvement in second law efficiency, energy utilization factor (EUF) and total unit cost of product were 5.5%, 14.09% and 27.93%, respectively. The optimum values of EUF, second law efficiency, and total unit cost of the product were 0.756, 27.7%, and 30.54 \$/GJ, respectively. Ashouri et al. [10] examined the effect of solar collectors in the Kalina cycle in comparison with Kalina technology was driven by fuel. The results showed that the cost of electricity of Kalina cycle was driven by solar and Kalina was driven by fuel were 0.4274 \$/kWh and 0.3113 \$/kWh. Also the saving of fuel around 40 ton/year and the reduction in the emission in CO2 around 100 ton/year. Ghaebi et al. [11] presented a novel combined power and ejector refrigeration cycle. The optimum case based on generator pressure, evaporator temperature, condenser pinch point temperature, heat source temperature, ammonia mass fraction, and expansion ratio were17.5 bar, 285 K, 8 K, 473 K, 15%, and 2.5, respectively. In this case, the optimum thermal and exergy efficiencies, total unit cost of the product (TUCP) were 20.4%, 16.69%, and 2466.36 \$/MWh respectively. Many researchers found that the KC technology used in power generation and consists of many components such as turbine, heat exchangers, pump, expansion valve, etc. Most of the studies displayed that KC technology can achieve a better performance than performance of ORC [12-15]. Hua et al. [16] studied the performance of a Kalina technology with high-temperature and the source of heat is waste heat recovery. It was found that the thermal efficiency of this cycle was 12.8% greater than the thermal efficiency of simple Kalina cycle. Arrieta and Arrieta [17] studied and improved the generation of electricity with Kalina cycle can reach around 2.725 MW, with energy efficiency of 21.8% and exergy efficiency of 55.2% and the cost of the generation was 278.03 \$/MWh. Ishida and Kawammura [18] studied and analyzed thermodynamically and economically on the Kalina cycle system 1-2 (kcs1-2). It consists of six heat exchanger, two pumps, separator, expansion valve and turbine. The result was a reduction in the cost of electricity and the cost of the generation was 240.00 \$/MWh. Abam et al. [19] used a modified Kalina power-cooling cycle (KCPC) as a topping cycle while the vapor absorption cycle as a bottoming cycle. This system was called modified Kalina power-cooling vapor absorption cycle (KLPCC). The energy efficiency and COP were increased from 13.82% to 16.39% and 0.59 to 0.75 respectively. The most suitable for the KCS is a mixture of aqua ammonia (NH3-H2O). Ammonia-water (NH3-H2O) mixture have properties different from the properties of just water or just ammonia Khankari et al. [20]. Pure ammonia and pure water, both of them have constant and steady temperatures of condensing and boiling, but the mixture of aqua ammonia has varying temperature to condense and boil. The thermo physical properties for just water or just ammonia are constant, but the thermo physical properties of the mixture of ammonia-water are varying by changing the ammonia concentration Ogriseck [21]. Nassir and Shahad [22] explained theoretically the thermal analysis of modified Kalina cycle with ammonia water working fluid. They used different ranges of the working pressure and ammonia mass fraction. The results showed that modified Kalina cycle is higher than simple cycle by 33% thermal efficiency.
This paper studied the performance of three configurations of Kalina technology under different operating conditions such as maximum pressure (Pmax) and ammonia mass fraction (x). The comparison shall reveal the optimum conditions based on the maximum power output, thermal efficiency and exergy efficiency. The analysis shall include the equivalent fuel consumption and carbon dioxide emission.
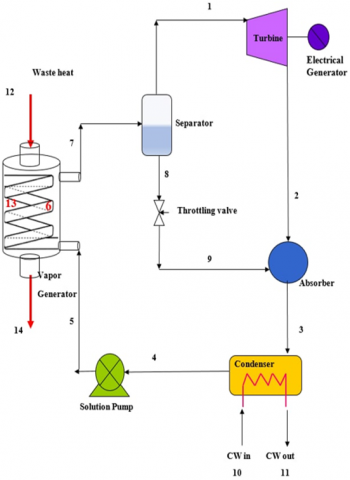
Two modifications of the simple Kalina cycle shown in Figure 1 is carried. The first modification is to add a heat exchanger (HE1) between the separator and the expansion valve to recover part of heat of the weak solution for heating of the working fluid coming from the pump as shown in Figure 2. This will reduce the required heat in the HRVG. The second modification is added to another heat exchanger (HE2) after the turbine before the condenser to recover part of heat of the strong solution to be used to heat the working fluid coming from the pump. The heat exchanger HE2 is located upstream of the HE1 as shown in Figure 3. This modification produces extra reduction in the required heat in the HRVG. This modification also reduces the required cooling utility in the absorber and condenser.
Figure 1. Simple kalina cycle system (KSC) [1]
Figure 2. Modified Kalina cycle system (MKCS1)
Figure 3. The modified of (MKCS2)
The working fluid exit temperature, $T_{\acute{\acute{5}}}$, plays an important role on heat recovery in HE1. The bubble point temperature (BPT) (T6) is the maximum possible liquid solution temperature in the HRVG. The temperature of the working fluid at exit of heat exchanger is calculated from Eq. (1) [23]. The thermodynamic analysis of these cycles is based on the following assumption [23]:
1-Steady state operation throughout the cycle.
2-Working fluid at condenser outlet is saturated liquid at condenser pressure.
3-Working fluid at the inlet of turbine is saturated vapor at turbine pressure.
4-The pressures of the boiler and condenser are constant.
5-Throttling process is isenthalpic.
6-The vapor leaves the separation is dry saturated at separator pressure.
7-The isentropic efficiencies of pump and turbine are 98%, 85% respectively.
8-Pressue losses, heat losses and friction losses in pipes are neglected.
9-The effectiveness in HRVG and condenser is unity (ϵ=1).
10-All cycle components are adiabatic.
11-The absorption process in the mixer is considered as adiabatic. The kinetic and potential energies changes in all components are neglected.
12-The used water and ammonia are pure substances.
13- The inlet temperature of the hot gases is 175℃. The temperature at the entrance of the turbine equals the saturation temperature at turbine pressure.
14- The state of liquid leaving the separator is saturated liquid.
15- The pinch point (PP) in the HRVG is 20℃. The terminal temperature difference (TTD) at evaporator part of the heat recovery vapor generator (HRVG) inlet with hot gases is taken at 15℃. Approach point (AP) in the boiler is 2℃.
The governing equations to be solved are the continuity equation, the first law of thermodynamic (energy equation) and the exergy balance for each component of the modified Kalina cycle system (MKCS2).
$T_{\grave{\grave{5}}}=\mathrm{T}_{\grave{5}}+\left(1-\mathrm{DF}_{\mathrm{sep}}\right)\left(\mathrm{T}_6-\mathrm{T}_{\grave{5}}\right)$ (1)
$\mathrm{T}_{\acute{5}}=\mathrm{T}_5+\mathrm{DF}_{\mathrm{sep}}\left(\mathrm{T}_6-\mathrm{T}_5\right)$ (2)
$x_7=x_8+\mathrm{DF}_{\mathrm{sep}}\left(x_1-x_8\right)$ (3)
$\mathrm{T}_1=\mathrm{T}_{12}-\mathrm{TTD}$ (4)
$\mathrm{T}_6=\mathrm{T}_{\mathrm{bp}}-\mathrm{AP}$ (5)
$\mathrm{T}_{13}=\mathrm{T}_{\mathrm{bp}}+\mathrm{PP}$ (6)
where,
DFsep is the dryness fraction at separator inlet,
x is the ammonia mass fraction (kgNH3/kgmix),
Tbp is the bubble point temperature of working fluid at HRVG pressure,
T1 is the temperature at turbine inlet,
T12 is the temperature of hot gases at inlet of HRVG,
T14 is the hot gases temperature at HRVG exit.
$\sum \dot{m}_i=\sum \dot{m}_{\mathrm{o}}$ (7)
$\sum \dot{m}_i x_i=\sum \dot{m}_o x_o$ (8)
$\sum \dot{Q}+\sum \dot{m}_i h_i=\sum \dot{W}+\sum \dot{m}_o h_o$ (9)
$\dot{\mathrm{E}}_{\mathrm{dtot}}=\sum \dot{E}_{\text {in }}-\sum \dot{E}_{\text {out }}$ (10)
The exergy analysis is performed for each component under same general assumptions. The rate of exergy of fluid stream is written as: [24].
The total exergy destruction through the cycle is:
$\left(\dot{E}_d\right)_{t o t}=\sum\left(\dot{E}_d\right)_i$ (11)
$\eta_{\mathrm{ex}}=\frac{\dot{\mathrm{W}}_{\text {net }}}{\left(\dot{\mathrm{E}}_{\mathrm{in}}-\dot{E}_{\text {out }}\right)_{H . G}}$ (12)
$\dot{E}=\dot{m}\left(h-T_0 s\right)$ (13)
$\eta_{t h}=\frac{\dot{W}_{\text {net }}}{\dot{Q}_{\text {in }}}=\frac{\dot{W}_T-\dot{W}_P}{\dot{Q}_{\text {in }}}$ (14)
where,
$\dot{W}_{n e t}$ is the net power.
$\dot{W}_{T}$ is rate of work produced by turbine.
$\dot{W}_{P}$ is rate of work consumed by pump.
$\dot{E}_{i n}$ is the input exergy of the hot fluid (exhaust).
$\dot{E}_{\text {out }}$ is the output exergy of the hot fluid (exhaust).
$\left(\dot{E}_d\right)_{t o t}$ is total destroyed exergy at the system components.
Ƞex is the exergy efficiency (%).
H.G is the hot gases.
The governing equations are applied for each component. The absorption process in the mixer is considered as adiabatic.
The current study model was validated with Srinivas et al. [23]. The conditions are the temperature of the hot gases, the inlet temperature of the turbine, inlet mass fraction of the turbine and the dryness fraction of the inlet separator 175℃, 160℃, 0.85 and 0.1569 respectively. Also the high pressure and low pressure are 37.67 bar and 2.58 bar respectively. All the results of the present work and the researcher work are tabled as shown in the Table 1.
Table 1. validation results with Srinivas et al. [23]
|
Case |
Srinivas et al. |
Present work |
Deviation (%) |
|
Qin (kW) |
1366.358 |
1360.698 |
0.414239 |
|
Qrej (kW) |
1254.551 |
1248.433 |
0.48761 |
|
WT (kW) |
86.6457 |
82.45098 |
4.841231 |
|
Cycle/Eff % ȠTH |
6.341361 |
6.059462 |
4.445399 |
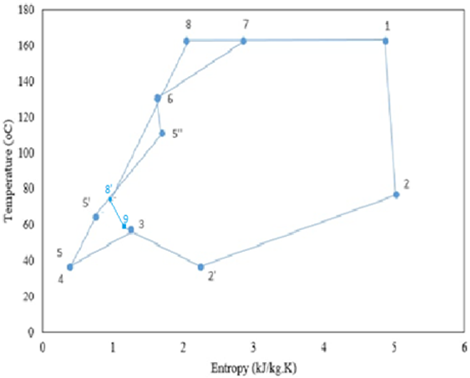
In a common RC power plant, the working fluid is water. In ORC the working fluid has low molecular weight and low boiling temp. The working fluid is heated in a vapor generator and is converted into high pressure, temp. The vapor will expand through a turbine to produce electricity. KCS used binary mixture to improve thermodynamic efficiency and deliver good flexibility in numerous operating situations. The relative gain of the RC (works in low temp) is less than the relative gain of KCS. The energy efficiency of RC is less than the thermal efficiency of Kalina cycle because mean temp of heat rejection of RC is more than KCS, and mean temp of heat addition of RC is less than KCS. Aqua-ammonia binary solution is used in this work for the three cycles, with ammonia concentration (x) of 0.85, 0.86, 0.87, 0.88 and 0.89. The temperature of the hot gases at inlet HRVG is kept constant at 175℃. The effect of changing the cycle high pressure with constant low pressure on performance is studied. The high pressure is varied from 10 to 40 bar with step 5bar. The low pressure is 3 bar. The dryness fraction (DF) at separator inlet is assumed constant and equal 0.3. The following cycle parameters are investigated namely cycle efficiency, net output power and exergy efficiency. Also the values of minimum cycle pressure and ammonia concentrations that gives optimum cycle performance are obtained. Figures 4-6 show the three cycles on the T-s diagram at the same conditions Pmax=40bar, x=0.85, DF=0.3 and Pmin=3bar. It is seen in KCS the heat addition just in one stage is 57 in HRVG only, that means high losses and low thermal efficiency about 1.534kW and 8.48% respectively as shown in Figure 4. Figure 5 shows the MKCS1 on the T-s diagram it is seen the heat is added on two stages are $5\grave{5}$ and $\grave{5}7$, that lead to reduce the heat rejected to 1.43kW and increases the thermal efficiency to 12.88%. Figure 5 shows the MKCS2 on T-s diagram it is clear the heat is added with three sages are $5\grave{5}$, $\grave{5}\grave{\grave{5}}$ and $\grave{\grave{5}}7$, that lead to reduce the heat rejected to 1.278kW and increases the thermal efficiency to 18.69%. The difference between of the KCS and MKCS1is the MKCS1 has two processes. The first process (88’) removes heat from the weak solution before inter the expansion valve. The second process (55’) gains heat to the working fluid before enter the heat recovery vapor generator. Also the different between the MKCS1 and MKCS2 is the MKCS2 has two processes (22’ and 55’). The process 22’ rejects heat from the strong solution before enter the absorber and the process 55’ gains heat to working fluid before enter the first heat exchanger as shown in Figures 4-6.
Figure 4. Simple Kalina cycle system (KSC) on T-s diagram
Figure 5. First modified of Kalina cycle system (MKSC1) on T-s diagram
Figure 6. Second modified of Kalina Cycle System (MKSC2) on T-s diagram
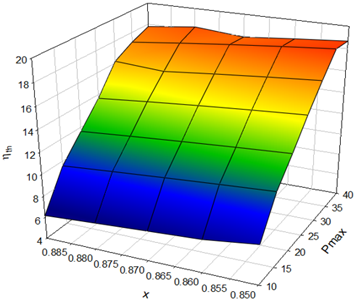
Figure 7. Thermal efficiency for KCS
Figure 8. Thermal efficiency for MKCS1
Figure 9. Thermal efficiency for MKCS2
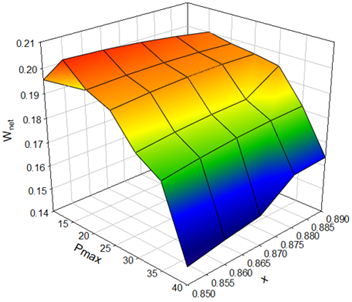
Figure 10. Net output power for KCS
Figure 11. Net output power for MKCS1
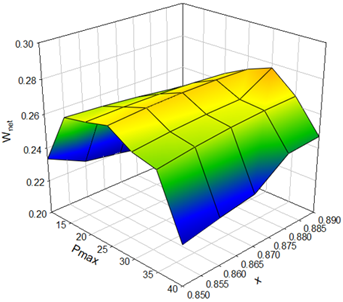
Figure 12. Net output power for MKCS2
5.1 Thermal efficiency
Figures 7-9 show the thermal efficiencies for three cycles. It is shown that the introduced modification improves the thermal efficiency. The highest thermal efficiency for the three cycles KCS, MKCS1 and MKCS2 are 8.64%, 12.67% and 18.84% respectively at the same conditions of Pmax=35bar, DF=0.3 and x=0.85. The enhancement of thermal efficiency between KCS and MKCS1 is 46.6%, while the enhancement of the thermal efficiency between the KCS and MKCS2 is 118.1%. The thermal efficiency of modified cycles is higher than the of the simple Kalina because the addition of heat exchanger between the separator and the expansion valve and another heat exchanger between the turbine and absorber helps to reduce the required heat-input in the HRVG and increases produced net power. This lead to improve the efficiency.
5.2 The net output power
Figures 10-12 show the net output power for the three cycles. It is clear that the introduced modification improves the power output. The highest value of the net power for KCS is 0.21 kW at Pmax=15bar and x=0.85, MKCS1 is 0.27kw at Pmax=25bar and x=0.85, MKCS2 is 0.41kW at Pmax=30bar and x=0.89. The enhancement of net output power between KCS and MKCS1 is 28.6%, while the enhancement of the net output power between the KCS and MKCS2 is 95.2%. This is due to add heat exchanger in the first modification and two heat exchanger in the second modification. It is seen that the MKCS1 and MKCS2 produce more net output power than the KCS for all mass fraction. This is due to the increase in the total mass flow rate of mixture in the MKCS1 and MKCS2 compared to KCS which means more vapor at turbine inlet.
Figure 13. Exergy efficiency for KCS
Figure 14. Exergy efficiency for MKCS1
Figure 15. Exergy efficiency for MKCS2
5.3 The exergy efficiency
Figures 13-15 show the exergy efficiencies of three cycles. It is noticed that the modification produced improvement in the exergy efficiency. The highest value of the exergy efficiencies for KCS, MKCS1 and MKCS2 are 34.21%, 51.9% and 75.4% respectively at Pmax=40bar and x=0.85. The enhancement of exergy efficiency between KCS and MKCS1 is 120.5%. The improvement in exergy efficiency of the modified cycles is due to the addition of heat exchangers help to reduce the heat rejected during the cycle. These Figures show that the efficiency drops as the ammonia mass fraction increases for all Pmax. This is attributed to more heat expenditure in the HRVG. In the addition to that the exergy efficiency increases as Pmax increases due to more produced net output power.
Kalina technology is a good solution to produce electricity from low temperature heat sources. The use of KCS helps to reduce the required fuel consumption and the emission of greenhouse gases (GHG) [25, 26]. The calculation of equivalent fuel saving and equivalent CO2 emission reduction is based on MKCS2 cycle, which gave maximum power production. This calculation is based on the following assumptions:
Assume the fuel is diesel fuel with a chemical formula of (C16H34), with lower calorific value of 44000 kJ/kg.
The thermal efficiency for conversion from thermal energy to electricity energy is 25%.
The fuel air mixture is stoichiometric.
For MKCS2 the net output power is 0.41kW at Pmax=40bar and x=0.89.
$\left(\eta_{\text {conv }}\right)_{t h}=\frac{\dot{W_{\text{net }}}}{\dot{Q_{i n}}}$ (15)
$\dot{Q}_{i n}=\dot{m}_f * L C V$ (16)
$\dot{m}_f=\frac{\dot{W}_{n e t}}{\left(\eta_{\text {conv }}\right)_{t h * L C V}}$ (17)
C16H34+24.5(O2+3.76N2) → 16 CO2+ 17 H2O+ 92.12 N2
The fuel saving per unit electricity power $\frac{\dot{m}_f}{(k W)_{\text {elec }}}$ is calculated as follows. From Eq. (15) the $\dot{Q}_{i n}=1.64 \mathrm{~kW}$. This value represented the total required thermal energy. From Eq. (17), $\dot{m}_f=3.73 * 10^{-5} \mathrm{~kg} / \mathrm{s}$ and then find the fuel saving per unit electricity $\frac{\dot{m}_f}{(k W)_{\text {elec }}}$ is $9.1^* 10^{-5}$.
The reduction of CO2 emission per unit electrical power $\frac{\dot{m}_f}{(k W)_{\text {elec }}}$. It is obtained as follows.
Form the above stoichiometric reaction equation it is found that each 1kg of fuel produces 3.115 kg CO2. Therefore, the fuel consumption rate of 3.73*10-3 kg/s produces 0.0116 kg/s CO2. The carbon dioxide produced per unit electrical power generated is 0.029 $\frac{\mathrm{kg} / \mathrm{s}}{\mathrm{kW}_{\text {elec }}}$.
The following conclusions are summarized from the results of this work.
1- The addition of heat exchangers to the simple Kalina improves its performance.
2- The efficiency of $\eta_{M K C S 2}>\eta_{M K C S 1}>\eta_{K C S}$ under same operating conditions.
3- The cycle net output power of MKCS2 is higher than that of SKCS1 and KCS for same operating conditions Pmax=30bar and x=0.89.
4- The exergy efficiency of MKCS2 is higher than of it in MKCS1 and KCS for same operating conditions Pmax=40bar and x=0.85.
5- The use of Kalina cycle system saves fuel and reduces CO2 emission.
|
hi |
Input specific enthalpy (kJ/kg) |
|
ho |
Output specific enthalpy (kJ/kg) |
|
T |
Temperature (°K) |
|
x |
Ammonia mass fraction (kg ammonia/kg mixture) |
|
$\dot{W}_{\text {net }}$ |
The net power(kW) |
|
$\dot{E}_{\text {in }}$ |
Exergy delivered by the source flow (kW) |
|
dtot |
Total exergy destroyed (kW) |
|
E |
Exergy destruction (kJ) |
|
To |
Surrounding temperature (°K) |
|
$\dot{m}_i$ |
Input mass flow rate (kg/s) |
|
$\dot{m}_o$ |
Output mass flow rate (kg/s) |
|
LCV |
Lower calorific value (kJ/kg) |
|
s |
specific entropy (kJ/kg K) |
|
Greek symbol |
|
|
$\eta_{\text {tisent }}$ |
The isentropic efficiency of turbine (%) |
|
$\eta_{\text {pisent }}$ |
The isentropic efficiency of pump (%) |
|
$\eta_{t h}$ |
Thermal efficiency (%) |
|
$\eta_{e x}$ |
Exergy efficiency (%) |
|
$\epsilon$ |
The effectiveness |
|
$\eta_{\text {conv }}$ |
The thermal efficiency for conversion (%) |
|
Subscripts |
|
|
sep |
separator |
|
abs |
absorber |
|
diab |
diabetic process |
|
thr |
throttling valve |
|
con |
condenser |
|
gen |
generator |
|
tur |
turbine |
|
pup |
pump |
|
hx |
Heat exchanger |
|
mix |
mixer |
|
isen |
isentropic |
|
bp |
Bubble point |
|
sw |
Saturation water |
|
sa |
Saturation ammonia |
|
dp |
Dew point |
|
bp |
Bubble point |
|
rej |
Rejected |
|
HG |
Hot gases |
|
th |
thermal |
|
conv |
conversion |
|
f |
fuel |
|
elec |
electricity |
|
Abbreviations |
|
|
SKCS |
Simple Kalina cycle system |
|
MKCS1 |
First modified Kalina Cycle System |
|
MKCS2 |
Second modified Kalina Cycle System |
|
DF |
Dryness fraction (kg vapor of NH3/kg total mass of vapor) |
|
mix |
Mixture |
|
TTD |
Terminal temperature difference |
|
AP |
Approach point |
|
PP |
Pinch point |
|
HRVG |
Heat recovery vapor generator |
|
ORC |
Organic Rankine Cycle |
|
RC |
Rankine Cycle |
|
KCS |
Kalina cycle system |
|
NH3-H2O |
Ammonia-water |
|
RKC |
Rankine-Kalina Combined cycle |
|
LCV |
Lower calorific value (kJ/kg) |
[1] Hossain, M.M., Hossain, M.S., Ahmed, N.A., Ehsan, M.M. (2021). Numerical Investigation of a modified Kalina cycle system for high-temperature application and genetic algorithm based optimization of the multi-phase expander's inlet condition. Energy and AI, 6: 100117. https://doi.org/10.1016/j.egyai.2021.100117
[2] Kaczmarczyk, M., Tomaszewska, B., Pająk, L. (2020). Geological and thermodynamic analysis of low enthalpy geothermal resources to electricity generation using ORC and Kalina cycle technology. Energies, 13(6): 1335. https://doi.org/10.3390/en13061335
[3] Cruz, G.E.E.D., Manuel, M.C.E. (2022). A Literature Review of the Kalina Cycle and Trends. In IOP Conference Series: Earth and Environmental Science, 1046(1): 012011. https://doi.org/10.1088/1755-1315/1046/1/012011
[4] Kaczmarczyk, M., Tomaszewska, B., Operacz, A. (2020). Sustainable utilization of low enthalpy geothermal resources to electricity generation through a cascade system. Energies, 13(10): 2495. https://doi:10.3390/en13102495
[5] Özahi, E., Tozlu, A. (2020). Optimization of an adapted Kalina cycle to an actual municipal solid waste power plant by using NSGA-II method. Renewable Energy, 149: 1146-1156. https://doi.org/10.1016/j.renene.2019.10.102
[6] Meng, F., Wang, E., Zhang, B., Zhang, F., Zhao, C. (2019). Thermo-economic analysis of transcritical CO2 power cycle and comparison with Kalina cycle and ORC for a low-temperature heat source. Energy Conversion and Management, 195: 1295-1308. https://doi.org/10.1016/j.enconman.2019.05.091
[7] Li, S., Dai, Y. (2014). Thermo-economic comparison of Kalina and CO2 transcritical power cycle for low temperature geothermal sources in China. Applied Thermal Engineering, 70(1): 139-152. https://doi.org/10.1016/j.applthermaleng.2014.04.067
[8] Dhahad, H.A., Hussen, H.M., Nguyen, P.T., Ghaebi, H., Ashraf, M.A. (2020). Thermodynamic and thermoeconomic analysis of innovative integration of Kalina and absorption refrigeration cycles for simultaneously cooling and power generation. Energy Conversion and Management, 203: 112241. https://doi.org/10.1016/j.enconman.2019.112241
[9] Cao, Y., Dhahad, H.A., Parikhani, T., Anqi, A.E., Mohamed, A.M. (2021). Thermo-economic evaluation of a combined Kalina cycle and humidification-dehumidification (HDH) desalination system integrated with thermoelectric generator and solar pond. International Journal of Heat and Mass Transfer, 168: 120844. https://doi.org/10.1016/j.ijheatmasstransfer.2020.120844
[10] Ashouri, M., Vandani, A.M.K., Mehrpooya, M., Ahmadi, M.H., Abdollahpour, A. (2015). Techno-economic assessment of a Kalina cycle driven by a parabolic Trough solar collector. Energy Conversion and Management, 105: 1328-1339. https://doi.org/10.1016/j.enconman.2015.09.015
[11] Ghaebi, H., Parikhani, T., Rostamzadeh, H., Farhang, B. (2017). Thermodynamic and thermoeconomic analysis and optimization of a novel combined cooling and power (CCP) cycle by integrating of ejector refrigeration and Kalina cycles. Energy, 139: 262-276. https://doi.org/10.1016/j.energy.2017.07.154
[12] DiPippo, R. (2004). Second Law assessment of binary plants generating power from low-temperature geothermal fluids. Geothermics, 33(5): 565-586. https://doi.org/10.1016/j.geothermics.2003.10.003
[13] Gerber, L., Maréchal, F. (2012). Environomic optimal configurations of geothermal energy conversion systems: Application to the future construction of Enhanced Geothermal Systems in Switzerland. Energy, 45(1): 908-923. https://doi.org/10.1016/j.energy.2012.06.068
[14] Rodríguez, C.E.C., Palacio, J.C.E., Venturini, O.J., Lora, E.E.S., Cobas, V.M., Dos Santos, D.M., Gialluca, V. (2013). Exergetic and economic comparison of ORC and Kalina cycle for low temperature enhanced geothermal system in Brazil. Applied Thermal Engineering, 52(1): 109-119. https://doi.org/10.1016/j.applthermaleng.2012.11.012
[15] Coskun, A., Bolatturk, A., Kanoglu, M. (2014). Thermodynamic and economic analysis and optimization of power cycles for a medium temperature geothermal resource. Energy Conversion and Management, 78: 39-49. https://doi.org/10.1016/j.enconman.2013.10.045
[16] Hua, J., Chen, Y., Wu, J., Zhi, Z., Dong, C. (2015). Waste heat supply-side power regulation with variable concentration for turbine in Kalina cycle. Applied Thermal Engineering, 91: 583-590. https://doi.org/10.1016/j.applthermaleng.2015.08.048
[17] Arrieta, M.D.P., Arrieta, F.R.P. (2018). KCS34 evaluation for WHR in cement industry. International Journal of Advanced Engineering Research and Science, 5(11): 268245. https://doi.org/10.22161/ijaers.5.11.27
[18] Ishida, M., Kawamura, K. (1982). Energy and exergy analysis of a chemical process system with distributed parameters based on the enthalpy-direction factor diagram. Industrial & Engineering Chemistry Process Design and Development, 21(4): 690-695. https://doi.org/10.1021/i200019a025
[19] Abam, F.I., Briggs, T.A., Diemuodeke, O.E., Ekwe, E.B., Ujoatuonu, K.N., Isaac, J., Ndukwu, M.C. (2020). Thermodynamic and economic analysis of a Kalina system with integrated lithium-bromide-absorption cycle for power and cooling production. Energy Reports, 6, 1992-2005. https://doi.org/10.1016/j.egyr.2020.07.021
[20] Khankari, G., Munda, J., Karmakar, S. (2016). Power generation from condenser waste heat in coal-fired thermal power plant using Kalina cycle. Energy Procedia, 90: 613-624. https://doi.org/10.1016/j.egypro.2016.11.230
[21] Ogriseck, S. (2009). Integration of Kalina cycle in a combined heat and power plant, a case study. Applied Thermal Engineering, 29(14-15): 2843-2848. https://doi.org/10.1016/j.applthermaleng.2009.02.006
[22] Nassir, A.K., Shahad, H.A. (2022). Effect of operating conditions on Modified Kalina cycle performance. International Journal of Heat and Technology, 40(5): 1186-1195. https://doi.org/10.18280/ijht.400509
[23] Srinivas, T., Ganesh, N.S., Shankar, R. (2019). Flexible Kalina Cycle Systems. CRC Press. http://dx.doi.org/10.1201/9780429487774
[24] Kim, K.H., Ko, H.J., Han, C.H. (2020). Exergy analysis of Kalina and Kalina flash cycles driven by renewable energy. Applied Sciences, 10(5): 1813. https://doi.org/10.3390/app10051813
[25] Ma, D., Xiao, Y., Guo, Z. (2022). Environmental regulation, technological progress and carbon emission efficiency: An empirical analysis based on panel data of Chinese provinces. Opportunities and Challenges in Sustainability, 1(1): 38-51. https://doi.org/10.56578/ocs010105
[26] Kilci, E.N. (2022). Incentives for Sustainability: Relationship Between Renewable Energy Use and Carbon Emissions for Germany and Finland. Opportunities and Challenges in Sustainability, 1(1): 29-37. https://doi.org/10.56578/ocs010104