Sunday A. Afolalu | Omolayo M. Ikumapayi* | Temitayo S. Ogedengbe | Abayomi Adegbenjo | Tien-Chien Jen
© 2022 IIETA. This article is published by IIETA and is licensed under the CC BY 4.0 license (http://creativecommons.org/licenses/by/4.0/).
OPEN ACCESS
The use of nanoparticles along with the conventional refrigerant in a vapor compression cycle is relatively a new idea, where nano-refrigerants are found to have improved thermo-physical properties over the conventional refrigerants. Nano-refrigerant is the combination of nanoparticles with the refrigerant to improve the performance of the refrigeration process. In this study, a developed nanofluid from agricultural source (rice husk) was applied in a domestic refrigerator and its performance investigated. The pre-developed nanofluid which was prepared using the synthesis, centrifugation and calcinations processes was administered in the compressor of the refrigerator at concentrations of 0.2wt%, 0.3wt%, 0.5wt% and 0.6wt% to form a mix with refrigerant R600a used in the compressor (as control) and allowed to run for 4 hours. Performance evaluation was measured using parameters such as pull down time, discharge temperature and coefficient of performance (COP). Results show an increase in the COP by 31, 23 and 35% compared to the control sample for the 0.2wt%, 0.3wt% and 0.5wt% concentrations respectively. The sample 0.6wt% and 0.5wt% showed the best pull down time with temperatures of -6.1 and -3.1℃ at 240 minutes respectively and a reduced discharge temperature of 7-16% by the 0.2wt%, 0.3wt% and 0.5wt% concentrations in respect to the control sample. Hence, the use of rice husk based nanofliud resulted in an enhanced performance for the domestic refrigerator.
compressor, COP, nanoparticles, refrigerant, temperature
Refrigeration is a thermodynamic process that involves heat removal from an enclosed space [1]. Refrigeration has numerous applications in human activities such as food processing, storage, and transportation, air conditioning, ice manufacturing, chemical industry, civil engineering and mining (freezing of moisture in unstable water-bearing soils), biomedical applications, manufacturing, pharmaceutical industry and fundamental research [2]. Chillers are also commonly utilized for adjusting ambient temperature to make humans more comfortable through air conditioning. Refrigeration applications are classified as domestic refrigerators, commercial freezers, cryogenics, air conditioners, and heating systems [3]. These four components are useful in creating a cycle that results in the removal of heat from a body [4]. The system operates using a refrigerant as the working fluid. This fluid undergoes four main processes to reject the heat to the environment, and keep the system at a low temperature [5]. The industrial techniques of manufacturing refrigerants are hazardous to the environment, as well as expensive. It is excellent to utilize a more ecologically friendly option that improves the performance of the refrigerant and refrigeration process while utilizing agricultural waste items that would otherwise be discarded.
Nanotechnology is one of today's most exciting and rapidly evolving scientific disciplines. It is, at its core, a modern scientific field that is always changing with a change in the interest of academics and commercial institutions and new research is presented to the scientific community [6, 7]. It finds application not only in science, but also in other areas of life such as medicine and even agriculture. The use of nanotechnology and agricultural wastes as viable replacement for refrigerants has recently attracted more attetion from researchers. Afolalu et al. [8] evaluated the performance of several nanoparticles in a base mineral oil for household refrigeration systems. In the study, to make copper oxide nanoparticles, walnut shell was utilized as a reducing agent. The nanoparticle was blended with mineral oil to test if it improved the operation of the refrigeration system over ordinary mineral oil. Their results show a reduction in the pull-down time by a approximate value of 8.98% and the net refrigeration effect increased by about 9.3% for sample 0.75g, while the pull-down time was reduced by 9.51% and the net refrigeration effect increased by 19.05% for 1.25g of nanoparticle. In another study by Kumar [9], the influence of nanoparticles on refrigeration cycle performance characteristics was investigated. The study covered the behavior of several nanoparticles such as CuO ad TiO2 throughout the vapor compression refrigeration cycle. They observed that the addition of nanorefrigerants increased the VCR system's heat transfer performance, particularly in nucleate and pool transferring boiling heat. In comparison to other nanoparticles, carbon nanotubes are the best candidate for heat transfer enhancement of base refrigerants. The rate of heat transfer increases as the nanoparticle dimension reduces, while the pressure drop lowers as the nanoparticle dimension decreases [9].
Adebisi et al. [10], investigated how to make silicon nanoparticles from agricultural waste. The goal of the study was to find a new way to use some agricultural wastes as potential supplies of silicon for PV cells, such as cassava periderm, maize stalk, and cob. The modified sol–gel process was used to make agro-based silica nanoparticles, which were then reduced with magnesium. Characterization softwares were used to characterize the products. Silicon nanoparticles with particle sizes less than 33.98 nm and purity of 98.89 percent, 31.20 nm and 99.89 percent, and 32.88 and 99.95 percent were reported. Also, Sözen [11] investigated the effect of using alumina (Al2O3) nanoparticles to promote passive heat transfer in an ammonia/water pair. He looked at how it was used in diffusion absorption coolers and how it affected the system's heat performance. Adding nanoparticles to a fluid improves heat transmission significantly as a result of the nanoparticles. Because of the nanoparticles, the fluid's capacity increases. As a result, the impact of Al2O3 nanoparticles in cooling/absorption fluid mixes on system performance was investigated in this work. The system with nanoparticles produced higher heat absorption characteristics according to the results of the studies. Because the heat transfer periods were shorter, the system's operation time was lowered. As a result, the desired temperature was achieved faster. Despite the suitability report as presented by Adebisi et al. [10] and Sözen [11], a major source of concern was the ecological consequence of using nanoparticles as refrigerant.
Hence, Vamshi et al.'s [12] study on the thermophysical parameters of a nano-refrigerant or nano-lubricant and their performance proved that the use of nanorefrigerant would not only ensure better performance for the system, but was also ecologically friendly. The review determined that as concentration rises, thermal conductivity rises as a result of rising temperature, and that nanoparticle concentration has a direct link with viscosity. Pressure drop increases as viscosity rises, necessitating high pumping power and hence high energy consumption to sustain flow. The industrial methods of synthesizing refrigerants are environmentally unfriendly and unsafe and expensive [13-15]. Although some hydro-chlorofluorocarbons (HCFCs) were first employed as a replacement for CFCs, they will be phased out globally between 2020 and 2030 due to their environmental consequences. HFCs, like CFCs and HCFCs, are artificial substances that do not exist in nature. As a result, it is obvious and far preferable to consider other natural sources [16], hence the need for agrowastes. This study therefore examines the use of an eco-friendly alternative that can boost the performance of the refrigerantsusing abundantly available agricultural wastes. Summarily, although previous studies on the use of nanomaterials and agrowastes in refrigerating systems have shown interesting results such as increased coefficient of performance, increase in cooling and heat absorption, however some of these refrigerant types have been confirmed as harmful to the environment and is currently being phased out. Some others are averagely expensive and should be better replaced with more affordable working fluid types. This current study is therefore unique as it presents the idea of nanorefrigerants developed from agrowaste which is readliy available in abundance [17].
2.1 Materials and equipment
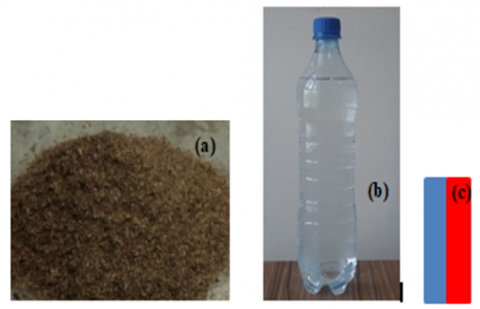
The following were the materials employed for this study; Rice husk ash, Distilled water, NaOH (Sodium hydroxide), H2S04 (Sulphuric acid), Litmus paper and Refrigerant (Figure 1). The equipment used during the study includes a transmission electron microscope (TEM), scanning electron microscope (SEM), centrifuge, muffle furnace, beakers and test tubes, digital electronic weighing balance, magnetic stirrer, sonicator, domestic refrigerator, decanted keg, oven, an ultrasonic bath and spatula.
Figure 1. (a) Rice Husk Ash (RHA) sample; (b) Distilled water; (c) Litmus paper
2.1.1 Nano-material preparation
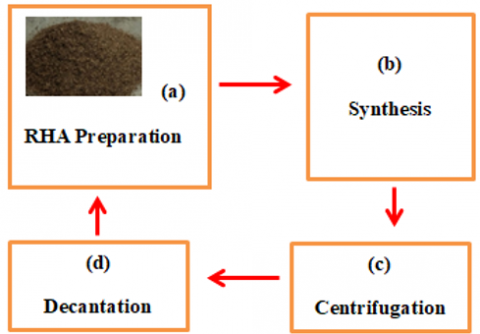
To produce Nano-material from rice husk, the rice husk was washed in distilled water to get rid of impurities and dried in a furnace at 500℃ to produce black ash which was cooled for about 12 hours. The ash was sieved and the base material used during silica nanoparticles sythesis. The synthesis was done using the reaction process using a magetic stirrer to stir the mixture of the rice husk ash and 120g of sodium hydroxide (NaOH) pellets and 1,500ml of distilled water in a beaker for 4 hours at 100℃ to form a darkened solution of sodium silicate. The solution was left to cool to room temperature after stirring and before titration was performed. 1,000ml of 10% H2SO4 was then added drop wise to the sodium silicate solution and constantly stirred until it was neutralized to a pH of 7 to form silica gel. It was left to age for about 48 hours to precipitate further. The centrifugation process followed after, during this process, nanoparticles were produced from the solution using the centrifuge by utilizing the principle of centrifugal forces to separate the denser particles from the watery solution. The particles were forced to settle at the bottom while the fluid floats above it within the tube. This results in the nanoparticles being deposited at the bottom of the tubes and the nanofluids floating in top. The fluids were then decanted and stored in a bottle while the particles remained in the tube. The cycle was repeated till all of the solution were centrifuged and decanted. The final process was the calcination process (Figure 2). After centrifuging, the nanoparticles were poured from the centrifuge tubes into the crucible to be calcinated in the muffle furnace for 6 hours, where it was exposed to extreme heat during the period. This produced clump of a black powdery substance. The powder was then ground using a small mortar and pestle to get rid of the clumps before transferring them into sample containers for characterization and testing [17].
Figure 2. Nanomaterial preparation steps
2.2 Experimentation process
2.2.1 Nano-refrigerant application in domestic refrigerator
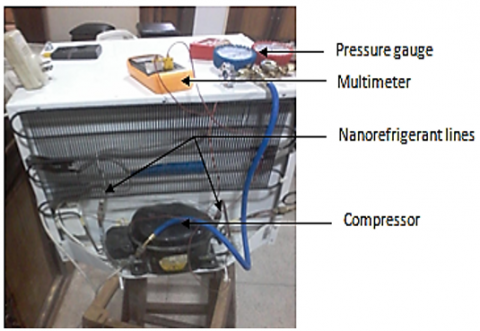
The pre-developed nano-refrigerant was applied in a domestic refrigerator set-up (Figure 3) with additional apparatus including the pressure gauges, thermocouples, and watt-meter. The nanoparticles were dispersed into 250 ml of the mineral oil at different volume concentrations then each fed into the domestic refrigerator’s compressor system. The experiment was run for 240 minutes with parameters such as pull down time, power consumption, coefficient of performance, refrigerating effect, and heat capacity and viscosity gotten.
Figure 3. Domestic refrigerator setup
3.1 Spectroscopical examination
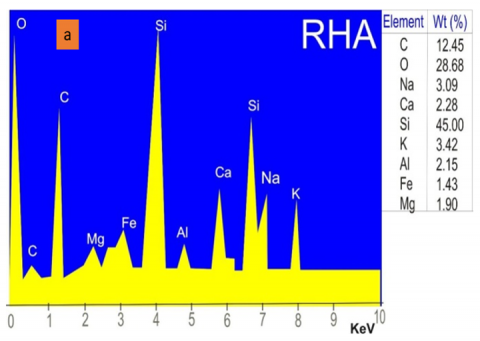
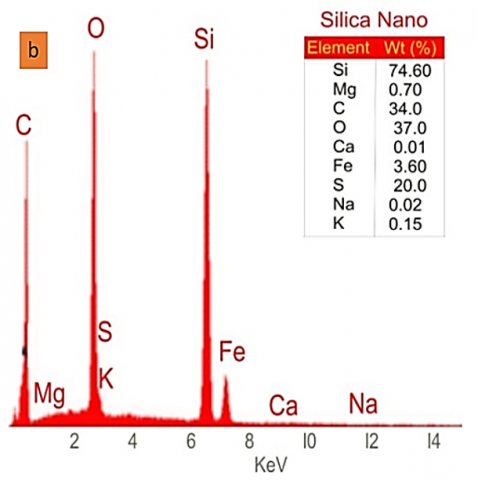
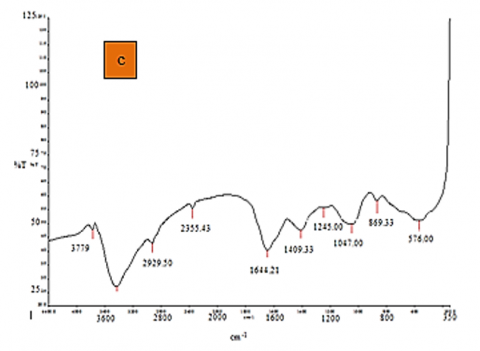
The Electro-Dispersive X-ray spectroscopy (EDS) was used to determine the composition of elements in the synthesized SiO2 nanoparticles and Rice husk ash. The micrograph in the Figure 4 for the Rice husk ash shows the percentage of silica in the sample. Nine elements were detected with varying concentrations with silica having the highest percentage concentration. The SiO2 Nanoparticles were also analyzed using the Electro-Dispersive X-ray spectroscopy. The results showed an increased concentration of silica, Si (74.60%), with comparatively high concentrations of carbon and oxygen. The greater concentration being silica assures that the nanoparticles are silica nanoparticles. The nanoparticles were also analyzed through the spectrometer for the FT-IR analysis. This was used to identify organic materials. The technical technique obtained an infrared spectrum of absorption or emission of the particles while concurrently measuring its intensity over a limited range of wavelengths per time.
Figure 4. (a) EDS Micrograph of Rice Husk Ash; (b) EDS Micrograph of developed nanoparticles; (c) FTIR graph for developed nanoparticles
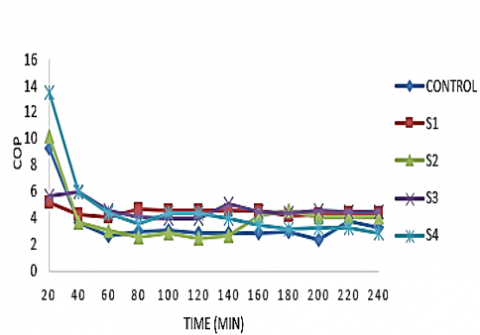
3.2 Coefficient of performance
The coefficient of performance of a refrigerator is the ratio of net refrigerating effect and compressor work. A greater COP would lead to lower efficiency [18], power consumption and therefore lower cost of operations.
COP$=\frac{\left(h_1-h_4\right)}{\left(h_2-h_1\right)}$
The Table 1 shows the variations of the coefficient of performance for each sample with time.
Table 1. Variation in coefficient of performance
|
COP |
|||||
|
CONTROL |
S1 |
S2 |
S3 |
S4 |
TIME(MIN) |
|
9.28 |
5.22 |
10.2 |
5.67 |
13.5 |
20 |
|
3.67 |
4.3 |
3.65 |
6 |
6 |
40 |
|
2.67 |
4.12 |
3.12 |
4.6 |
4.4 |
60 |
|
3.01 |
4.64 |
2.58 |
4.09 |
3.63 |
80 |
|
3.07 |
4.62 |
2.85 |
4 |
4.4 |
100 |
|
2.90 |
4.58 |
2.53 |
4 |
4.4 |
120 |
|
2.93 |
4.60 |
2.73 |
5.1 |
4 |
140 |
|
2.91 |
4.60 |
4.20 |
4.5 |
3.5 |
160 |
|
3.00 |
4.15 |
4.62 |
4.37 |
3.23 |
180 |
|
2.38 |
4.25 |
4.12 |
4.6 |
3.33 |
200 |
|
3.75 |
4.37 |
4.12 |
4.5 |
3.33 |
220 |
|
3.33 |
4.37 |
4.12 |
4.5 |
2.85 |
240 |
Figure 5. Variation of COP
From the graph in Figure 5, the results indicate that the samples, 0.2wt% (S1), 0.3wt% (S2) and 0.4wt% (S3) had the highest COP with a 31.23, 23.7 and 35.1% increase in the COP compared to the control value respectively. The sample, 0.6wt% (S4) had the lowest COP, 14% lower than that of the control.
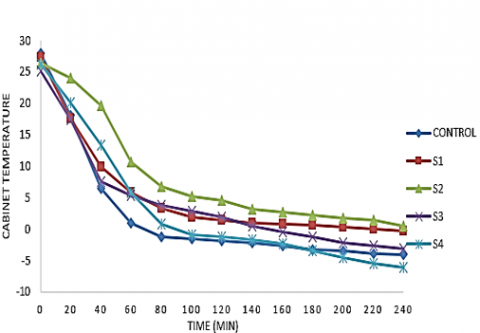
3.3 Pull down time
This is the necessary time to cool down the refrigerator from its ambient temperature to the desired temperature. The temperature values were gotten using thermocouples. The Table 2 indicates the readings for the different volume concentrations of the nano-refrigerant.
The graph in Figure 6 indicates a continuous decrease in the cabinet temperature across all samples from the initial start-up. A high reduction in the cabinet temperature after start-up signifies a high cooling rate [19, 20]. The sample 0.6wt% (S4) and 0.5wt% (S3) showed the best pull down time with temperatures of -6.1 and -3.1℃ at 240 minutes respectively. The sample 0.2wt% (S1) displayed a fairly constant temperature reading after 140 minutes. The sample 0.3wt% (S2) had the lowest cabinet temperature after 240 minutes.
Table 2. Pull down time per concentration
|
Cabinet Temperature (℃) |
|||||
|
CONTROL |
S1 |
S2 |
S3 |
S4 |
TIME (MIN) |
|
28 |
27.3 |
26.4 |
25.2 |
26.2 |
0 |
|
20.6 |
22.5 |
25.7 |
21.7 |
21.8 |
10 |
|
18 |
17.6 |
24.1 |
17.5 |
20.1 |
20 |
|
10.6 |
14.3 |
22.4 |
11.3 |
16.3 |
30 |
|
6.5 |
9.9 |
19.7 |
7.5 |
13.3 |
40 |
|
2.6 |
7.8 |
15.5 |
6.0 |
10.0 |
50 |
|
0.9 |
5.9 |
10.7 |
5.4 |
5.9 |
60 |
|
-0.6 |
4.2 |
7.7 |
4.5 |
2.6 |
70 |
|
-1.2 |
3.3 |
6.7 |
3.8 |
0.8 |
80 |
|
-1.4 |
2.5 |
5.5 |
3.5 |
-0.4 |
90 |
|
-1.5 |
1.9 |
5.2 |
2.8 |
-0.9 |
100 |
|
-1.7 |
1.7 |
4.9 |
2.3 |
-1.0 |
110 |
|
-1.8 |
1.5 |
4.5 |
1.9 |
-1.2 |
120 |
|
-1.9 |
1.2 |
3.5 |
0.9 |
-1.4 |
130 |
|
-2.2 |
1.0 |
3.2 |
0.5 |
-1.7 |
140 |
|
-2.4 |
1.0 |
3.0 |
0 |
-1.9 |
150 |
|
-2.7 |
0.8 |
2.7 |
-0.5 |
-2.3 |
160 |
|
-3.0 |
0.7 |
2.5 |
-0.9 |
-3.0 |
170 |
|
-3.2 |
0.7 |
2.2 |
-1.3 |
-3.5 |
180 |
|
-3.4 |
0.5 |
1.9 |
-1.7 |
-4.0 |
190 |
|
-3.5 |
0.3 |
1.7 |
-2.1 |
-4.5 |
200 |
|
-3.7 |
0.1 |
1.6 |
-2.4 |
-5.0 |
210 |
|
-3.9 |
0 |
1.4 |
-2.7 |
-5.5 |
220 |
|
-4.0 |
-0.2 |
0.9 |
-3.0 |
-5.8 |
230 |
|
-4.1 |
-0.3 |
0.5 |
-3.1 |
-6.1 |
240 |
Figure 6. Graph of pull down time per concentration
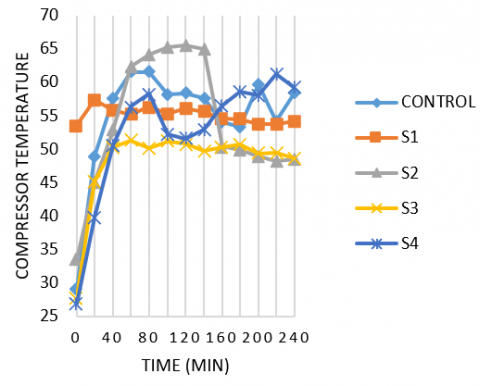
3.4 Discharge temperature
This is the temperature of the refrigerant exiting the compressor as depicted in Table 3. This was measured using the thermocouple K for each concentration and plotting against time.
The graph in Figure 7 shows a steady rise of the discharge temperature from the start of the experiment. The sample 0.6wt% (S4) having the greatest discharge temperature, approximately 2% greater than that of the control. On the other hand, the samples 0.2wt% (S1), 0.3wt% (S2) and 0.5wt% (S3) having low discharge temperatures that are 7, 17 and 16% lower than that of the control sample respectively. This is desirable as a lower discharge temperature would mean less compressor work [21, 22].
Table 3. Variation of discharge temperature with time
|
Discharge Temperature (℃) |
|||||
|
CONTROL |
S1 |
S2 |
S3 |
S4 |
TIME(MIN) |
|
29.1 |
53.6 |
33.5 |
27.8 |
26.9 |
0 |
|
43.4 |
56.5 |
40.3 |
39.5 |
34.5 |
10 |
|
48.9 |
57.4 |
45.1 |
45.2 |
39.7 |
20 |
|
53 |
55.4 |
50.1 |
45.3 |
46.7 |
30 |
|
57.5 |
55.9 |
52.8 |
50.3 |
50.6 |
40 |
|
59.1 |
55.8 |
57.4 |
51.3 |
55.1 |
50 |
|
61.6 |
55.2 |
62.3 |
51.3 |
56.4 |
60 |
|
61.9 |
55.8 |
63.0 |
50.0 |
57.4 |
70 |
|
61.6 |
56.4 |
64.1 |
50.2 |
58.3 |
80 |
|
60.1 |
56.2 |
65.0 |
50.9 |
58.5 |
90 |
|
58.2 |
55.3 |
65.3 |
51.1 |
52.2 |
100 |
|
56.1 |
56.2 |
64.6 |
51.6 |
52.5 |
110 |
|
58.4 |
56.1 |
65.5 |
50.8 |
51.6 |
120 |
|
56.5 |
56.3 |
65.9 |
48.9 |
51.1 |
130 |
|
57.6 |
55.6 |
65.0 |
49.7 |
52.9 |
140 |
|
55.4 |
55.3 |
51.0 |
49.8 |
56.9 |
150 |
|
54.0 |
54.6 |
50.4 |
50.3 |
56.6 |
160 |
|
58.0 |
54.2 |
50.5 |
50.2 |
57.2 |
170 |
|
53.4 |
54.5 |
49.9 |
50.7 |
58.6 |
180 |
|
57.0 |
53.6 |
50.7 |
50.8 |
58.2 |
190 |
|
59.7 |
53.8 |
48.9 |
49.4 |
58.0 |
200 |
|
56.3 |
53.6 |
47.2 |
50.6 |
60.2 |
210 |
|
54.2 |
53.7 |
48.2 |
49.5 |
61.3 |
220 |
|
53.0 |
55.0 |
49.8 |
50.2 |
60.6 |
230 |
|
58.5 |
54.2 |
48.5 |
48.7 |
59.2 |
240 |
Figure 7. Graph of variation of discharge temperature with time
In this study, the performance of a domestic refrigeration system using an agro-based nano refrigerant has been attempted. Results obtained and discussed aided the following conclusions from the work:
[1] Coker, A.K. (2015). Refrigeration Systems. Gulf Professional Publishing, 623-737.
[2] Sruthi, M., Roy, R., Kumar, B. (2017). Development of refrigerants: A brief review. Indian Journal of Scientific Research, 14(2): 175-181.
[3] Brown, D.R., Fernandes, N., Dirks, J.A. and Stout, T.B. (2010). The prospects of alternatives to vapor compression technology for space cooling and food refrigeration application. Energy Conversion and Management, 12: 15-35.
[4] Azmi, W.H., Sharif, M.Z., Yusof, T.M., Mamat, R., Redhwan, A.A.M. (2017). Potential of nanorefrigerant and nanolubricant on energy saving in refrigeration system - a review. Renewable and Sustainable Energy Reviews, 69: 415-428. https://doi.org/10.1016/j.rser.2016.11.207
[5] Kumar, S., Kanimozhi, B., Sunil Kumar, M. (2021). Performance evaluation of refrigeration system using nano-fluid. Materials Today: Proceedings, 44: 3838-3845. https://doi.org/10.1016/j.matpr.2020.12.339
[6] Pal, S.L., Jana, U., Manna, P.K., Mohanta, G.P., Manavalan, R. (2011). Nanoparticle: An overview of preparation and characterization. Journal of Applied Pharmaceutical Science, 1(6): 228-234.
[7] Afolalu, S.A., Ikumapayi, O.M., Adeoye, A.O.M., Bello, K.A., Ogundipe, A.T., Banjoko, M.O. (2022). Performance assessment of varying nanoparticles in a base mineral oil for domestic refrigeration system. Materials Today: Proceedings, 62: 3350-3354. https://doi.org/10.1016/j.matpr.2022.04.246
[8] Afolalu, S.A., Ikumapayi O.M., Oloyede O.R., Ogedengbe T.S., Adebayo T.O. (2022). Advances in nanotechnology and nanoparticles in the 21st century - an overview. Proceedings of the 3rd African International Conference on Industrial Engineering and Operations Management Nsukka, Nigeria.
[9] Kumar, R. (2019). Effect of nanoparticles on performance characteristics of refrigeration cycle. Low - Temperature Technologies. https://doi.org/10.5772/intechopen.89236
[10] Adebisi, J.A., Agunsoye, J.O., Ahmed, I.I., Bello, S.A., Haris, M., Ramakokovhu, M.M., Hassan, S.B. (2020). Production of silicon nanoparticles from selected agricultural wastes. Materials Today: Proceedings, 38: 669-674. https://doi.org/10.1016/j.matpr.2020.03.658
[11] Sözen, A., Özbaş, E., Menlik, T., Tarık Çakır, M., Gürü, M., Boran, K. (2014). Improving the thermal performance of diffusion absorption refrigeration system with alumina nanofluids: An experimental study. International Journal of Refrigeration, 44: 73-80. https://doi.org/10.1016/j.ijrefrig.2014.04.018
[12] Vamshi, J., Anand, K.M., Sharma, A., Kumar, A., Kumar, S., Kotia, A., Choudhary, R. (2021). A review on the utilization of nanoparticles in the refrigeration system as nano-refrigerant and nano-lubricant. Materials Today: Proceedings, 5(1). https://doi.org/10.1016/j.matpr.2021.05.538
[13] Cheng, H., Zhou, Y., Liu, Q. (2019). Kaolinite nanomaterials: Preparation, properties and functional applications. In Nanomaterials from Clay Minerals: A New Approach to Green Functional Materials. Elsevier Inc.
[14] Sinsinwar, S., Kumar, M., Rohit, K., Nithyanand, P. (2018). Microbial Pathogenesis Use of agricultural waste (coconut shell) for the synthesis of silver nanoparticles and evaluation of their antibacterial activity against selected human pathogens. Microbial Pthogenesis, 124: 30-37. https://doi.org/10.1016/j.micpath.2018.08.025
[15] Adelekan, D.S., Ohunakin, O.S., Babarinde, T.O., Odunfa, M.K., Leramo, R.O., Oyedepo, S.O., Badejo, D.C. (2017). Experimental performance of LPG refrigerant charges with varied concentration of TiO2 nano-lubricants in a domestic refrigerator. Case Studies in Thermal Engineering, 9: 55-61. https://doi.org/10.1016/j.csite.2016.12.002
[16] Bolaji, B.O., Huan, Z. (2013). Ozone depletion and global warming: Case for the use of natural refrigerant - a review. Renewable and Sustainable Energy Reviews, 18: 49-54. https://doi.org/10.1016/j.rser.2012.10.008
[17] Ajuka, L.O., Ikumapayi, O.M., Akinlabi, E.T. (2022). Entropy generation of graphene nanoplatelets in micro and mini channels: Nanofluid flow in automotive cooling applications. International Journal of Heat and Technology, 40(4): 917-926. https://doi.org/10.18280/ijht.400408
[18] Ajuka, L.O., Odunfa, M.K., Oyewola, M.O., Ikumapayi, O.M., Akinlabi, S.A., Akinlabi, E.T. (2022). Modeling of viscosity of composite of TiO2–Al2O3 and ethylene glycol nanofluid by artificial neural network: Experimental correlation. Int. J. Interact Des. Manuf. https://doi.org/10.1007/s12008-022-00906-0
[19] Afolalu, S.A., Ikumapayi, O.M., Ogundipe, A.T., Yusuf, O.O., Oloyede, O.R. (2021). Development of nanolubricant using aloe vera plant to enhance the thermal performance of domestic refrigeration system. International Journal of Heat and Technology, 39(6): 1904-1908. https://doi.org/10.18280/ijht.390626
[20] Akande, S., Azeez, T.M., Kayode, J.K., Onuoha, K.I., Ikumapayi, O.M., Akinlabi, S.A., Akinlabi, E.T. (2022). Development of an efficient rice De-stoner. Materials Today: Proceedings, 62: 4242-4248. https://doi.org/10.1016/j.matpr.2022.04.753
[21] Afolalu, S.A., Ikumapayi, O.M., Adeoye, A.O.M., Bello, K.A., Ogundipe, A.T., Banjoko, M.O. (2022). Performance assessment of varying nanoparticles in a base mineral oil for domestic refrigeration system. Materials Today: Proceedings, 62: 3350-3354. https://doi.org/10.1016/j.matpr.2022.04.246
[22] Yussouff, A.A., Owoeye, S.O, Yussouff, A.O., Ogedengbe, T.S., Rasheed O.S. (2018). Investigating the performance of R134a domestic refrigerator retrofitted with R290 (Propane) and R600a (Iso-Butane) refrigerants in three different size of capillary tube in a refrigerating system. Proceedings of the 2018 International Conference on STEM: A driving force for sustainable development tagged COLENG 2018, Federal University of Agriculture, Abeokuta, pp. 624-637.