Ta Van Chuong* | Do Duc Nam | Phan Thi Thu Huong | Nguyen Quoc Uy | Ngo Minh Duc | Nguyen Trong Hieu | Nguyen Cong Duc | Tran Dai Nghia
© 2022 IIETA. This article is published by IIETA and is licensed under the CC BY 4.0 license (http://creativecommons.org/licenses/by/4.0/).
OPEN ACCESS
Drying is one of the most important steps in tobacco processing because it determines the color, taste, and micronutrients in tobacco. The loading density and the arrangement of tobacco leaves in the drying chamber affect the temperature and humidity distribution of the air, thereby affecting the drying quality. In this paper, three drying cases with different tobacco weights were studied by computational fluid dynamics (CFD) simulation as well as experimental. The results show that when the loading density of the tobacco drying chamber increases, the local resistance of tobacco leaves increases sharply, and the velocity difference and temperature difference of the air in the tobacco drying chamber increases. The maximum temperature difference in the highest loading density reaches 10 K. The uneven temperature distribution of the air reduces the quality of the dried tobacco.
tobacco, drying quality, loading density, curing, CFD simulation
Tobacco is an agricultural plant widely grown in Vietnam and brings great economic value to farmers. The price of tobacco depends a lot on the processing process. Tobacco leaves must undergo a drying process before stored or used. This process is also known as curing. During the drying process, the weight of tobacco leaves can be reduced by as much as 85 percent due to the reduction of moisture from the leaves [1]. This is one of the most important steps in tobacco processing because it determines tobacco's colour, taste, and micronutrients [2-7]. In Vietnam, tobacco is often dried in manual drying chambers using wood fuel. It works based on natural convection, in which fresh tobacco leaves are hung inside a drying chamber, and heat is provided from a hot flue pipe connected to a wood-burning furnace [8]. In the tobacco harvest season, the demand for firewood for drying is high, leading to overexploitation of some forests. In order to reduce deforestation, tobacco drying systems that do not use wood are researched and manufactured for use. These drying systems have a forced air circulation system and automatic control system to save energy and reduce labour [9, 10].
The tobacco drying process is usually divided into three stages: yellowing, leaf drying, and stem drying [11]. The changes in tobacco in each stage are mainly due to water evaporation and enzymatic reactions [12, 13]. The quality of tobacco drying is affected by airflow, temperature and humidity distribution in the drying chamber. For high drying quality, the temperature and humidity of the air in each drying stage must be precisely controlled according to the drying process. Therefore, many studies have been carried out to study the drying chamber's flow and heat transfer process. Studies are usually performed experimentally or using CFD simulations. In recent years, CFD simulation studies on tobacco drying have increased and yielded many beneficial results. CFD models have been built based on porous, heat transfer, and turbulence models from which to study the temperature and humidity fields in the drying chamber [14-17]. The simulation results are consistent with the experimental data and are used to study energy saving, design optimization and improve the quality of the drying process.
A new tobacco drying system using a boiler to heat the air has been built and used for experimental research. An unstable-mode CFD simulation of the drying chamber was also built to investigate the temperature distribution as well as the air velocity in the drying chamber under different load and leaf arrangements. The research process was carried out through the following steps: Validate the CFD model with measured data in experimental; Study the distribution of air temperature and the flow of air in the drying chamber; Study temperature distribution when drying different volumes of tobacco. The research results can be used to optimize the operation and improve the quality of tobacco drying.
2.1 Description of the tobacco drying system
The tobacco drying system consists of a drying chamber and frame, a boiler with a water tank, a heater, a fan, and a control box, as shown in Figure 1. The nominal pressure of the boiler is 5 bar, corresponding to a saturated steam temperature of 152℃. The heater power depends on the passing steam's temperature and mass flow rate; its maximum power is 30 kW. A water tank with a volume of 1 m3 is used to supply water to the boiler. The drying chamber is a 20-feet container with a length of 6.06 m, 2.44 m wide and 2.59 m high, and its total volume is 32.58 m3. This drying chamber is suitable for drying from 800 kg to 1000 kg of fresh tobacco leaves at a time. In the drying chamber, there is a steel frame to arrange tobacco leaves and a partition wall to distribute the air (Figure 2). The steel frame is made of stainless steel, divided into three floors to hang tobacco leaves. The lowest floor has a height of 0.78m; the upper floors have a height of 0.7m. The frame is fixed inside the drying chamber, 0.5m from the door. Tobacco leaves were tied along with sticks before being placed on the steel frame.
Figure 1. Structure of tobacco drying system
Figure 2. Structure of steel frame and partition wall
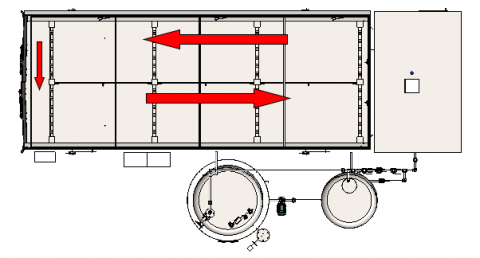
The air will be recirculated in the drying chamber, as shown in Figure 3. The fan pushes the air through the heater at the end of the drying system to become hotter and then enters the drying chamber. In the drying chamber, air passes through the tobacco leaves to receive moisture, moves around the partition wall, and returns to the heat exchanger. Some air will go out of the drying chamber through the doors on the side and top of the drying chamber, carrying heat and moisture. Outdoor air is supplemented through the intakes and circulated by the fan in the system. This air receives heat from the heater and moisture from the tobacco leaves and is then also pushed outdoors.
Figure 3. Direction of air flow in the drying chamber
2.2 Experimental setup
The tobacco drying system has been manufactured according to the design shown in Figure 4. The system has been used to study the experimental drying of tobacco. Integrated temperature and humidity sensors have been installed in the drying chamber to get control signals. The temperature and humidity accuracy of the sensors is 0.5 K and 5% RH, respectively. Signals were obtained from sensors used to control the fan, air doors and heater. Six sensors have been arranged relatively evenly in the space of the drying chamber. The details of the location of the sensors are shown in Figure 5. The sensors can be moved to measure the temperature distribution of the air in the drying chamber.
Figure 4. Experimental tobacco drying system
Figure 5. Distribution of integrated temperature and humidity sensors
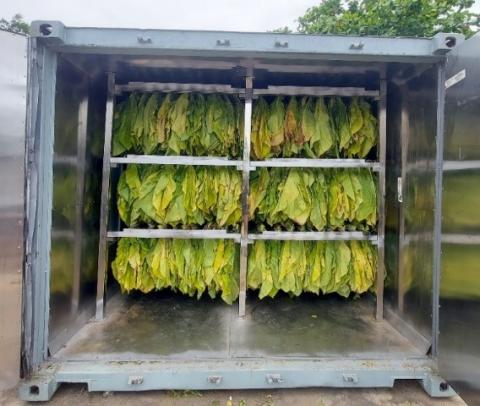
Figure 6. Arrangement of tobacco leaves in the drying chamber
In the drying chamber, tobacco leaves were tied along with sticks before being placed on a steel frame, as shown in Figure 6. Three tobacco drying cases with different fresh tobacco weights were studied. Experiment cases 1, 2, and 3 were dried at 800kg, 1600kg, and 2000kg, respectively. With different amounts of dried tobacco, the resistance of the tobacco block has changed, affecting the ventilation and temperature distribution in the drying chamber. The drying time is also different in each case. With the weight of fresh tobacco leaves to be dried at 800kg, 1600kg, and 2000kg, the drying time is 96 hours, 112 hours, and 116 hours respectively. They directly affect the quality of tobacco leaves after drying.
2.3 Mathematical modeling
The model of tobacco drying is based on the following assumptions: The tobacco leaf regions are assumed to be porous material; the respiration of tobacco leaves during processing has been neglected; the airflow in the tobacco leaf zone was considered incompressible; the heater was described as a volumetric heat source, the fan model in the ANSYS CFX was used. The heat loss qloss from the drying chamber to the atmosphere is calculated using the total heat transfer coefficient and the ambient temperature by the formula:
${{q}_{loss}}={{U}_{ove}}\left( {{t}_{dry}}-{{t}_{amb}} \right)$ (1)
where, Uove is the overall heat transfer coefficient, tdry is the air temperature in the drying chamber, tamb is the ambient temperature.
The porous model is both a generalization of the Navier-Stokes equations and Darcy's law commonly used for flows in porous regions. It can model flows where the geometry is too complex to resolve with a grid. The model retains both advection and diffusion terms and can be used where such effects are important. The porosity model is solved based on the volume porosity concept and the equations: the general scalar advection-diffusion equation in a porous and the equations for conservation of mass and momentum.
The volume porosity γ at a point is the ratio of the volume V′ available to flow in an infinitesimal control cell surrounding the point, and the physical volume V of the cell [18]:
$\gamma =\frac{{{V}^{'}}}{V}$ (2)
The general scalar advection-diffusion equation in a porous, the equations for conservation of mass and momentum according to [18] are described as follows, respectively.
$\frac{\partial }{\partial t}\left( \gamma \rho \Phi \right)+\nabla \cdot \left( \rho K\cdot U\Phi \right)-\nabla \cdot \left( \Gamma K\cdot \nabla \phi \right)=\gamma S$ (3)
$\frac{\partial }{\partial t}\gamma \rho +\nabla \cdot \left( \rho K\cdot U \right)=0$ (4)
$\frac{\partial }{\partial t}\left( \gamma \rho U \right)+\nabla \cdot \left( \rho \left( K\cdot U \right)\otimes U \right)-\nabla \cdot \left( {{\mu }_{e}}K\cdot \left( \nabla U+{{\left( \nabla U \right)}^{T}}-\frac{2}{3}\delta \nabla \cdot U \right) \right)=\gamma {{S}_{M}}-\gamma \nabla p$ (5)
where, ρ is density, K is the area porosity tensor, U is the true velocity, μ is the effective viscosity - either the laminar viscosity or a turbulent quantity, and SM is a momentum source.
A computational fluid dynamic package ANSYS-CFX was used for the CFD simulation of processes in the tobacco drying system, which uses the Finite Volume Method (FVM) [19].
3.1 Geometry and meshing
The tobacco drying system model depicted in Figure 1 has been built and meshed in ICEM CFX. The simulation domain includes both the tobacco drying chamber and the air heating chamber where the fan and heater are located. The meshing method, size, and a number of mesh elements greatly affect the simulation results. Structured grids are used in the model to speed up the solver. The maximum mesh size is 100mm, and small volume areas and significant variation in temperature or air velocity are finer meshed. In this study, three types of grids with different elements (Table 1) were created and researched to determine the appropriate number of elements. Simulations with three mesh types have been initialized. The temperature distribution in each case is studied and compared with the experiment. The maximum temperature difference between simulation and experiment in the case of mesh 1 is 3.5 K, mesh 2 is 1.5 K, and mesh 3 is 1.4 K. This result shows that the number of elements such as mesh 2 is appropriate. A finer mesh does not increase accuracy much but greatly increases computation time.
Table 1. Information on the mesh in the tests
|
|
Mesh 1 |
Mesh 2 |
Mesh 3 |
|
Total elements |
266614 |
727937 |
3615581 |
|
Total nodes |
58125 |
186191 |
596848 |
After meshing, the model includes four material regions to set up computational domains for the air, the porous material, the fan, and the heater (Figure 7). The details of the number of elements of each computational domain are shown in Table 2.
Figure 7. Geometry and meshing model in ICEM CFD
Table 2. The number of elements in computational domains
|
Computational domains |
Total elements |
|
Air |
420531 |
|
Tobacco leaves |
120944 |
|
Heater |
12063 |
|
Fan |
81337 |
3.2 Simulation setup
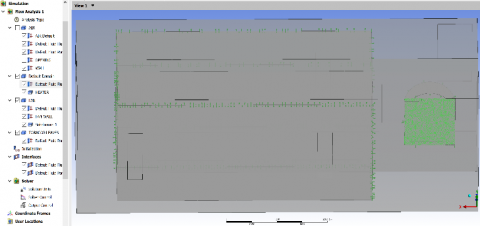
After meshed in ICEM CFD, the system model was transferred to ANSYS CFX for simulation. In ANSYS CFX, computational domains, porosity models, heat transfer models and boundary conditions have been set up [18], as shown in Figure 8.
The initialised transient simulation was developed using the porous medium, k-ε turbulence and heat transfer models [18, 20, 21]. The initial temperature of the system was assumed to be uniform at 303 K. The time step was chosen to be 5s. The solution is iterated until convergence is achieved; the residual for each equation falls below 10-5, and changes in mass-flow rates, temperature and energy for airflow become negligible.
Figure 8. Setting simulation parameters in ANSYS CFX
4.1 Computational validation
During the stem drying stage, the air temperature in the drying chamber is the highest, and the temperature difference between locations in the drying chamber is also the largest. During this stage, the air temperature is usually set around 343 K. The actual temperature value depends on many factors such as tobacco type, leaf maturity, and leaf size. To validate the simulation, the temperature at the sensors during the experiment was compared with the temperature obtained from the simulation. Details of the temperatures at measurement points from the experiment and simulation are shown in Table 3.
The results show the agreement between the simulation and experimental. The temperature distribution between simulation and experiment is analogous. At the end of the drying zone, due to the high resistance of the tobacco, the air flow is slow, resulting in a lower temperature than in other areas. The maximum temperature difference between the experiment and simulation is 3.5 K in the tobacco region at the end of the drying chamber. The simulation results are much lower than the experimental results, possibly because the simulation has not accurately described the structure of the heater. More precise construction of the heater's structure will make the heat transfer simulation in the drying chamber more accurate.
4.2 Velocity distribution
The velocity distribution of the air in the drying chamber is shown in Figure 9. The air is drawn by the fan through the heater into the drying chamber. The hot air enters the drying chamber space, passes through the tobacco leaf, considered a porous material, and then returns to the heating chamber. Due to the baffle in the middle of the drying chamber, the air flow moves into a closed loop. Details of the distribution of air velocity vectors starting at the cross-section of the drying chamber at z=1,295 are shown in Figure 10. Accordingly, the air velocity in front of the fan is the highest, up to 10 m/s. The air velocity in the porous domain is very small because the local resistance of the porous domain is considerable. The air velocity will affect the temperature distribution as well as the dehumidification process in the drying chamber. Therefore, it affects the quality of dried tobacco.
Figure 9. Velocity distribution on the streamlines in the simulation domain
Figure 10. Velocity distribution from the cross-section (1.295 m from the bottom)
4.3 Temperature distribution
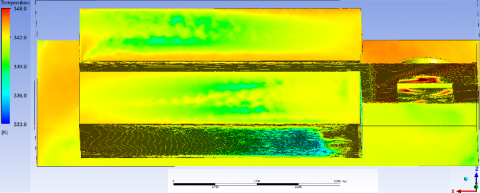
The temperature distribution on the surfaces in the simulation domains is shown in Figure 11. Accordingly, the highest temperature is 345 K, and the lowest is 333 K. In porous materials, the temperature ranges from 333 K to 343 K, and the maximum temperature difference is 10 K. The temperature inside this material is lower than outside. Along the center line of the porous material, in the direction of air movement, the air temperature decreases gradually due to the resistance of the tobacco leaves.
Table 3. Comparison of the temperature between CFD simulation and experiment
|
Case 1: 800kg |
Case 2: 1600kg |
Case 3: 2000kg |
|||||||
|
Point |
TExp (K) |
TSim (K) |
ΔT (K) |
TExp (K) |
TSim (K) |
ΔT (K) |
TExp (K) |
TSim (K) |
ΔT (K) |
|
1 |
342.8 |
344.2 |
1.4 |
343.5 |
344.8 |
1.3 |
343.2 |
345.3 |
2.1 |
|
2 |
342.4 |
343.6 |
1.2 |
341.2 |
343.4 |
2.2 |
339.7 |
341.7 |
2 |
|
3 |
340.3 |
342.2 |
1.9 |
339.1 |
340.3 |
1.2 |
339.4 |
337.8 |
-1.6 |
|
4 |
343.1 |
342.6 |
-0.5 |
342.3 |
343.7 |
1.4 |
341.4 |
343.1 |
1.7 |
|
5 |
342.2 |
342 |
-0.2 |
341.2 |
341.8 |
0.6 |
341.6 |
340.3 |
-1.3 |
|
6 |
344.3 |
342.4 |
-1.9 |
343.2 |
341.0 |
-2.2 |
342.8 |
339.3 |
-3.5 |
Figure 12 shows the temperature distribution at the cross-sections (1,295 m from the bottom) in three drying simulations with different weights of fresh tobacco leaves, including (a) 800 kg, (b) 1600 kg, and (c) 2000 kg. According to the figure, the temperature in the volume of tobacco leaves is lower than the outside temperature, and the weight of tobacco leaves being dried significantly affects the temperature distribution in the drying chamber. In the case of drying 800 kg of fresh tobacco leaves, the resistance of the tobacco leaves is small, the air flow through the volume is favorable, and the temperature in the drying area is nearly uniform. In the volume of tobacco leaves, the highest temperature is 344.8 K, and the lowest temperature is 239.2 K; the maximum temperature difference in the volume of tobacco leaves is 5.6 K. When the weight of fresh tobacco increases, the resistance of the block increases, causing the temperature difference in the tobacco leaves to increase. The maximum temperature difference in the volume of tobacco leaves is approximately 10 K when drying 2000 kg of fresh tobacco leaves.
Figure 11. Temperature distribution on the surfaces
Figure 12. Temperature distribution in the cross-sections (1.295 m from the bottom) in the three different cases: (a) 800 kg, (b) 1600 kg, and (c) 2000 kg
The temperature distribution in the region of tobacco leaves, which are considered porous materials, at cross-sections passing through the region centerline is shown in Figures 13 and 14. Figure 13 shows the temperature at the cross-sections 0.61 m from the left wall, corresponding to the direction of air movement from the heater into the drying chamber. The effect of the amount of tobacco leaves dried on the temperature distribution in this plane is evident. When fresh tobacco leaves increased from 800 kg to 1600 kg and 2000 kg, the maximum temperature difference increased from 3.6 K to 8.5 K and 9.2 K, respectively. Figure 14 depicts the result of the temperature distribution at the cross-sections 0.61 m from the right wall, corresponding to the direction of air movement from the drying chamber to the heater. In this area, varying amounts of fresh tobacco leaves still alter the temperature distribution but not as clearly as in the left cross-section. There is more uniformity in this temperature distribution due to more evenly distributed air flow in this section and direct heat transfer from the heating chamber to the drying zone. The maximum temperature difference is 8.2 K, corresponding to the case of drying 2000 kg of tobacco leaves.
Figure 13. Temperature distribution in the cross-section of porous zone (0.61 m from left wall) in the three different cases: (a) 800 kg, (b) 1600 kg, and (c) 2000 kg
Figure 14. Temperature distribution in the cross-section of porous zone (0.61 m from right wall) in the three different cases: (a) 800 kg, (b) 1600 kg, and (c) 2000 kg
4.4 Quality of tobacco drying
After drying, tobacco leaves have been evaluated for quality. In terms of organoleptic terms, the dried product from the case of 800 kg has the best color and taste after drying. In the case of drying 1600 kg or 2000 kg, exceeding the design load, the quality of tobacco leaves after drying is uneven, and many leaves do not meet the requirements for color and taste. Samples of tobacco leaves after drying were also sent to the testing center for quality analysis. The analysis results showed that all indicators of tobacco quality, such as nicotine, glucose, protein and nitrogen content of the 800 kg sample, had the best results.
The effect of loading density and tobacco leaf arrangement on tobacco drying quality was studied by experiment and CFD simulation. CFD model has been built based on the porous, heat transfer, and turbulence models. Experiments were used to validate the model and analyze the quality of the dried tobacco product. The main conclusions drawn from the study are as follows:
The results can be used in research to save operating costs as well as improve the quality of the tobacco drying system.
This research is funded by People’s Committee of Gia Lai province under grant number KHGL – 02 – 19. This work was supported by Gia Lai Department of Science and Technology, and National Institute of Patent and Technology Exploitation, Ministry of Science and Technology.
|
A |
vector area, m2 |
|
K |
area porosity tensor |
|
S |
source |
|
T |
temperature, K |
|
U |
true velocity, m.s-1 |
|
V |
volume, m3 |
|
Greek symbols |
|
|
γ |
volume porosity |
|
µ |
dynamic viscosity, kg.m-1.s-1 |
|
ρ |
density, kg.m-3 |
|
Subscripts |
|
|
e |
effective |
|
exp |
experiment |
|
M |
momentum |
|
sim |
simulation |
[1] Guo, G.F., Li, B., Liu, C.X., et al. (2019). Characterization of moisture mobility and diffusion in fresh tobacco leaves during drying by the TG–NMR analysis. Journal of Thermal Analysis and Calorimetry, 135(4): 2419-2427. https://doi.org/10.1007/s10973-018-7312-x
[2] Zong, J., He, X., Lin, Z., et al. (2022). Effect of two drying methods on chemical transformations in flue-cured tobacco. Drying Technology, 40(1): 188-196. https://doi.org/10.1080/07373937.2020.1779287
[3] Zhao, S., Wu, Z., Lai, M., Zhao, M., Lin, B. (2022). Determination of optimum humidity for air-curing of cigar tobacco leaves during the browning period. Industrial Crops and Products, 183: 114939. https://doi.org/10.1016/j.indcrop.2022.114939
[4] Richmond, M.D., Pearce, R.C., Goff, B.M., Bailey, W.A. (2017). Analysis of variability in curing conditions and tobacco-specific nitrosamines within barns of dark air-cured tobacco. Tobacco Science, 54(1): 6-14. https://doi.org/10.3381/17-060
[5] Long, M., Hua, Y., Wang, X., Wang, Y., He, C., Huangfu, D., Zi, W. (2018). Effect of different combined moistening and redrying treatments on the physicochemical and sensory capabilities of smoking food tobacco material. Drying Technology, 36(1): 52-62. https://doi.org/10.1080/07373937.2017.1299752
[6] Chen, J., Li, Y., He, X., et al. (2021). Influences of different curing methods on chemical compositions in different types of tobaccos. Industrial Crops and Products, 167: 113534. https://doi.org/10.1016/j.indcrop.2021.113534
[7] Babu, A.K., Kumaresan, G., Raj, V.A.A., Velraj, R. (2018). Review of leaf drying: Mechanism and influencing parameters, drying methods, nutrient preservation, and mathematical models. Renewable and Sustainable Energy Reviews, 90: 536-556. https://doi.org/10.1016/j.rser.2018.04.002
[8] Hay, N., Bich, N.H., Giang, L.Q. (2014). A study on tobacco leaves dryer with 3 tons/batch capacity using paddy husk and coal. Vietnam Mechanical Engineering Journal, 5(65): 27-34. https://sti.vista.gov.vn/tw/Lists/TaiLieuKHCN/Attachments/227818/CTv57S52014027.pdf.
[9] Condorí, M., Albesa, F., Altobelli, F., Duran, G., Sorrentino, C. (2020). Image processing for monitoring of the cured tobacco process in a bulk-curing stove. Computers and Electronics in Agriculture, 168: 105113. https://doi.org/10.1016/j.compag.2019.105113
[10] Song, Z., Wei, F., Su, X., Wang, Y., Fan, Y., Wang, J.A. (2021). Application of automatic control furnace for combustion of biomass briquette fuel for tobacco curing. Thermal Science, 25(4 Part A): 2425-2435. https://doi.org/10.2298/TSCI191115148S
[11] Abubakar, Y., Young, J.H., Johnson, W.H., Weeks, W.W. (2003). Modeling moisture and chemical changes during bulk curing of flue–cured tobacco. Transactions of the ASAE, 46(4): 1123. https://doi.org/10.13031/2013.13935
[12] Abubakar, Y., Young, J.H., Johnson, W.H., Weeks, W.W. (2000). Changes in moisture and chemical composition of flue-cured tobacco during curing. Tobacco Science, 44: 51-58. https://doi.org/10.3381/0082-4623-44.1.51
[13] Nagai, A., Mine, T., Yamamoto, T., Wariishi, H. (2013). Transfructosylation reaction in cured tobacco leaf (Nicotiana tabacum). Journal of Bioscience and Bioengineering, 116(6): 666-671. https://doi.org/10.1016/j.jbiosc.2013.05.033
[14] Promtong, M., Tekasakul, P. (2007). CFD study of flow in natural rubber smoking-room: I. Validation with the present smoking-room. Applied Thermal Engineering, 27(11-12): 2113-2121. https://doi.org/10.1016/j.applthermaleng.2006.11.009
[15] Cao, G., Bao, Y., Wu, C., Wang, Y. (2017). Analysis on efficiency optimization of tobacco leaf flue-curing process. Procedia Engineering, 205: 540-547. https://doi.org/10.1016/j.proeng.2017.10.413
[16] Bao, Y., Wang, Y. (2016). Thermal and moisture analysis for tobacco leaf flue-curing with heat pump technology. Procedia Engineering, 146: 481-493. https://doi.org/10.1016/j.proeng.2016.06.377
[17] Bai, Z., Guo, D., Li, S., Hu, Y. (2017). Analysis of temperature and humidity field in a new bulk tobacco curing barn based on CFD. Sensors, 17(2): 279. https://doi.org/10.3390/s17020279
[18] Ansys, I. (2016). ANSYS CFX-Solver Theory Guide, Release 17.0. Ansys Inc, Canonsburg, PA 15317 https://www.scribd.com/document/344928476/ANSYS-CFX-Solver-Theory-Guide.
[19] Versteeg, H.K. (1995). An introduction to computational fluid dynamics: The finite volume method. (Harlow, Essex, England; Longman Scientific & amp; Technical: New York: Wiley).
[20] Verboven, P., Scheerlinck, N., De Baerdemaeker, J., Nicolaı̈, B.M. (2000). Computational fluid dynamics modelling and validation of the isothermal airflow in a forced convection oven. Journal of Food Engineering, 43(1): 41-53. https://doi.org/10.1016/S0260-8774(99)00131-4
[21] Rodriguez, S. (2019). Applied Computational Fluid Dynamics and Turbulence Modeling. Practical Tools, Tips and Techniques, S. Rodriguez, Ed. (Springer International Publishing, Cham, 2019), pp. 121-196.