Zainal Arifin* | Singgih Dwi Prasetyo | Bhimo Ageng Tribhuwana | Dominicus Danardono Dwi Prija Tjahjana | Rendy Adhi Rachmanto | Budi Kristiawan
© 2022 IIETA. This article is published by IIETA and is licensed under the CC BY 4.0 license (http://creativecommons.org/licenses/by/4.0/).
OPEN ACCESS
Solar energy is a clean, abundant, and low-emission renewable energy source. Photovoltaic (PV) technology can convert solar energy into electrical energy; however, it still has a poor output efficiency since high temperatures can lower PV efficiency. Phase Change Materials (PCM) can absorb latent heat, which can be applied to PV as a passive cooling system. In this study, 50 wp PV was treated without and with PCM as a passive cooling system to determine the PV performance. This study compares three PCM types: soy wax, paraffin, and beeswax. Utilizing the PV-PCM panel temperature modeling technique, the inaccuracy in the experimental data was ascertained. According to the simulation, soy wax, paraffin, and beeswax PV panels had average temperatures of 48.6℃, 45.8℃, and 42.6℃, respectively, at an intensity of 1100 W/m2. The experimental results show that PCM beeswax is the best in reducing the working temperature of PV from 60.7℃ to 52.5℃ at an intensity of 1100 W/m2. The results showed that PV with PCM beeswax treatment as a passive cooler could increase the maximum PV output power of 3.04 Watt and the maximum efficiency of PV by 0.94% by lowering the maximum temperature of PV by 8.2℃ compared to PV without a cooling system.
photovoltaic, passive cooling, phase change material
The earth receives light and heat from the sun as its energy output. Several researchers started to take off the utilization of this energy to create various types of energy. A solar panel is a method for converting solar energy into electrical energy [1, 2]. There are two basic types of solar panels, namely photothermal and photovoltaic. According to its purpose, photothermal turns solar radiation into heat energy for repeated demands and activities like drying crops, solar water heaters, solar stoves, and other similar things [3]. The photovoltaic (PV) system, which uses solar cell technology, converts photons from solar radiation into electrical energy. Functional PV modules typically have an efficiency of approximately 15% [4]. As a result, only 15% of the total incoming energy can be used to generate electricity from solar energy. This is due to the weaknesses of PV modules, one of which is that their efficiency decreases by 0.4% for every degree the temperature on their surface rises above the temperature at which they operate at their best [5, 6].
Reduce operating temperature and boost efficiency in photovoltaic solar panels using passive cooling technology. By exploiting natural convection, the passive approach reduces the working temperature of solar panels without using any more energy. As a result, the cooling process using passive cooling is often a bit slower and less efficient. The performance and efficiency of solar cells may be increased thanks to the invention and diversity of passive cooling equipment [7]. The most commonly used passive cooling technology in photovoltaic cells is the application of heatsinks. Through the implementation of PCM, it has been shown to be more effective in reducing the operating temperature and increasing the efficiency of the panels, but in the long term, it also requires more treatment as well. Using a Phase Change Material (PCM) in solar panels is one of the most accessible passive cooling techniques. PCM is renowned for being an effective latent heat absorber by altering its phase. As a result, PCM is anticipated to lower the solar panels' operating temperature and boost their effectiveness [8].
According to a study by Roslan and Razak [9], using PCM underneath the solar panel as a passive cooling device makes it possible to lower the operating temperature of solar panels by an average of 9.5℃ and boost electrical efficiency by an average of 11.82%. The research is an experiment in Selangor, Malaysia, conducted by Roslan and Razak by applying a solar panel cooler with PCM of solid paraffin type, which has a melting point at a temperature of 30℃ and varies it with solar panels without any cooling as a reference [9]. By absorbing the heat from the solar panel and turning it into liquid paraffin when the solar panel temperature rises beyond the paraffin's melting point, solid paraffin is predicted to lower the operating temperature of the solar panel. The results of experiments conducted by Roslan and Razak where the highest temperature of solar panels without PCM is 63.2℃, while solar panels integrated with PCM have the highest temperature of 58℃ with measurements of environmental temperature conditions and the same time. The highest difference in maximum output power occurs at 14:30 local time, which is 0.947 W or 11.82% greater than solar panels without PCM integration [9].
Singh et al. compared the performance of solar panels added with PCM of the hexahydrate calcium chloride (CaCl2.6H2O) type without any cooling as a reference. According to the experimental findings, using calcium chloride hexahydrate as a coolant can lower solar panels' typical maximum working temperature at 12:40 local time from 64.4℃ to 46.4℃ (28%) while also raising their typical maximum output power. Solar power from 99.5 W to 110.3 W (10.85%) at 12:20 local time under the same circumstances [10].
Differences in the use of PCM can affect the performance of heat absorption in solar panels considering the different properties of each PCM material. Therefore, this study compared three PCM types: soy wax, paraffin, and beeswax. The selection of these three PCM materials is based on previous research so that they can be analyzed more accurately [8]. Furthermore, PCM is relatively cheap and easy to obtain and installation. In order to lower PV temperature and improve PV performance, this study attempts to identify the optimal type of PCM. Experimental work was done for the study, and simulation results were used as backup (CFD).
The coating arrangement on a cooling system for solar panels is shown in Figure 1. The PV panel's back is covered by an aluminum casing that houses the PCM. No air gap exists between the PCM and the PV panel's back for optimum heat absorption. Using a single composite layer is the premise used in solar panel modeling [11-14]. The specs for each layer of the solar module are shown in Table 1.
Figure 1. PV panel cooling system coating
Table 1. Properties of each layer in PV panels [11]
|
Property |
Tempered Glass |
EVA |
PV cell |
EVA |
PVF |
|
Density (kg/m3) |
2450 |
960 |
2330 |
960 |
1200 |
|
Specific Heat Capacity (kJ/kg.K) |
0.79 |
2.09 |
0.667 |
2.09 |
1.25 |
|
Thermal Conductivity (W/mK) |
0.7 |
0.311 |
130 |
0.311 |
0.15 |
|
Thickness (mm) |
3.2 |
0.5 |
0.21 |
0.5 |
0.3 |
ANSYS 18 is a steady state thermal simulation program for computational fluid dynamics (CFD). The radiation intensity is supplied to the PV panel surface at a heat flux of 1100 W/m2. Another method automatically splices and just considers a convection loss of 8 W/m2 ℃. Following the simulation, the fluid-solid contact is used to compute temperature. As long as tempered glass reflects 3-10% of solar energy to the environment, polycrystalline silicon typically has an electrical efficiency of 11%-20% [11, 14].
The experiment was set up at Sebelas Maret University at Surakarta's Mechanical Engineering Laboratory. In Surakarta, a solar simulator system with 20 500-Watt halogen lights and a blower miming an average wind speed of 2.5 m/s was employed to simulate the sun. The reason a solar simulator was used in this experiment is that the radiation intensity can be uniformly adjusted, which speeds up the data collecting. Additionally, Surakarta's weather was transitioning from a dry to rainy season during the time of data collection, which caused irregular sun radiation. Before the aluminum foil was opened and exposed to the solar simulator light for 40 minutes, the solar simulator's intensity stabilized under PV circumstances for the first 15 minutes. The halogen lamp is perpendicular to the PV on the solar simulator, which is 2.5 meters high [15, 16]. With less than 5% non-uniformity, the halogen light is 75 cm from the PV [17]. Nine blower fans are arranged in a 3x3 arrangement to simulate an average wind speed of 2.5 m/s in Surakarta. A cross-section of 1.1 m by 1.1 m is covered by the selection of the distance between each blower at intervals of 0.55 m [18]. The blower settings aim to make the natural conditions as similar as possible to the test conditions on direct radiation sunlight. In this case, the blower's wind speed is 2.5 m/s measured with an anemometer mounted in the center of the solar panel, which has been adjusted for Surakarta’s annual average wind speed. PCM is used in photovoltaic solar panels as a passive cooling system. By altering its phase, PCM will collect latent heat and release it into the surrounding space.
The primary device employed in this study to excite electrons and transform them into electrical energy is photovoltaic solar panels. A 50 Wp (Watt peak) polycrystalline photovoltaic solar cell module made by Yingli Co., Ltd., with the parameters shown in Table 2 below, is the type of photovoltaic solar cell module that is utilized.
Table 2. Yingli Co., Ltd. solar cell module specifications
|
Specification |
Score |
|
Cell (material/dimension) |
Polycrystalline Silicon / 156 x 52 mm |
|
Open-circuit voltage (VOC) |
22.9 V |
|
Short-circuit current (ISC) |
2.87 A |
|
Maximum power (PMPP) |
50 Wp |
|
Efficiency |
14% |
|
Operating module temperature |
-40℃ to 85℃ |
|
Dimension |
660 x 540 x 25 mm |
|
Temperature coefficient of power |
-0.45% per ℃ |
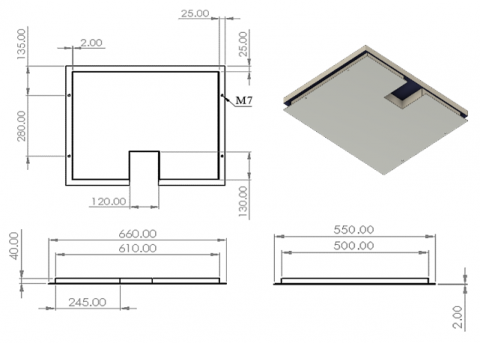
Figure 2. PCM container dimensions and geometry (in mm)
In addition to providing a location for the solar panel to stand and absorb heat, the container also functions as a PCM container. By matching the maximum thickness of the PCM utilized with the height of the container, the PCM and the back of the solar panel are built such that there is no air gap between them, maximizing heat absorption. Figure 2 and Table 3 indicate the PCM container's dimensions.
Table 3. PCM container specifications
|
Specification |
Information |
|
Material |
Aluminum |
|
Total size (W×W×H) |
660 × 550 × 42 mm |
|
The thickness of each plate |
3 mm |
PV solar panels employ PCM as a passive cooling system. By altering its phase, PCM will collect heat as latent heat and release it into the surroundings. Soy wax, paraffin, and beeswax were the PCM kinds employed; their parameters are listed in Table 4.
Table 4. Characteristics of PCM
|
Specification |
Soy wax [19-23] |
Paraffin [19, 20, 24-27] |
Beeswax [21, 26, 28-32] |
|
Melting point (℃) |
43.9 – 45.06 |
57 – 60.8 |
61.3 – 64.2 |
|
Latent heat (kJ/kg) |
100.9 – 127.2 |
134.9 – 135.35 |
141.4 – 177 |
|
Thermal Conductivity (W/mK) |
0.25 – 0.324 |
0.186 – 0.320 |
0.25 – 0.41 |
|
Heat capacity (kJ/kg.K) |
0.496 |
0.245 – 1.959 |
0.476 – 0.508 |
|
Density (kg/m3) |
900 |
760 – 910 |
811 – 907 |
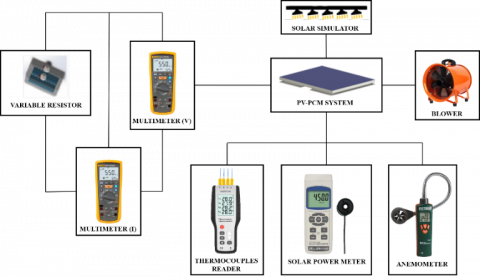
The data gathering method in this investigation requires the usage of various gadgets. In Figure 3, the experimental scheme is displayed. A solar power meter for measuring output voltage and output current, two multimeters for measuring voltage output and current output, a Yingli Solar JS 50 Wp PV with a PCM receptacle where the PCM is inserted, and a PV mount as indicated in Figure 3. Eight type-K thermocouples were positioned on the top and bottom of the PV surface to measure the amount of radiation it radiated, and an anemometer was used to gauge the speed of the air around it for the experiment.
Figure 3. Experimental schematic setup
A current-voltage curve can describe how well solar cells function (I-V curve). Because it is the most straightforward approach, the variable resistor method is utilized in this study to determine the I-V curve features of solar cells [33]. The variable resistor method is used to determine the ratio value of Isc and Voc more accurately so that the amount of power and efficiency can be obtained more optimally. By measuring I-V curve, it is possible to characterize solar cells and get several metrics, including open-circuit photovoltage (Voc), short-circuit photocurrent (Isc), fill factor (FF), and efficiency ($\eta$). The variable resistor technique produces an I-V characteristic curve that complies with the solar cell requirements by varying the resistance value from zero to infinity to further compute the voltage and current at each point [33, 34]. From the resulting I-V curve, parameters can be calculated to measure the performance of solar cells.
Short circuit current (ISC) is a state of very high current (I), assuming minimum electrical resistance (R) or no resistance. The relationship between current (I) and output voltage (V) of solar cells can be formulated by the following equation:
$I=I_{S C}\left(1-e^{\frac{V-V_{O C}}{m\cdot V_T}}\right)$ (1)
The most excellent multiplication of current (IMPP) and voltage (VMPP) in the circuit occur at the Maximum Power Point (PMPP), which is defined by the following equation:
$P_{M P P}=V_{M P P} \times I_{M P P}$ (2)
where,
$I_{M P P}=\frac{G}{G^r} \times I_{M P P}^r$ (3)
$V_{M P P}=m \cdot V_T \cdot \ln \left(\frac{I_{S C}-I_{M P P}}{I_0}\right)$ (4)
The Fill Factor (FF) contrasts the maximum power (PMPP) with the addition of VOC and ISC. FF plays a role in identifying the most optimal conditions that can be obtained through the relationship of ISC and VOC. The equation to determine the fill factor is as follows:
$F F=\frac{P_{M P P}}{I_{S C} \times V_{O C}}=\frac{I_{M P P} \times V_{M P P}}{I_{S C} \times V_{O C}}$ (5)
Depending on the PV's efficiency, it is possible to assess its quality and whether it operates under ideal conditions. The power generated will be maximized, and the losses will be reduced if the PV panel has excellent efficiency. According to the definition, the total energy (electric and thermal) of solar energy exposed to the surface between the generated output energy (electrical energy) and solar energy reaching the PV surface may be used to describe photovoltaic work efficiency:
$\eta=\frac{P_{M P P}}{P_{\text {light }}}=\frac{P_{M P P}}{I_{\text {rad }} \times A}=\frac{I_{S C} \times V_{O C} \times F F}{I_{\text {rad }} \times A}$ (6)
The maximum power (PMPP) to the power from solar radiation that solar cells receive is measured as work efficiency ($\eta$). (Plight). In comparison, solar radiation's power (Plight) is produced by multiplying sunlight's intensity (Irad) by the solar cell's active area (A).
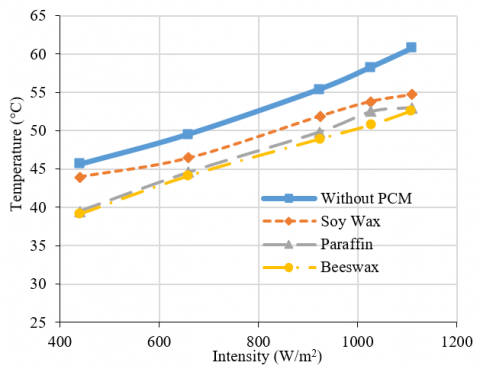
High PV operating temperatures directly affect PV performance [5]. The purpose of PCM is to reduce the PV's extremely high-temperature rise to increase PV efficiency. According to earlier studies, PV with PCM used as passive cooling performs better than PV without a cooling system [9, 10, 35]. Figure 4 depicts how intensity affects PV temperature. PV panels with paraffin, PV panels with soy wax, and PV panels with beeswax are the variants that were employed in this experiment.
Figure 4. Relationship between solar simulator intensity and PV temperature
All PV cooler modifications exhibit a rise in temperature and an increase in intensity value, as shown in Figure 4. The relationship between light intensity and PV temperature is thus established. With PV and a light intensity of 1100 W/m2, the most significant temperature was reached without a cooling system. PV without a cooling mechanism, PV made of soy wax, PV made of paraffin, and PV made of beeswax have respective temperatures of 60.7℃, 54.7℃, 53.0℃, and 52.5℃. The PV temperature drops as a result of each PCM.
The simulations produce similar values using computational fluid dynamics (CFD). Simulations were run under steady-state settings. Node and element values from the meshing simulation are 120834 and 19126, respectively. The average value of the standard mesh with skewness matrix is 3.6795.10-3, which shows that the mesh quality is very high and the likelihood of a mistake is very low. Figure 5 displays the steady-state PCM temperature curve with a heat flow of 1100 W/m2. The average temperatures of beeswax, paraffin and soy wax are 48.6℃, 45.8℃, and 42.6℃, respectively. The lowest working temperature is for beeswax.
A substance's latent heat makes it possible for the material to absorb and store thermal energy without affecting its actual temperature [5, 36, 37]. The capacity to absorb and store heat energy increases as latent calorific value increases. A material's thermal conductivity value affects how quickly heat is transferred during heat absorption or release. Hence a material's freezing and thawing process take longer when the thermal conductivity value is lower [5, 36]. Among the three forms of PCM, soy wax and beeswax have the two highest thermal conductivity ratings, while paraffin has the lowest. The beeswax variant can lower the maximum PV temperature among the other three PCMs, which is 8.2℃, and has the most considerable latent calorific value and thermal conductivity, making it ideal in the heat absorption process in PV.
(a) Soy wax
(b) Paraffin
(c) Beeswax
Figure 5. Temperature simulation results
Figure 6. PCM melting
Figure 6 shows the PCM process when it absorbs latent heat in PV by changing its state to a liquid form. Point A is PCM which is still solid, and point B is PCM which has melted. If the PCM does not receive excess latent heat, the PCM will release the absorbed heat to the environment and change its form to a solid again.
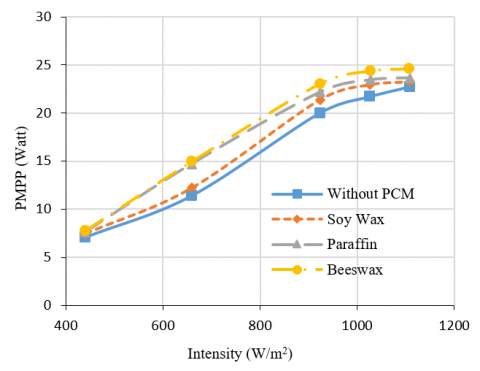
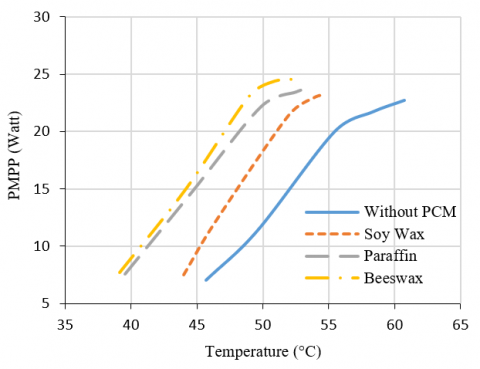
According to Figure 7, the maximum power value is directly related to the amount of light the PV receives. Therefore, the higher the light intensity value, the higher the maximum power value. The lowest maximum power of each variation is obtained at a light intensity of 400 W/m2, and each variation's most excellent maximum power is reached at a light intensity of 1100 W/m2. In PV without cooling, the maximum power increases gradually from 7.05 W to 22.75 W. In PV using PCM in the form of soy wax, the maximum power increases gradually from 7.48 W to 23.23 W. In PV using PCM, the maximum power increases gradually from 7.48 W to 23.23 W. in the form of paraffin, the maximum power increases gradually from 7.60 W to 23.67 W. In PV that applies PCM in the form of beeswax, the maximum power increases gradually from 7.74 W to 24.
Figure 7. Effect of intensity (W/m2) on maximum power (Watt)
The PV temperature is precisely related to the maximum power, as illustrated in Figure 8, just as the intensity is to the maximum power. The variation with the lowest temperature has the most considerable maximum power at the same intensity. At an intensity of 1100 W/m2, the maximum power of PV without cooling is 22.75 W at a PV temperature of 60.7℃. The maximum power of PV by applying PCM in the form of soy wax is 23.23 W at a PV temperature of 54.7℃, the maximum power of PV by applying PCM in the form of paraffin is 23.67 W at PV temperature of 53.0℃, and the maximum power of PV by applying PCM in the form of beeswax is 24.60 W at PV temperature of 52.5℃. After passing the Intensity of 1100 w/m2, there is an indication of a decrease in the trend chart due to the ability of the heat retaining system which is no longer effective in maintaining the temperature of the PV panel. This is because the photon energy of an intensity of 1000 m/s2 greatly exceeds the capacity that can be accepted by the panel, so that the photon energy becomes residual heat which makes the efficiency of the panel decrease.
Figure 8. Effect of temperature (℃) on maximum power (Watts)
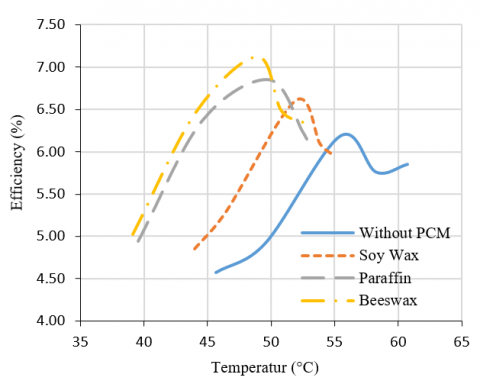
The higher the light intensity received by the PV, the higher the PV temperature. Therefore, the working efficiency of PV also depends on the temperature of the PV itself. PV, which has a lower temperature, has higher efficiency under the same light intensity conditions. The data collection process is treated as a function of time, where each cooling variation is treated simultaneously as stabilizing the intensity for 10 minutes and exposing PV with a solar simulator for 15 minutes. In the calculation of the data carried out, the highest efficiency of all variations was obtained, namely in PV, which applied PCM passive cooling in the form of beeswax, namely 7.12% with a light intensity of 900 W/m2 and a PV temperature of 48.9℃. Uncooled PV has the highest efficiency of 6.18% at a PV temperature of 55.4℃. The maximum efficiency of 6.60% at a PV temperature of 51.9℃ is achieved by PV that uses PCM passive cooling in the form of soy wax. The maximum efficiency of 6.85% is achieved by PV employing PCM passive cooling in the form of paraffin at a PV temperature of 49.8℃. Figure 9 illustrates that at a PV temperature of 48.94℃, PV utilizing PCM passive cooling in the form of beeswax has a maximum efficiency of 7.12%. The maximum efficiency of PV may be increased by 0.42%, 0.67%, and 0.27%, respectively, by passive cooling with soy wax, paraffin, and beeswax.
Figure 9. Relationship between PV temperature and efficiency
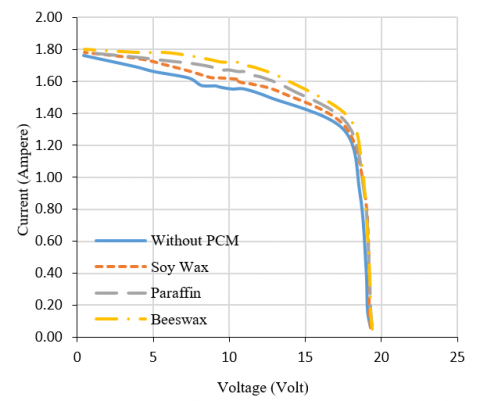
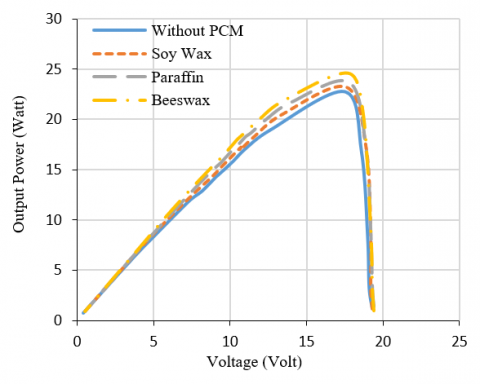
The current, voltage and output power generated by solar energy at 1100 W/m2 are depicted in Figures 10 and 11. PV systems without a cooling system, those utilizing soy wax, paraffin, and beeswax, respectively, had temperatures of 60.7℃, 54.7℃, 53.0℃, and 52.5℃. The value of VOC, ISC, temperature, and PV's maximum power (PMPP) are a few of the variables that impact how well PV performs as it gets more efficient. The ISC value increased in all variations along with the addition of the light intensity received by the PV. In contrast to ISC, the value of VOC decreases in all variations as the intensity of light received by the PV increases. The maximum power of PV increases in all variations as the intensity of light received by PV also increases. VOC, ISC, and PMPP values are closely related to the PV temperature. With the same light intensity, the variation of PV, which produces a lower working temperature, has a higher efficiency value. At all light intensity levels, PV that applies PCM passive cooling in the form of beeswax produces the lowest PV temperature and the highest efficiency value, among other variations. At an intensity of 1100 W/m2, PV using PCM passive cooling in the form of beeswax has a PV temperature of 52.5℃ and work efficiency of 6.34% at the same light intensity level as other variations.
Figure 10. The relationship between voltage and current at an intensity of 1100 W/m2
Figure 11. The relationship between voltage and output power at an intensity of 1100 W/m2
Compared to PV without cooling variations, PV that uses PCM passive cooling in the form of beeswax can lower the PV temperature by 8.2℃ and raise the maximum work efficiency by 0.94%. PV variations that produce lower working temperatures have higher efficiency values. At all light intensity levels, PV that applies PCM passive cooling in the form of beeswax produces the lowest PV temperature and the highest efficiency value, among other variations.
In order to identify whether PCM can lower the PV temperature so that PV efficiency rises, this study compares three variants of PCM, including soy wax, paraffin, beeswax, and PV without a cooling system. This study concludes that, compared to other PCM modifications, the variation of PV applied by beeswax has the most negligible impact on decreasing the PV temperature. Compared to PV without a cooling system, the results revealed that PV applied with beeswax as a passive cooler could raise the maximum PV output power of 3.04 Watts and the maximum efficiency of PV by 0.94 percent by reducing the maximum PV temperature by 8.2℃.
The author acknowledges Sebelas Maret University in their support (UNS). The Ministry of Research, Technology, and Higher Education of the Republic of Indonesia provided the total funding for this study through a grant from PDUPT 2022 with the title "Optimization of Cooling Systems to Improve Performance of Photovoltaic Solar Cells" (research grant number 673.1/UN27.22/PT.01.03/2022).
[1] Ginley, D., Green, M.A., Collins, R. (2008). Solar energy conversion toward 1 terawatt. MRS Bulletin, 33(4): 355-364. https://doi.org/10.1557/mrs2008.71
[2] Prasetyo, S.D., Prabowo, A.R., Arifin, Z. (2022). The effect of collector design in increasing PVT performance: Current state and milestone. Materials Today: Proceedings, 63(1): S1-S9. https://doi.org/https://doi.org/10.1016/j.matpr.2021.12.356
[3] Chen, M., He, Y., Huang, J., Zhu, J. (2017). Investigation into Au nanofluids for solar photothermal conversion. International Journal of Heat and Mass Transfer, 108: 1894-1900. https://doi.org/10.1016/j.ijheatmasstransfer.2017.01.005
[4] Rif’an, M., Pramono, S.H., Shidiq, M., Yuwono, R., Suyono, H., Suhartati, F. (2012). Optimasi pemanfaatan energi listrik tenaga matahari di jurusan teknik elektro universitas brawijaya. Jurnal EECCIS, 6(1): 44-48.
[5] Kurniawan, L. (2019). Peningkatan Efisiensi Sel Surya Dengan Menggunakan Phase Change Material (Pcm) Berbahan Dasar Parafin Sebagai Media Pendingin. https://docplayer.info/175520462-Peningkatan-efisiensi-sel-surya-dengan-menggunakan-phase-change-material-pcm-berbahan-dasar-parafin-sebagai-media-pendingin.html, accessed on 27 July 2022.
[6] Prasetyo, S.D., Prabowo, A.R., Arifin, Z. (2022). Investigation of thermal collector nanofluids to increase the efficiency of photovoltaic solar cells. International Journal of Heat and Technology, 40(2): 415-422. https://doi.org/10.18280/ijht.400208
[7] Hasanuzzaman, M., Malek, A.B.M.A., Islam, M.M., Pandey, A.K., Rahim, N.A. (2016). Global advancement of cooling technologies for PV systems: A review. Solar Energy, 137: 25-45. https://doi.org/10.1016/j.solener.2016.07.010
[8] Arifin, Z., Tribhuwana, B.A., Kristiawan, B., Tjahjana, D.D.D.P., Hadi, S., Rachmanto, R.A., Prasetyo, S.D., Hijriawan, M. (2022). The effect of soybean wax as a phase change material on the cooling performance of photovoltaic solar panel. International Journal of Heat and Technology, 40(1): 326-332. https://doi.org/10.18280/ijht.400139
[9] Bin Mohd Roslan, M.E., Razak, A. (2019). Performance effect of applying paraffin wax on solar photovoltaic backplate. Indonesian Journal of Electrical Engineering and Computer Science, 14(1): 375-380. https://doi.org/10.11591/ijeecs.v14.i1.pp375-380
[10] Singh, P., Mudgal, V., Khanna, S., Mallick, T.K., Reddy, K.S. (2020). Experimental investigation of solar photovoltaic panel integrated with phase change material and multiple conductivity-enhancing-containers. Energy, 205: 118047. https://doi.org/10.1016/j.energy.2020.118047
[11] Arifin, Z., Tjahjana, D.D.D.P., Hadi, S., Rachmanto, R.A., Setyohandoko, G., Sutanto, B. (2020). Numerical and experimental investigation of air cooling for photovoltaic panels using aluminum heat sinks. International Journal of Photoenergy, 2020: 1-9. https://doi.org/10.1155/2020/1574274
[12] Armstrong, S., Hurley, W.G. (2010). A thermal model for photovoltaic panels under varying atmospheric conditions. Applied Thermal Engineering, Elsevier, 30(11-12): 1488-1495. https://doi.org/10.1016/j.applthermaleng.2010.03.012
[13] Liu, L., Wang, Q., Lin, H., Li, H., Sun, Q., Wennersten, R. (2017). Power generation efficiency and prospects of floating photovoltaic systems. Energy Procedia, 105: 1136-1142. https://doi.org/10.1016/j.egypro.2017.03.483
[14] Arifin, Z., Prasetyo, S.D., Prabowo, A.R., Tjahjana, D.D.D.P., Rachmanto, R.A. (2021). Effect of thermal collector configuration on the photovoltaic heat transfer performance with 3D CFD modeling. Open Engineering, 11(1): 1076-1085. https://doi.org/10.1515/eng-2021-0107
[15] Hussain, F., Othman, M.Y.H., Yatim, B., Ruslan, H., Sopian, K., Anuar, Z., Khairuddin, S. (2011). Fabrication and irradiance mapping of a low cost solar simulator for indoor testing of solar collector. Journal of Solar Energy Engineering, Transactions of the ASME, 133(4): 1-4. https://doi.org/10.1115/1.4004548
[16] Arifin, Z., Kuncoro, I.W., Hijriawan, M. (2021). Solar simulator development for 50 WP solar photovoltaic experimental design using halogen lamp. International Journal of Heat and Technology, 39(6): 1741-1747. https://doi.org/10.18280/ijht.390606
[17] Irwan, Y.M., Leow, W.Z., Irwanto, M., Fareq, M., Amelia, A.R., Gomesh, N., Safwati, I. (2015). Indoor test performance of PV panel through water cooling method. Energy Procedia, 79: 604-611. https://doi.org/10.1016/j.egypro.2015.11.540
[18] Wong, K.H., Chong, W.T., Sukiman, N.L., Shiah, Y.C., Poh, S.C., Sopian, K., Wang, W.C. (2018). Experimental and simulation investigation into the effects of a flat plate deflector on vertical axis wind turbine. Energy Conversion and Management, 160: 109-125. https://doi.org/10.1016/j.enconman.2018.01.029
[19] Trisnadewi, T., Kusrini, E., Nurjaya, D.M., Putra, N., Mahlia, T.M.I. (2021). Experimental analysis of natural wax as phase change material by thermal cycling test using thermoelectric system. Journal of Energy Storage, 40: 102703. https://doi.org/10.1016/j.est.2021.102703
[20] Cui, Y., Liu, C., Hu, S., Yu, X. (2011). The experimental exploration of carbon nanofiber and carbon nanotube additives on thermal behavior of phase change materials. Solar Energy Materials and Solar Cells, 95(4): 1208-1212. https://doi.org/10.1016/j.solmat.2011.01.021
[21] Elarem, R., Alqahtani, T., Mellouli, S., Askri, F., Edacherian, A., Vineet, T., Badruddin, I.A., Abdelmajid, J. (2021). A comprehensive review of heat transfer intensification methods for latent heat storage units. Energy Storage, 3(1). https://doi.org/10.1002/est2.127
[22] Yoo, J., Chang, S.J., Wi, S., Kim, S. (2019). Spent coffee grounds as supporting materials to produce bio-composite PCM with natural waxes. Chemosphere, 235: 626-635. https://doi.org/10.1016/j.chemosphere.2019.06.195
[23] Cotfas, D., Cotfas, P., Machidon, O. (2018). Study of temperature coefficients for parameters of photovoltaic cells. International Journal of Photoenergy. https://doi.org/10.4324/9780080498355-10
[24] Şahan, N., Fois, M., Paksoy, H. (2015). Improving thermal conductivity phase change materials - A study of paraffin nanomagnetite composites. Solar Energy Materials and Solar Cells, 137: 61-67. https://doi.org/10.1016/j.solmat.2015.01.027
[25] Hussain, A., Abidi, I.H., Tso, C.Y., Chan, K.C., Luo, Z., Chao, C.Y.H. (2018). Thermal management of lithium ion batteries using graphene coated nickel foam saturated with phase change materials. International Journal of Thermal Sciences, 124: 23-35. https://doi.org/10.1016/j.ijthermalsci.2017.09.019
[26] Sinaringati, S., Putra, N., Amin, M., Afriyanti, F. (2016). The utilization of paraffin and beeswax as heat energy storage in infant incubator. ARPN Journal of Engineering and Applied Sciences, 11(2): 800-804.
[27] Xiao, X., Zhang, P. (2013). Morphologies and thermal characterization of paraffin/carbon foam composite phase change material. Solar Energy Materials and Solar Cells, 117: 451-461. https://doi.org/10.1016/j.solmat.2013.06.037
[28] Amin, M., Putra, N. (2016). Karakterisasi Phase Change Material (PCM) Lokal Indonesia. Seminar Nasional Tahunan Teknik Mesin (SNTTM) XV 2016, (Snttm Xv), 84.
[29] Amin, M., Putra, N., Kosasih, E.A., Prawiro, E., Luanto, R.A., Mahlia, T.M.I. (2017). Thermal properties of beeswax/graphene phase change material as energy storage for building applications. Applied Thermal Engineering, 112: 273-280. https://doi.org/10.1016/j.applthermaleng.2016.10.085
[30] Sharma, A., Tyagi, V.V., Chen, C.R., Buddhi, D. (2009). Review on thermal energy storage with phase change materials and applications. Renewable and Sustainable Energy Reviews, 13(2): 318-345. https://doi.org/10.1016/j.rser.2007.10.005
[31] Putra, N., Prawiro, E., Amin, M. (2016). Thermal properties of beeswax/CuO nano phase-change material used for thermal energy storage. International Journal of Technology, 7(2): 244-253. https://doi.org/10.14716/ijtech.v7i2.2976
[32] Rudra Murthy, B.V., Gumtapure, V. (2020). Thermo-physical analysis of natural shellac wax as novel bio-phase change material for thermal energy storage applications. Journal of Energy Storage, 29: 101390. https://doi.org/10.1016/j.est.2020.101390
[33] Duran, E., Piliougine, M., Sidrach-De-Cardona, M., Galan, J., Andujar, J.M. (2008). Different methods to obtain the I-V curve of PV modules: A review. Conference Record of the IEEE Photovoltaic Specialists Conference, pp. 1-6. https://doi.org/10.1109/PVSC.2008.4922578
[34] Arifin, Z., Hadi, S., Jati, H.N., Prasetyo, S.D., Suyitno. (2020). Effect of electrospinning distance to fabricate ZnO nanofiber as photoanode of dye-sensitized solar cells. AIP Conference Proceedings, 2217(1). https://doi.org/10.1063/5.0000705
[35] Zhao, J., Li, Z., Ma, T. (2018). Performance analysis of a photovoltaic panel integrated with phase change material. Energy Procedia, 158: 1093-1098. https://doi.org/10.1016/j.egypro.2019.01.264
[36] Saputra, I. (2020). Kajian perpindahan panas pada partisi dinding yang mengandung material berubah fasa berupa parafin untuk aplikasi ruang sejuk. SKRIPSI, 21(1). https://doi.org/10.1016/j.solener.2019.02.027
[37] Foncesa, I.A. (2019). Analisis Unjuk Kerja Evacuated Tube Solar Collector Terkonsentrasi Dengan Variasi Pcm (Paraffin Dan Beewax). https://repository.unej.ac.id/bitstream/handle/123456789/89962/IZHAR%20AMEDIO%20FONCESA%20NOOR-141910101095_1.pdf?sequence=1, accessed on 27 July 2022.